AUC-ROC : Solid Understanding
so far you know about many classification evaluation metrices like F1 score ,Precision ,Recall .
AUC-ROC : Solid Understanding
so far you know about many classification evaluation metrices like F1 score ,Precision ,Recall .
so this time you’ll be learning about AUC — ROC curve .
The AUC-ROC, or Area Under the Receiver Operating Characteristic Curve, is a robust metric that evaluates the goodness of the model across the full spectrum of thresholds.
why we need AUC_ROC curve what it solves ?? what is its significance?
since we were dealing with classification problem such as Spam email classification ,algorithms like logistical regression , decision tree classifier eternally give the probability of the outcome such as is_spam or not , we have to manually set the threshold which some time 0.5 but it is not the always case because in different situations we have to balance the trade off between the type 1 error and type 2 error .
Other evaluation methods cannot significantly tell which model is performing better , ROC-AUC is a robust metric that evaluates the goodness of the model across the full spectrum of thresholds.
Measuring performance
AUC-ROC provides an aggregate performance measure across all possible classification thresholds. Unlike accuracy, precision, or F1-score that depend on a specific threshold, it considers the model performance at different operating points.
Model comparison
AUC-ROC is a single scalar value that makes it easier to compare multiple models, regardless of their classification thresholds. Its threshold-independent nature makes it a better choice to draw a fair comparison between models with different optimal thresholds.
What is the ROC Curve?
The ROC curve gives a visual representation of the trade-offs between the true positive rate (TPR) and false positive rate (FPR) at various thresholds. It provides insights into how well the model can balance the trade-offs between detecting positive instances and avoiding false positives across different thresholds.
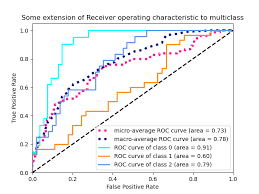

AUC, or Area Under the Curve, is a single scalar value ranging from 0 to 1, that gives a performance snapshot of the model. You only calculate AUC after generating the ROC curve because the AUC represents the area beneath the curve. The rule of thumb is The higher the AUC the better the model
Similar to the other evaluation terms ,it is also originated from the confusion matrix .
we have to understand the confusion matrix before ROC true postive and ture negatve rate .


confusion matrix
here the second image is of our spam mail detection .
on left there is actual label of the mail ,that are spam and no spam and same with prediction by model .
TP : true positive is what model predict true(spam) and actual is true(spam)
TN: it is when model predict not spam and actual it was not spam.
FN(type1 error) :It is when model predict to be not spam when actually it was a spam mail.
FP (type 2 ) : It is when model predict to be spam but it was not a spam .
True positive rate
The true positive rate, also known as sensitivity or recall, reflects a model’s ability to correctly identify positive instances. It measures the proportion of actual positive cases that the model successfully identifies. Mathematically, this can be expressed by the following equation:

Where:
- TP or true positives are the number of positive class records the model correctly predicts as positive.
- FN or false negatives are the number of positive class records the model incorrectly predicts as negative.
False positive rate
FPR represents how often our model incorrectly classifies negative class instances as positive. It measures the proportion of actual negative instances that are incorrectly identified as positive by the model, indicating the rate of false alarms. Mathematical this can be expressed as follows.

Where:
- FP or false positives are the number of negative class records that are incorrectly predicted as positive.
- TN or true negatives are the number of negative class records that are correctly predicted as negative.
Let’s understand scenarios where AUC-ROC is a more relevant metric.
메타데이터
- post_id
- d1f1bf498ffa
- slug
- auc-roc-solid-understanding-d1f1bf498ffa
- url
- https://medium.com/@mayankgariya482/auc-roc-solid-understanding-d1f1bf498ffa
- canonical_url
- https://medium.com/@mayankgariya482/auc-roc-solid-understanding-d1f1bf498ffa
- author_url
- https://medium.com/@mayankgariya482
- status
- ok
- fetched_at
- 2026-06-27 23:56:40