ETF analysis with web Scraping
Continuing the story I wrote…
ETF analysis with web Scraping
Continuing the story I wrote: https://medium.com/@jdgb.projects/choosing-the-best-etf-with-web-scrapping-2a4d99b4e68f?sk=9992129b50b177d3575824f3449e8e72
I have continued to gather information on the ETFs listed by Degiro, in order to be able to make an analysis.
Summarising the process I have executed, the first thing I did was to obtain the list of ETFs with zero fees, then I obtained more information by web scraping from other websites.
It is important to be careful when web scraping so that you don’t get blocked from websites.
If you don’t know how to do web scraping you can see the article I wrote about the use of selenium in Python: https://medium.com/@jdgb.projects/selenium-basics-to-automate-whatever-you-want-d87096c1e270
Once we have collected information from different data sources, it is important to process it properly, in order to make good analyses.
This process includes having the information in the right format and type of data, excluding incomplete information from the study,…
And once we have everything ready, let’s look at the results.
Analysis of the information
The analysis I have carried out is as follows: On the one hand, I have focused on looking for ETFs that have performed well on average over the last 10 years.
I have done this because I consider myself to be a more long-term investor. I could have done other analyses taking into account a shorter period of time, but this was not the case.
On the other hand, I have also studied the return I can get from dividends. Anyone who wants to become financially independent has to look for different sources of income, and dividend income is a great option.
Top ETFs in yield
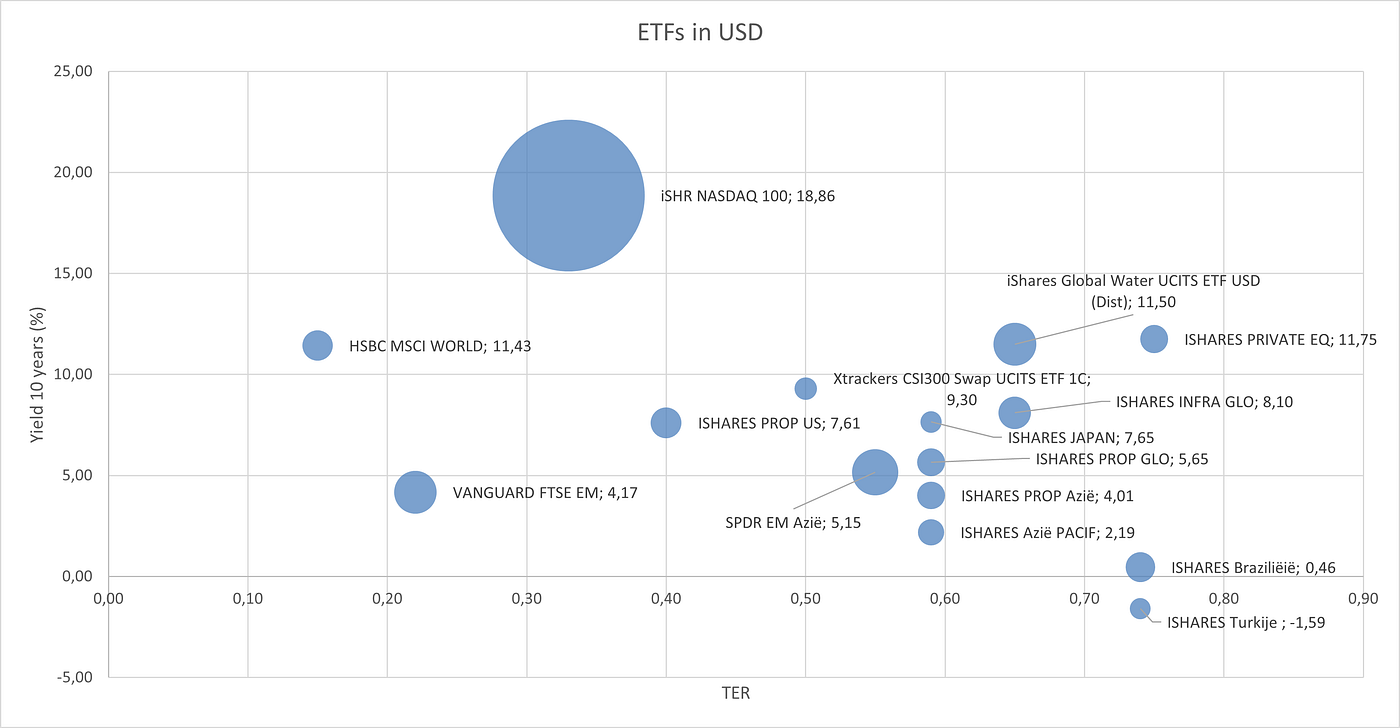
In the first analysis I compared the performance of ETFs with their TER, using a bubble chart. The size of the bubble will be determined by the price of the ETF.
Another aspect I considered was to divide ETFs into two groups according to the currency in which they were priced. So we will have two groups: dollars and euro.
ETFs priced in dollars
In this first chart we can see that two ETFs stand out. The first of these is the HSBC MSCI WORLD, which is a global ETF with an ESG A rating and has a very high yield with a very low TER of only 0,15. From the size of their bubble we can see that the price of each share is also very low.
We can also see that the iSHR NASDAQ 100 ETF is the best performer, with a TER that is also not very high at 0.33.
We will now look at ETFs priced in euro.

ETFs priced in euro
In this chart it is more difficult to see the information because of the large number of ETFs, but we can distinguish two groups. The first group is those ETFs that replicate the SP500 index, which as we can see have good performance and low TERs. On the other hand, here again we see an ETF that replicates the NASDAQ index, which has similar characteristics to what we have seen in the previous example.
Top ETFs in dividends
Now let’s turn to the ETFs that stand out for dividends. If we look at those priced in dollars we see the following classification:

The ETF ISHARES Braziliëië stands out above the rest. It is a Brazilian Financial Services ETF with a TER of 0,74. The rest of the top is made up of ETFs, mainly REITs.

On the euro-denominated ETF side, things are more evenly matched. The first ETF we have is ISHARES ESTOXX DIV, a European ETF with a good TER, a good ESG valuation, but which has been underperforming for the last 5 years. As before, REITs stand out in these tops.
Conclusions
As you have seen, many conclusions can be drawn from the information obtained through web scraping. When you invest, you always want to have the best possible information.
In this story I have given you some examples of analysis, but there are many other data that can be exploited that have not been mentioned here.
I leave you a link to Gumroad where you can get the excel that I have obtained, where I leave the analysis done, for those who want to do their own analysis: https://softwarejd.gumroad.com/l/cnzdqc
Please let me know in the comments if you would like me to do a specific analysis of these ETFs.
Thank you very much for your attention.
메타데이터
- post_id
- d2a55a2c253a
- slug
- etf-analysis-with-web-scrapping-d2a55a2c253a
- url
- https://medium.com/trading-data-analysis/etf-analysis-with-web-scrapping-d2a55a2c253a
- canonical_url
- https://medium.com/trading-data-analysis/etf-analysis-with-web-scrapping-d2a55a2c253a
- author_url
- https://medium.com/@jdgb.projects
- status
- ok
- fetched_at
- 2026-07-26 13:28:39