Building the UK Political Atlas
Designing and engineering an application to help voters in the United Kingdom stay informed
Building the UK Political Atlas
Designing and engineering an application to help voters in the United Kingdom stay informed
About two months before the snap general election to break the Brexit impasse on December 12, 2019, I was approached by Graphicacy and Ipsos (US and Ipsos MORI). We partnered with their teams to design and build a web and mobile responsive application that would help reverse the course of ambivalence and uninformed voting in the United Kingdom. Traditionally, to stay informed, voters needed to parse through tens, if not hundreds, of newspaper, social media, and polling sites on a daily basis. But with the power of data visualization and user experience (UX) design the team was able to aggregate all the disparate sources into a single easily digestible application to keep voters informed on both a candidate and constituency level. In this article, we will walk through the process for delivering on this application, as well as some development and project management takeaways.

Data Visualization Sketches
As in every new project, the team started by taking the requirements for the application and developing a set of rough sketches of both the UI and the data visualization components.
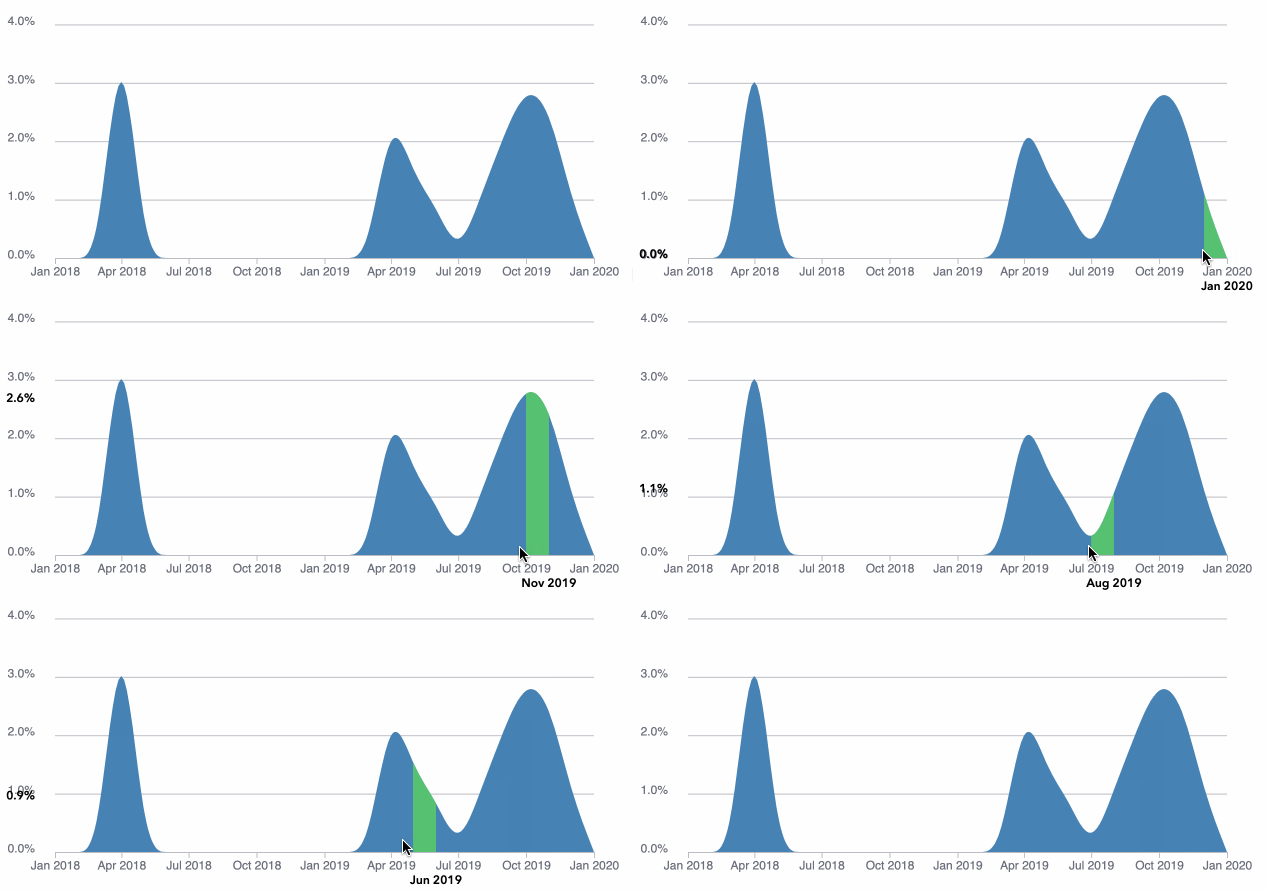
Although the team didn’t have the final approved data schema from the client we knew it was a tight timeframe so we wanted to get started on some rough data visualization sketches for the different sections. Given our rapid prototyping experience with d3.js and React, these sketches are all done with code and are in a more “polished” state.


Initial data visualization sketches in React & d3
Constituency Map
One of the center pieces of the entire application was a detailed map of the approximately 650 constituencies in the United Kingdom. This map ended up being one of the more complex pieces of the entire application.

Constituency map for the UK Political Atlas
Issue: Provided GeoJSON UK map file was 5MB.
Solution: We simplified and transformed the file to a TopoJSON file at a more reasonable 1MB using Mapshaper and then rendered the map in canvas for better drawing performance.
Issue: Mouse interactions on canvas.
Solution: While traditional mouse events — onMouseOut and onMouseOver — can be added to a DOM element with ease, canvas is a different animal altogether. What we needed to do was render an identical in-memory “invisible” copy on top of the visible canvas with the same feature paths as the visible canvas. The only difference between the two canvases is that each geographic feature of the virtual canvas is colored in a slightly different fill color.
As you can see in the image below, the bottom canvas is the choropleth map that the user sees, while the second in-memory “invisible” canvas contains a different color for each geographic feature. Finally, the top canvas is how we render the selected geographic feature on a user click.

Three different canvas elements for handling mouse events on UK map
This provided the team with an easy and efficient way to map the fill color of the feature to the feature itself.
import {rgb} from 'd3-color';// Get the color from the moused over feature
const imageData = virtualContext.getImageData(mouseX, mouseY, 1, 1);
const color = rgb.apply(null, imageData.data).toString();
const activeFeature = [
{color: 'rgb(0,1,0)', feature: {id: 1, name: 'Constituency 1'}},
{color: 'rgb(0,2,0)', feature: {id: 2, name: 'Constituency 2'}}
]
.find(d => d.color === color);Issue: Unfamiliarity with UK constituency map.
Solution: As we were testing the map ourselves and with the client, we got feedback that the tooltip over the constituency was not showing the correct name and information. Our unfamiliarity with the UK did not help with debugging the issue. We did find a single constituency that kept showing up incorrectly and zoomed in on it. What we found was that the getImageData() function was retrieving a color that had a transparency less than one attached to it, i.e. rgba(0, 2, 0, .75). This was caused by anti-aliasing around the border of each feature (as shown in the image below). We fixed that issue by only doing the feature lookup when the alpha parameter was 1.
// Ensure the alpha parameter is 255/255 = 1 before lookup
if (imageData.data[3] === 255) {
  const activeFeature = [
    {color: 'rgb(0,1,0)', feature: {id: 1, name: 'Constituency 1'}},
    {color: 'rgb(0,2,0)', feature: {id: 2, name: 'Constituency 2'}}
  ]
  .find(d => d.color === color);
}
Issue: Map rendering was not crisp.
Solution: We multiplied the width and the height by the window.devicePixelRatio to ensure high-resolution screens would accurately render the sharpness of the paths.
devicePixelRatio = window.devicePixelRatio || 1;this.virtualCanvasEl = select(document.createElement('canvas'))
.attr('width', this.width * this.devicePixelRatio)
.attr('height', this.height * this.devicePixelRatio)Constituency Details
One of the more impressive features of the application is the ability to dive deep into any constituency in the United Kingdom. A user is able to quickly understand the top issues within a constituency over time and compare the leader of the constituency share of voice against the share of voice for their party or region.

A detailed look at Berwick-upon-Tweed constituency
Issue: Allowing users to quickly find their MP or constituencies
Solution: Angular Material has a very flexible Autocomplete component, which allows users to filter down arbitrary lists of objects. We customized it to show a headshot of the MP, his/her name, and the constituency’s name.
Here’s is the template:
<mat-autocomplete #auto="matAutocomplete"
(optionSelected)="onSelected($event.option.value)"
                  [autoActiveFirstOption]="true"
                  [disableRipple]="true"
                  [displayWith]="displayWith"
                  [class]="'mp-autocomplete'">
  <mat-option *ngFor="let option of filteredOptions | async"
              [value]="option">
    <img [src]="option.mpImage"/>
    <div>
      <span>{{option.mp}}</span>
      <small>{{option.constituency}}</small>
    </div>
  </mat-option>
</mat-autocomplete>
We filtered the options by either MP name or constituency, then capped it at 25 results.
this.filteredOptions =
    this.mpControl.valueChanges
        .pipe(
            startWith(''),
            map(value => {
                if (typeof value === 'string') {
                    value = value.toLowerCase();
                }
// Max of 25 results
if (value === '') {
return this.options.slice(0, MAX_RESULTS);
} else {
return this.options.filter(option => {
const mpIncluded = option.mp.toLowerCase().includes(value);
const constituencyIncluded = option.constituency.toLowerCase().includes(value);
return mpIncluded || constituencyIncluded;
}).slice(0, MAX_RESULTS);
}
})
);Takeaways
As we worked on the project, we developed a few new project management best practices.
- Create a Github Action to deploy to a static AWS S3 development site on every merged pull request. This saved us time as we didn’t need to implement an entire CI/CD pipeline into our codebase.
[embed]Github Action for deploying the staging branch to a static S3 site
- Take a screenshot of any UI changes and add as an image to the pull request. This not only helps the reviewer understand the visual changes, but it also provides a great retrospective at the end for how much was accomplished.

A new GitHub pull request with a UI screenshot of the change
Future
Often, the development of an app is for a single purpose, which in this case was the December election. But the great thing about this application is that the data are constantly updated and it is a helpful tool on an ongoing basis for voters on the ground in the United Kingdom.
Christopher Lanoue is a Creative Technologist/Data Visualization Engineer who is currently a Sr. Principal Front-end Engineer at Mission Lane and the former Director of Engineering and Innovation at Graphicacy.
메타데이터
- post_id
- d2cb49efa9d5
- slug
- building-the-uk-political-atlas-d2cb49efa9d5
- url
- https://medium.com/@calanoue/building-the-uk-political-atlas-d2cb49efa9d5
- canonical_url
- https://medium.com/@calanoue/building-the-uk-political-atlas-d2cb49efa9d5
- author_url
- https://medium.com/@calanoue
- status
- ok
- fetched_at
- 2026-06-17 16:37:43