Nvidia Sharpe and Sortino ratios
In recent times
Nvidia Sharpe and Sortino ratios
In recent times
Photo by Meriç Dağlı on Unsplash
Let’s use our risk app MCarloRisk3D to look at risk adjusted returns of NVDA in recent times at different potential forecasted probabilities, since NVDA is all the rage.
We’ll just do an untuned / unbacktested model for simplicity’s sake to start. First order approximation, back of envelope.
A great thing about this type of analysis is that it doesn’t care what the company makes or what its “fundamentals” or “technical indicators” are, or whether or not we are in a bubble. It analyzes from daily returns only (not even prices).
Setting the top slider on the yellow graph so that the constant risk curve nicks the top of the actual blue price graph in the last 100 days, we notice the following, which occurred at the 65% risk level: From the top middle of the yellow graph, we can read that at the recent peak probability level, our theoretical return was about 26.5% in that 100 day period (wow!), but Sharpe was only 0.66. This was not the actual return in that period, mind. The actual return was lower, specifically after 100 trading days, but that is the jittery spot price analysis, so caution is in order.
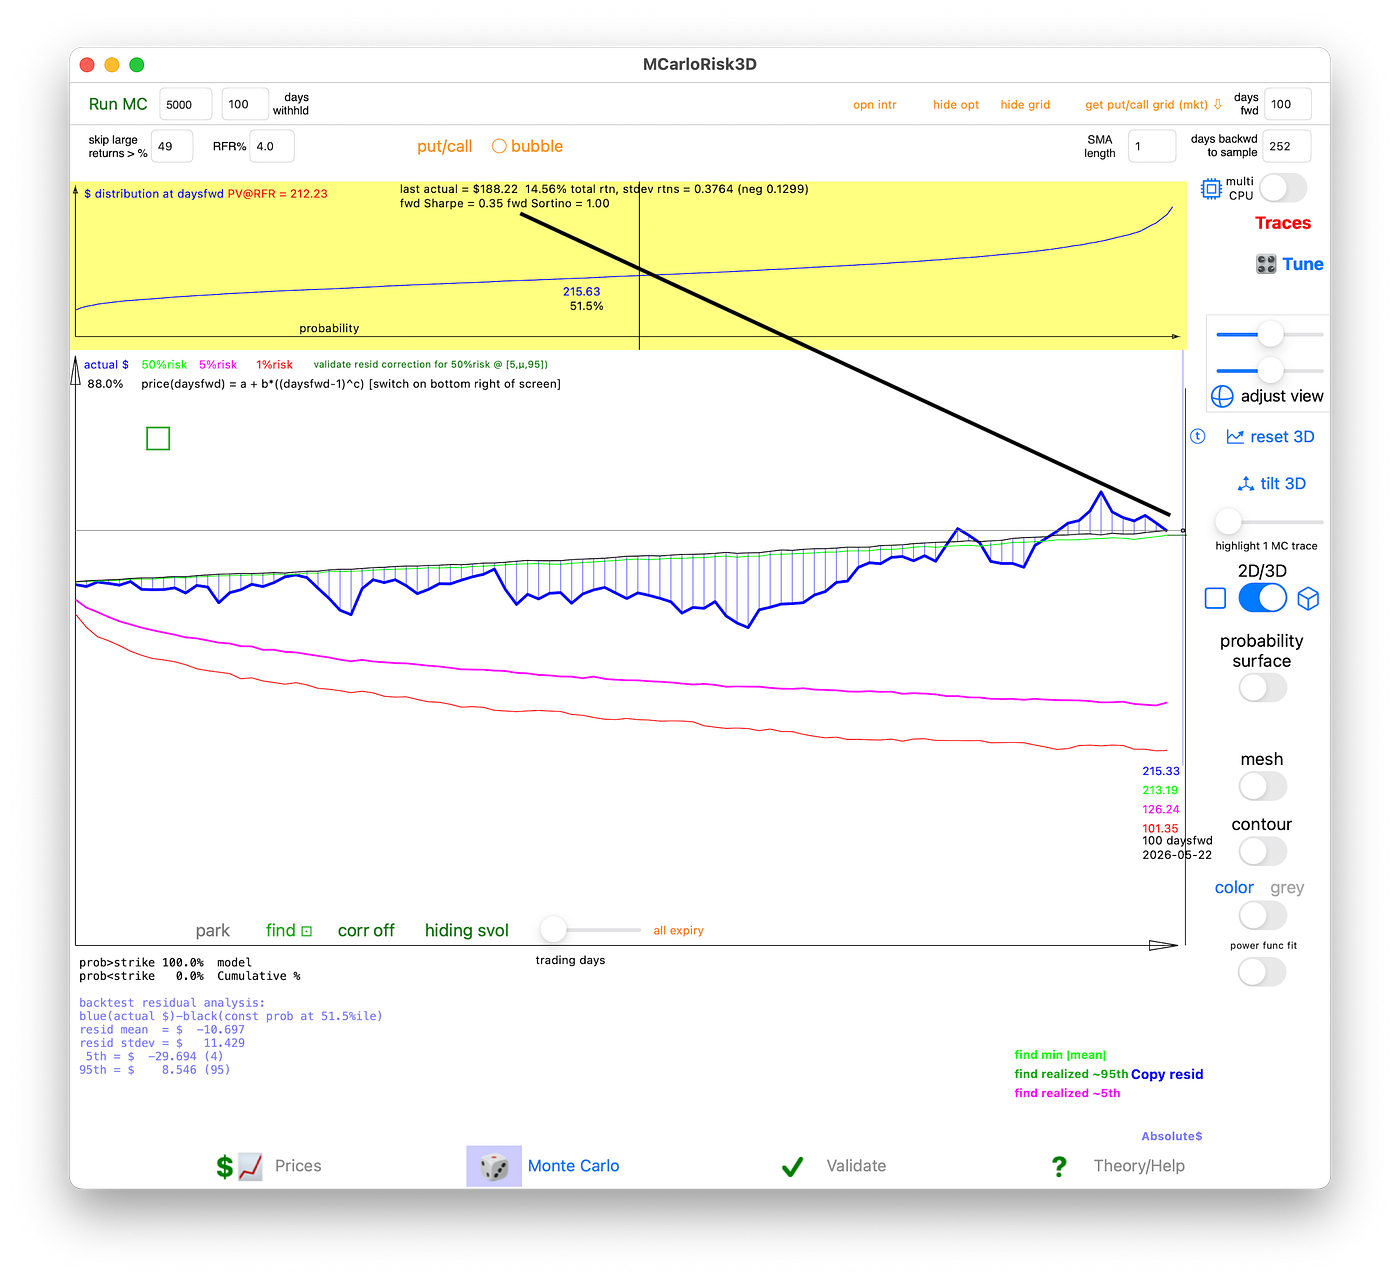
The less penalizing Sortino ratio was 1.92 which is pretty great, right? As a reminder, Sharpe penalizes for bullish volatility, Sortino does not. Why penalize for good things that happened? Because those good things could swing bad in high volatility eras, that’s why.

Side note about “momentum” analysis:

Which is the “real” momentum? 🤷
Now we set the risk curve at the 50/50 chance median: Total return about 12.3% in 100 days (also amazing and closer to the actual return; actual return was a bit higher) but Sharpe only 0.28 and Sortino 0.83. Not as good even on the Sortino side. The high volatility of NVDA overwhelms even its large returns.

Ok now let’s do the inner probability band, 25% to 75%. 50% chance to be between these. This is a backtest to show the recent reality, but a forward forecast would be similar if you want to try.

25%, -8% return, Sharpe -0.25, Sortino -0.74

75%, 39% return (!), Sharpe 0.99, Sortino 2.9 (!)
Now as a reference, let’s do SPY (S&P 500 ETF) 25% to 75% probability (50 / 50 chance for SPY to be between these):

SPY 25%, return -2.8%, Sharpe -0.33, Sortino -0.77

SPY 75%, 14.7% return, Sharpe 0.99, Sortino 2.34
Note that SPY at 75% has the same Sharpe ratio (risk adjusted return) that NVDA did at that percentage. Lower Sortino but still impressive at 2.3.
SPY at nominal 50%:

SPY 50%, 5.4% return, Sharpe 0.29, Sortino 0.69
Let’s compare (at the nominal 50% setting) between the two:
asset  return  Sharpe  Sortino
NVDA   12.0%    0.28    0.83
SPY     5.4%    0.29    0.69
SPXL    9.4%    0.19    0.56 (see below)
Risk adjusted, NVDA shows better Sortino, but Sharpe is about the same. Return of course much better for NVDA.
Now let’s try a 3x SPY ETF, SPXL at nominal:

SPXL at 50%, 9.4% return, Sharpe 0.19, Sortino 0.56
Even at 3x SPY leverage, NVDA has looked better than SPY in the recent time period from all 3 metrics. However, the 3x leveraged SPY case has the diversification inherent in its full market nature.
메타데이터
- post_id
- d2cd5d5671fe
- slug
- nvidia-sharpe-and-sortino-ratios-d2cd5d5671fe
- url
- https://medium.com/@nttp/nvidia-sharpe-and-sortino-ratios-d2cd5d5671fe
- canonical_url
- https://medium.com/@nttp/nvidia-sharpe-and-sortino-ratios-d2cd5d5671fe
- author_url
- https://medium.com/@nttp
- status
- ok
- fetched_at
- 2026-06-17 17:30:55



