CmTm Project: Prototype Measurements and DSP Tuning
I found some stock Peerless SLS-85S25CP-04–04 woofers last month and decided to use them for a new project. These 3.5’’ woofers feature a…
CmTm Project: Prototype Measurements and DSP Tuning
I found some stock Peerless SLS-85S25CP-04–04 woofers last month and decided to use them for a new project. These 3.5’’ woofers feature a large excursion relative to their size and are designed to extend bass response as much as possible within a small cavity. Because alternative solutions, such as bass-reflex and passive radiator designs, are unsuitable for these woofers, I decided to use a small closed-box enclosure and apply an EQ, such as a Linkwitz Transform, to boost the bass extension.
I decided on an MTM configuration paired with a Tectonic TEBM35C10–4 tweeter. I crossed them over using a steep 8th-order filter at a relatively low frequency, allowing the BMR to handle the wide off-axis dispersion. Because the project requires an active crossover, the Tinysine TSA7802A was selected. This board is excellent, delivering 50W x 2 with very low idle noise. If you want to set up a Bluetooth TWS configuration between the left and right channels, this is essentially the only choice (though I have heard that Sure Electronics will soon announce new products with the same functionality). The only weakness of the Tinysine board is that the taps of the ADAU1701 chip are limited, meaning I cannot use as many FIR filters as I want.
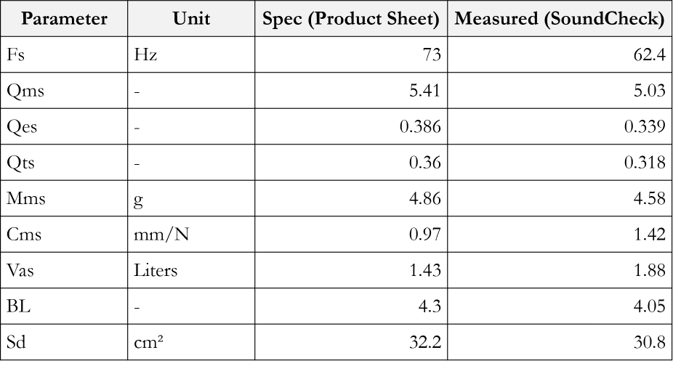
For the woofer driver evaluation and measurement, the T/S parameters of the SLS-85S25CP-04–04 were measured by SoundCheck using the added mass method in free-air. The results are compared with the official specified T/S parameters in the table below.
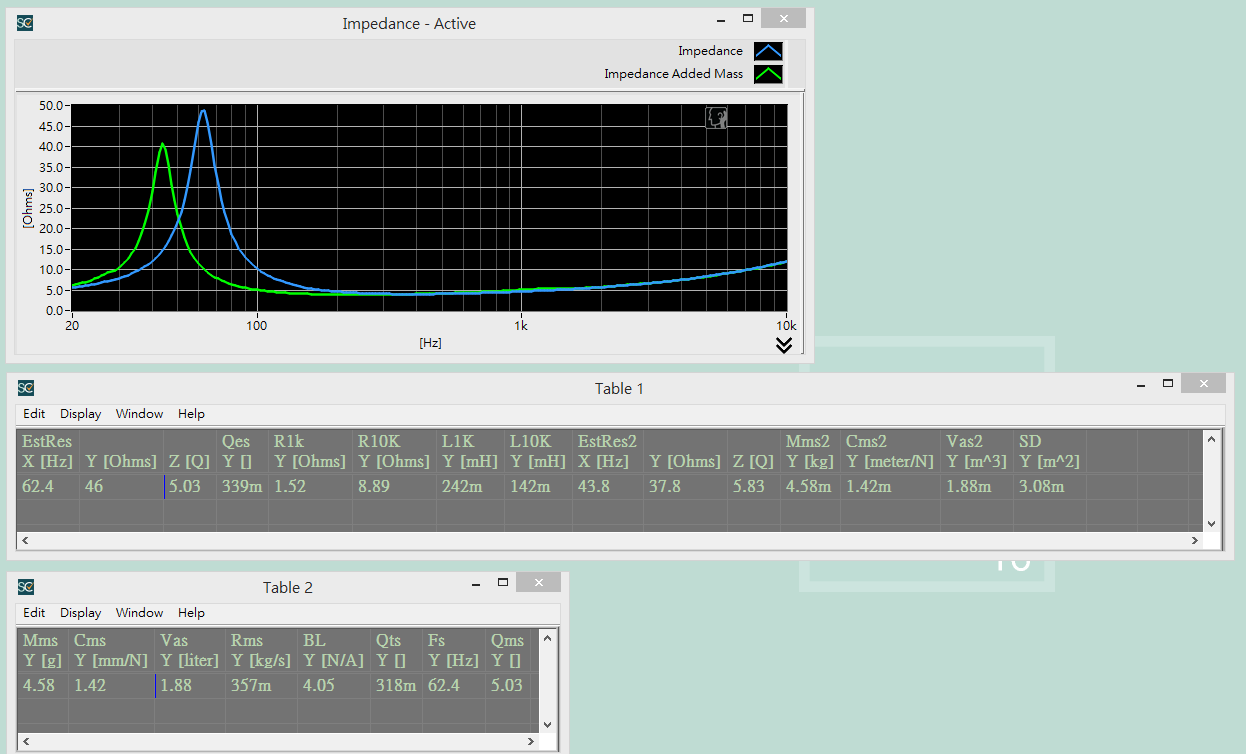
As shown in the data table, the measured fs is approximately 10 Hz lower than the spec value.
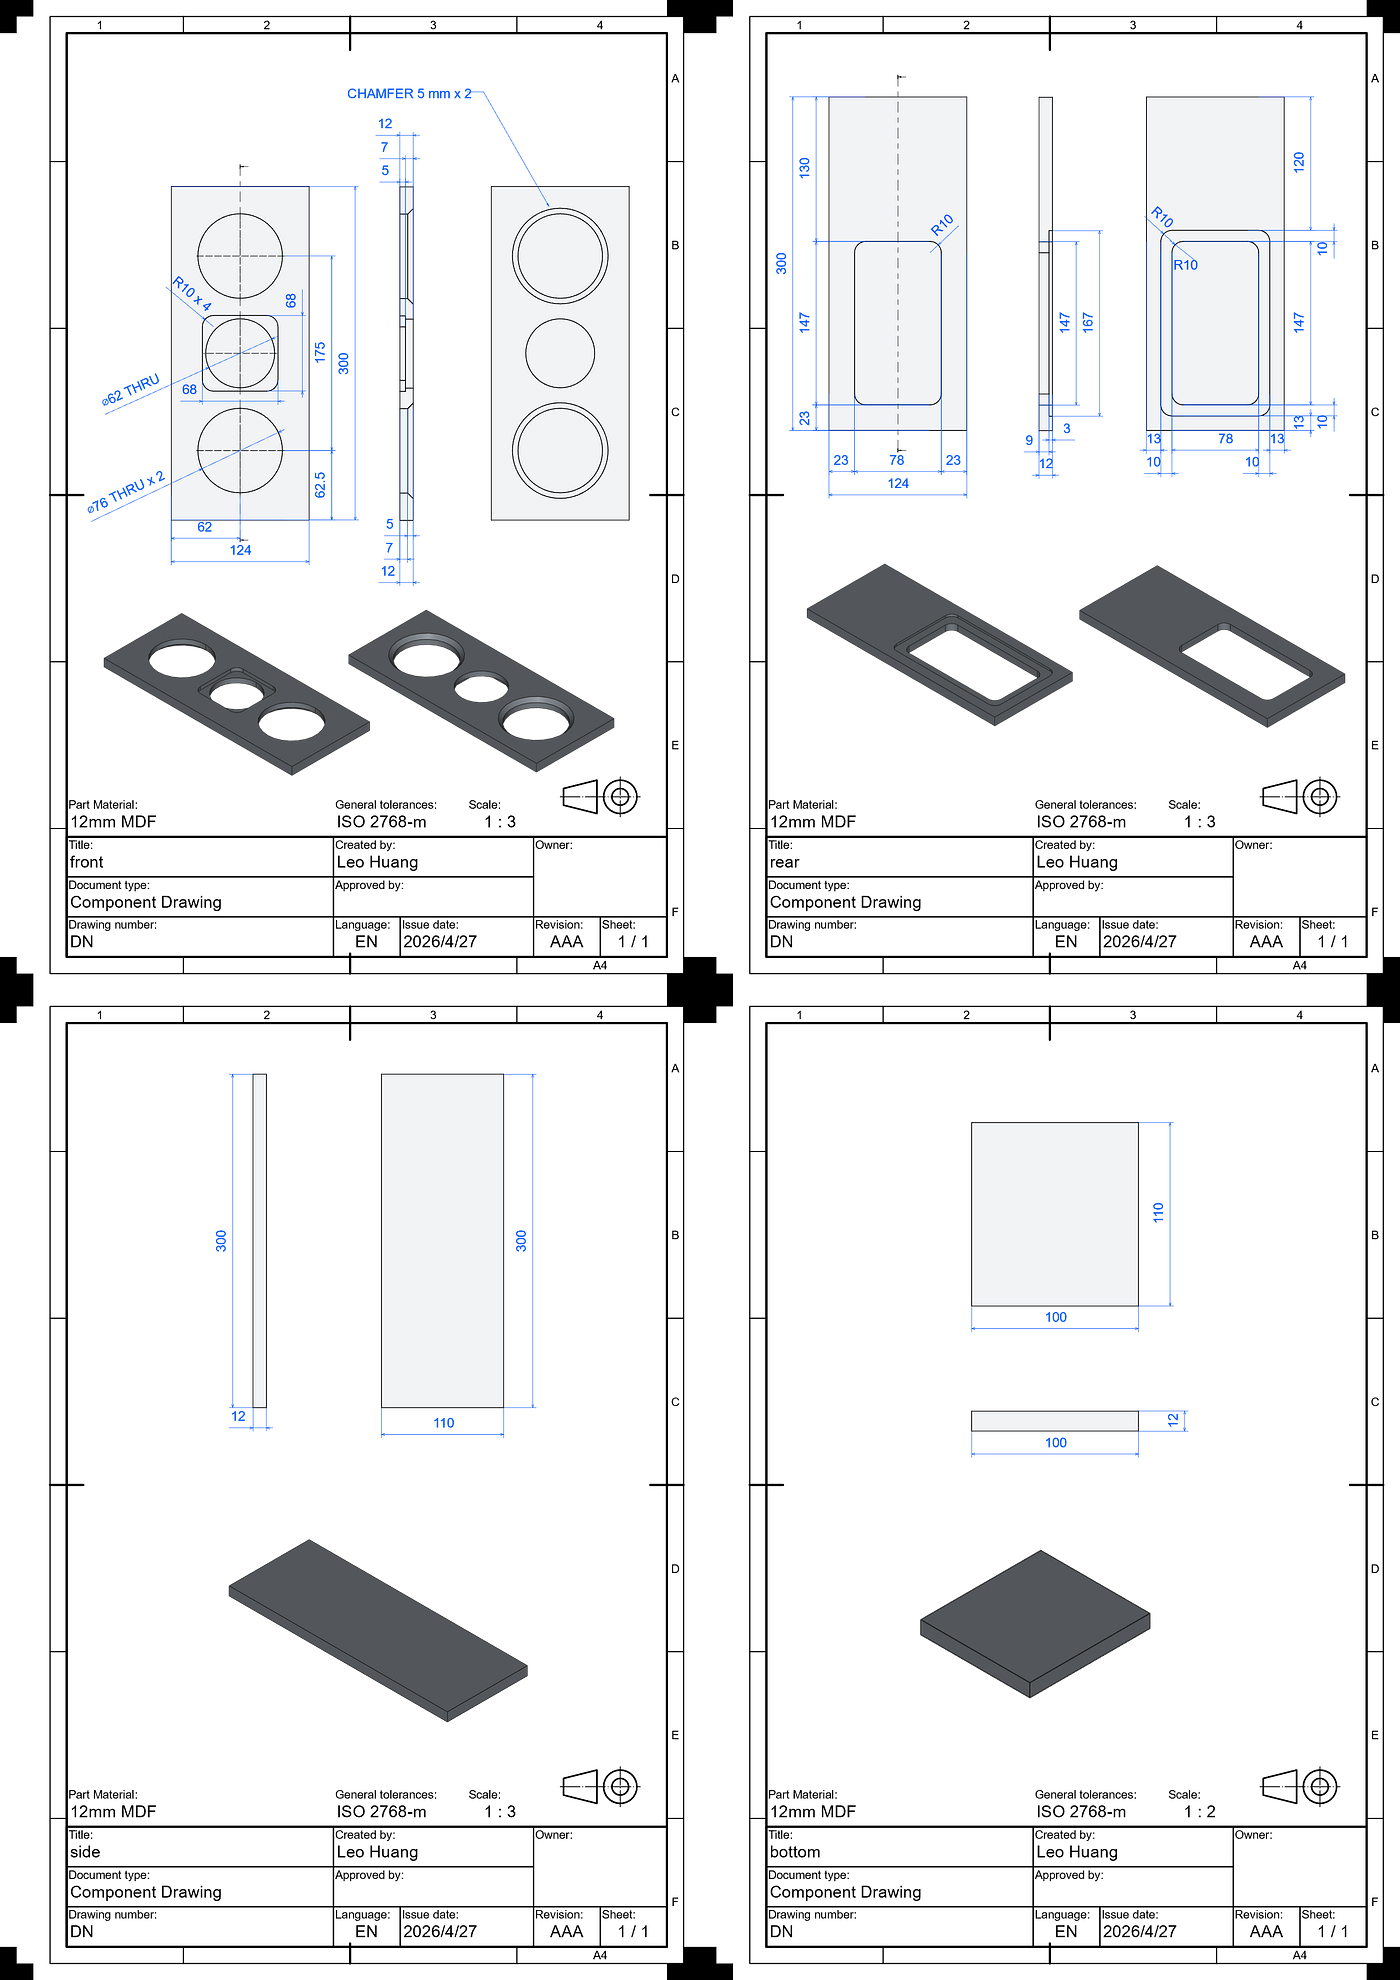
To conduct the initial evaluation of the enclosure, a prototype 2-liter MDF cabinet was constructed.
Free-field measurements were then taken to analyze the raw, unequalized response of the drivers in the enclosure. The measurement microphone was placed on-axis at a distance of 15 cm using SoundCheck. Note that the acoustic cut-off frequency of the anechoic chamber is approximately 450 Hz.

For the setup, the two woofers were wired in series within the main 2-liter volume, while the BMR tweeter was isolated inside its own 200 cc rear chamber. Some polyester sheets were used in both cavities for internal damping.
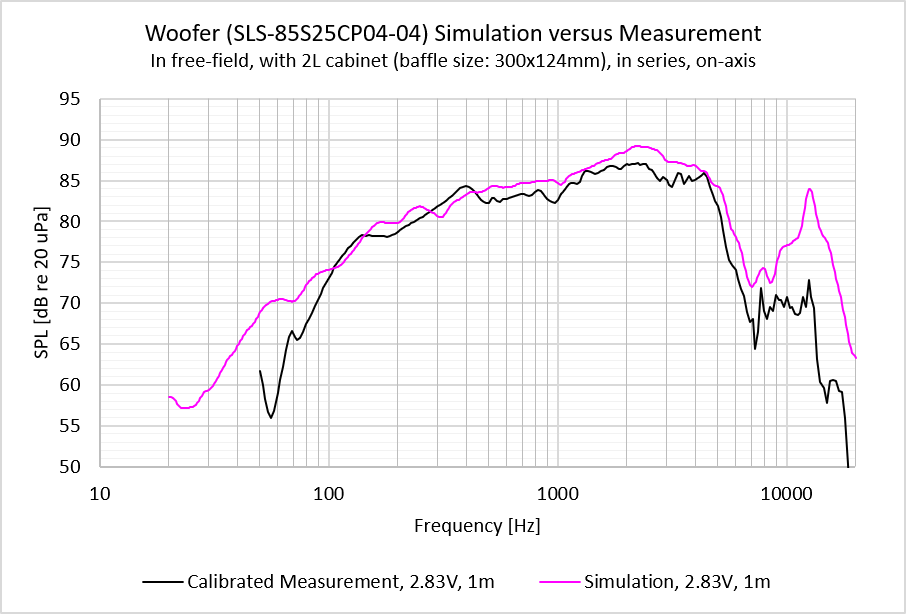
Initial acoustic analysis began by comparing the measured woofer response against the VituixCAD simulation. The simulation utilized the official datasheet SPL data combined with the simulated diffraction effects of the physical cabinet baffle. The actual measurement aligned closely with the simulated prediction. Notably, the severe high-frequency cone breakup modes typical of this driver size were significantly lower in real life, which is a positive finding.
Next, the IMP curve. Since the two woofers are wired in series, the overall impedance is double that of a single driver. The measured peak impedance at the enclosure resonance frequency fb is approximately 70 ohms, with fb at 92 Hz.

When comparing these results to the VituixCAD simulation based on the measured T/S parameters, the calculated enclosure Ql was approximately 13 to 15. This value will need to be refined in the later enclosure build to minimize air leaks. Additionally, it was noted that the simulated fb was higher than the actual measured value.

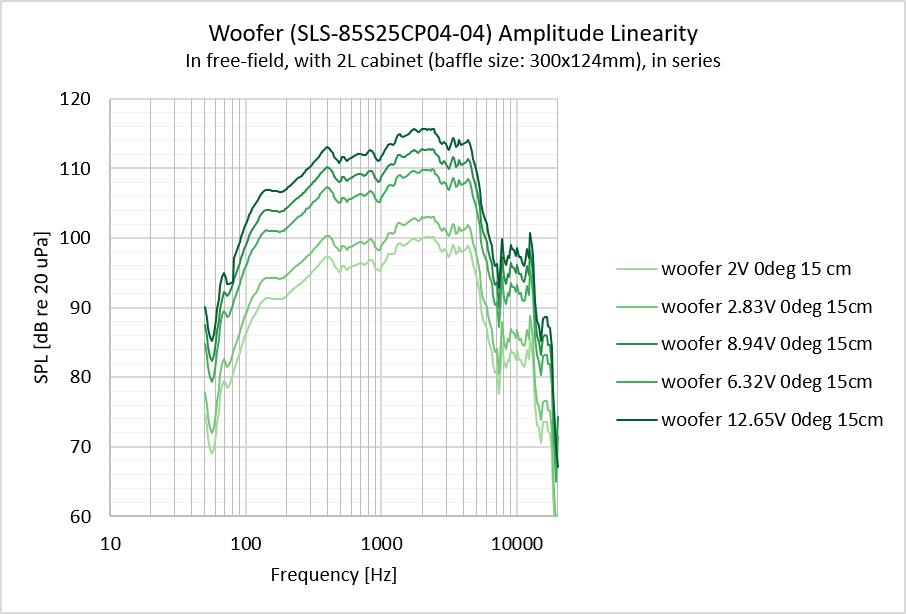
Amplitude linearity was then evaluated by measuring the woofers under various input power levels. The SPL compression observed below 100 Hz was little, which is advantageous for applying EQ to boost low-end extension.
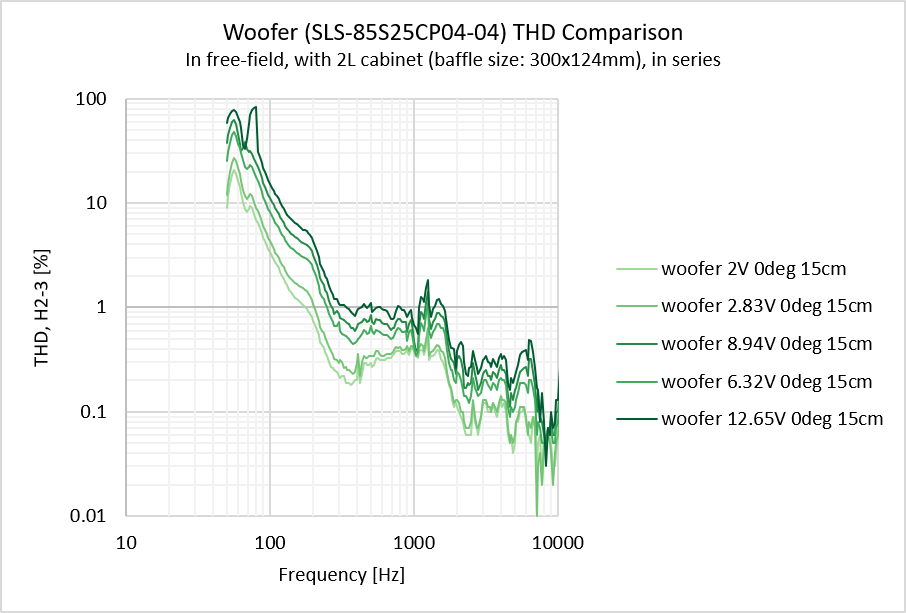
The THD varied significantly below 300 Hz depending on the input power. Because THD in a closed-box scenario is primarily dominated by the driver’s own mechanical limits, distortion below fb is inherently higher compared to bass-reflex or passive radiator designs.
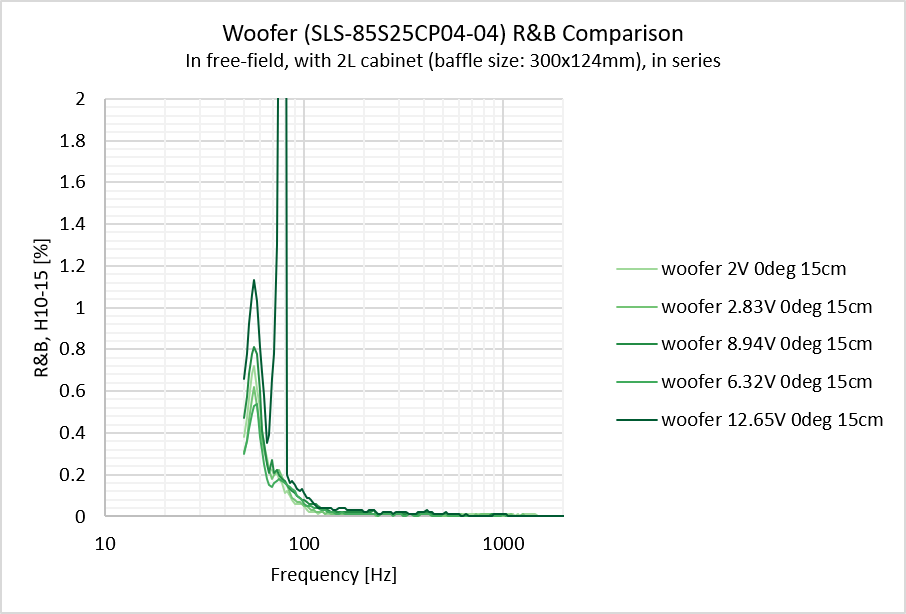
The Rub & Buzz measurements performed very well overall. However, a significant peak was observed around 80 Hz. This anomaly could be due to a measurement error or an abnormal resonance, although no physical rattling was detected during subjective listening.
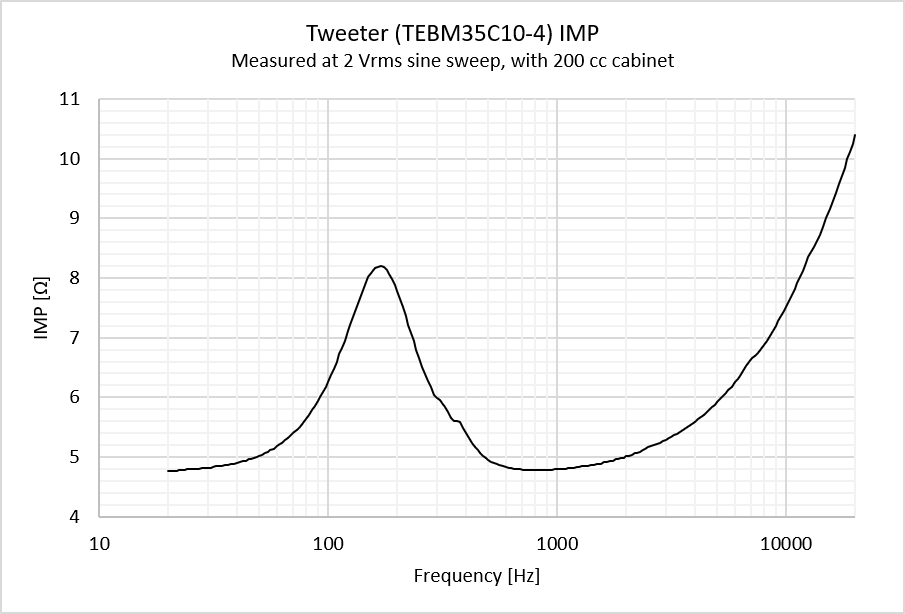
Shifting focus to the TEBM35C10–4 BMR tweeter, the IMP revealed some minor resonance between 300 Hz and 400 Hz. Overall, there are no major issues. Because the driver exhibits a notably high inductance effect, a Zobel network will be added in later stages to flatten the rising.
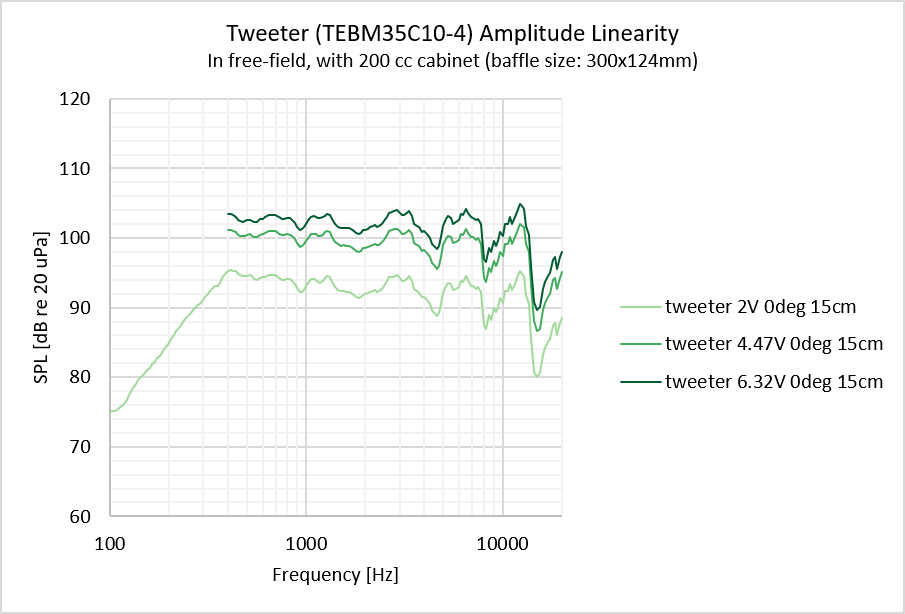
A significant drawback of the TEBM35C10–4 (which is a common issue among BMR drivers) is its low sensitivity, which complicates level-matching when paired with conventional drivers. Furthermore, this compact driver begins to exhibit dynamic compression at an input level of 6.32V, indicating that it cannot produce very high SPL.
Another issue observed during testing is the presence of anomalous peaks and dips in the HF region. While independent measurements of this specific driver from Erin’s Audio Corner do not exhibit these deviations, it is highly likely that this is an artifact of the current measurement environment or the equipment. Interestingly, I noticed a similar HF tendency above 14 kHz during my previous CCMS build. To properly investigate and isolate the root cause of this issue, I plan to switch measurement microphones and conduct further testing with the driver mounted directly on the enclosure baffle.
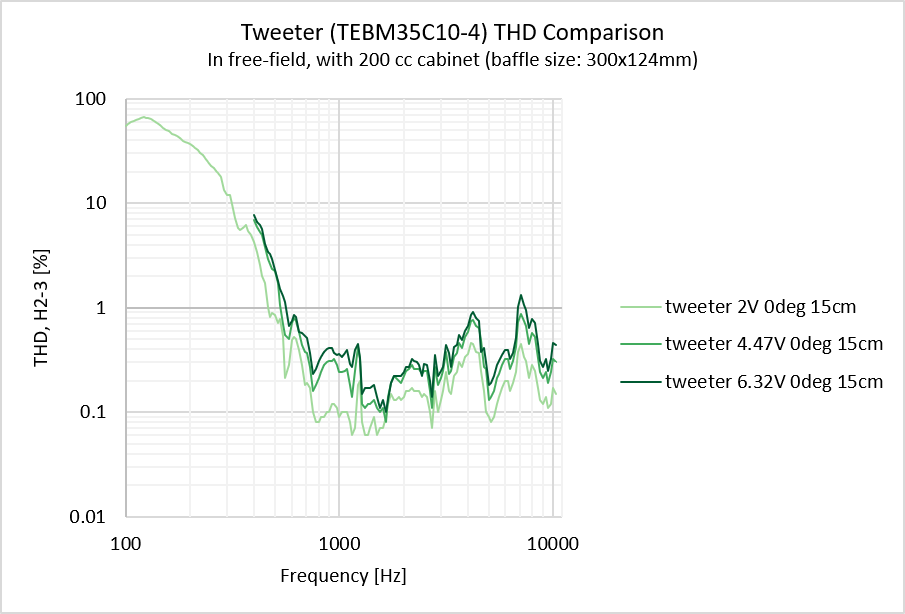
THD exhibits a slight rise around 4.5 kHz and 7 kHz. This is primarily due to a notch in the FR, as THD is calculated as a relative ratio between the harmonic content and the fundamental signal. Overall, the nonlinear distortion performance remains quite good above 1 kHz. However, given the rising THD observed below 600 Hz, it is advisable to avoid setting the crossover point for this BMR too low while it is operating within the 200 cc rear cavity.
R&B had no major issues, aside from a slight bump between 350 Hz and 500 Hz. This anomaly correlates with the abnormal resonance in the IMP curve. Further investigation is required to determine whether the root cause is inherent to the driver itself or an artifact of enclosure resonance, noting that the rear cavity is currently a 3D-printed PLA prototype.

To evaluate the overall sensitivity of the configuration, the woofers (wired in series) and the tweeter were both measured using a 2V sweep.

Here is the primary structure of the crossover and equalizer. All DSP processing was implemented on the onboard ADAU1701 using SigmaStudio. The input signal was routed to a single channel, passing through a signal chain that consists of a DC blocker, a master gain block, double-precision parametric EQ, and the XO. To limit woofer excursion, a 4th-order Butterworth HPF was temporarily set at 55 Hz.
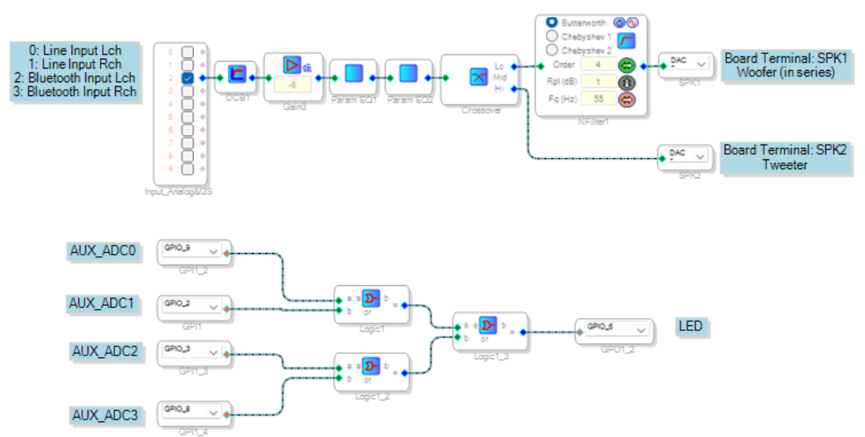
Based on the previous distortion measurements, the XO point was set at 530 Hz to avoid the rising THD observed in the LF of the BMR driver. The XO utilizes a steep 8th-order Linkwitz-Riley filter.

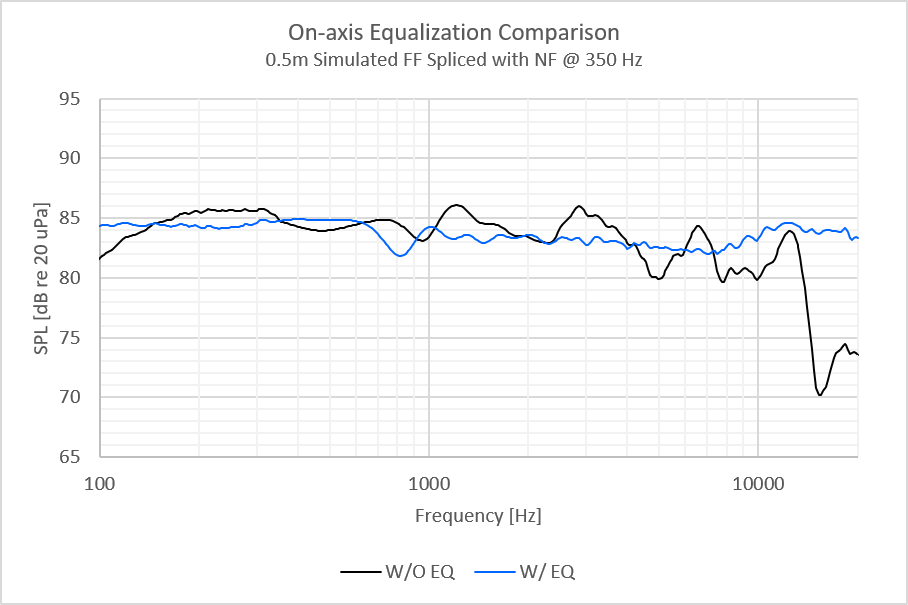
Parametric EQ was then applied to flatten the overall on-axis FR. Notably, compensating for the HF notch around 15 kHz required a significant +14 dB boost. Because HF content in typical music playback rarely reaches large amplitudes, this aggressive boost should not cause clipping during normal use. However, it does induce clipping when tested with a sine sweep.
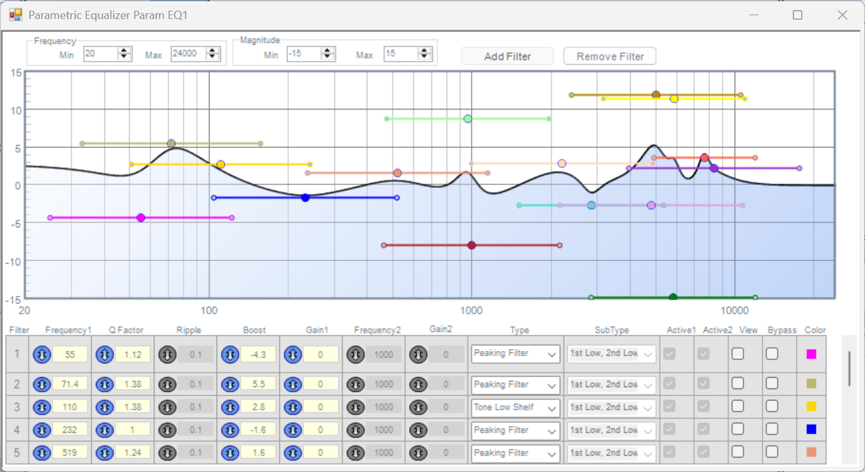

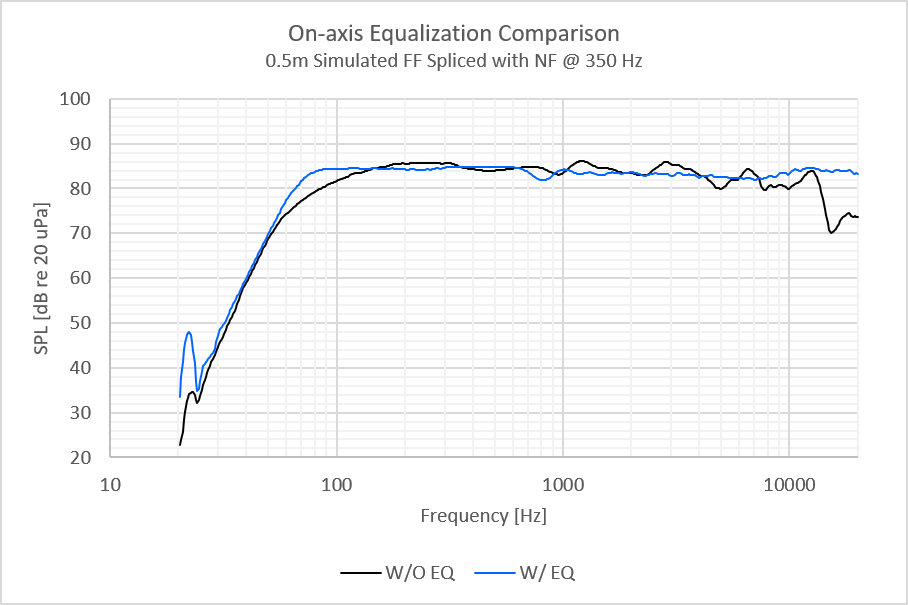
For the EQ tuning, a longer measurement distance was adopted. A time-selective method was utilized to measure the far-field response at 0.5 meters, which was then merged with the near-field woofer measurement to obtain the complete full-band FR. Both the data acquisition and post-processing were conducted using REW.

The effects of the PEQ were then compared against the raw FR. After EQ, the LF -3 dB point reached approximately 60 Hz. Additionally, the HF notch was flattened using the massive gain boost discussed previously.
Because the XO point is set at a relatively low 530 Hz — a region where the woofers are essentially omnidirectional — the overall directivity pattern is predominantly dictated by the BMR tweeter. It should be noted that the SPK was placed on a table during these tests, meaning boundary reflections from the desktop surface likely influenced the measurements.
Regarding the horizontal off-axis performance, the TEBM35C10–4 did not behave as smoothly as anticipated. In the normalized polar map, where the contour gradient is set to 1 dB per step, a distinct narrowing in directivity is visible between 800 Hz and 2 kHz. Overall, the off-axis response of the BMR is less uniform than expected.
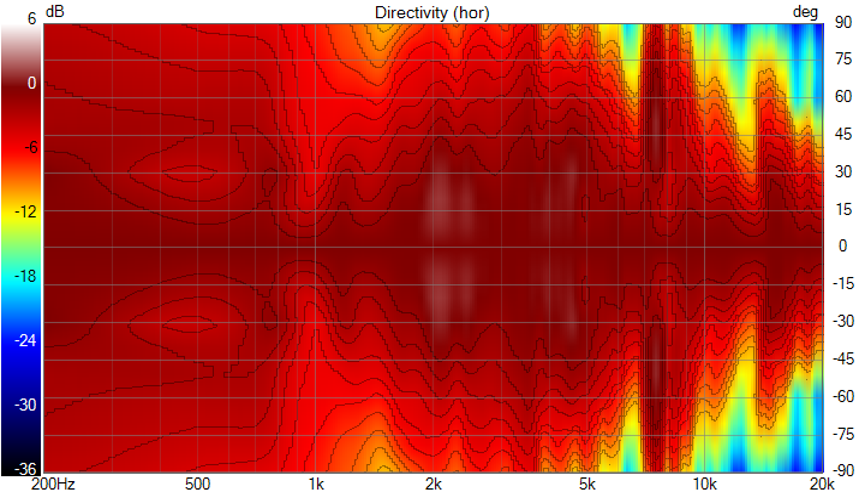
From the line chart and waterfall plot, there are two severe directivity narrowings at approximately 7.5 kHz and 14 kHz.
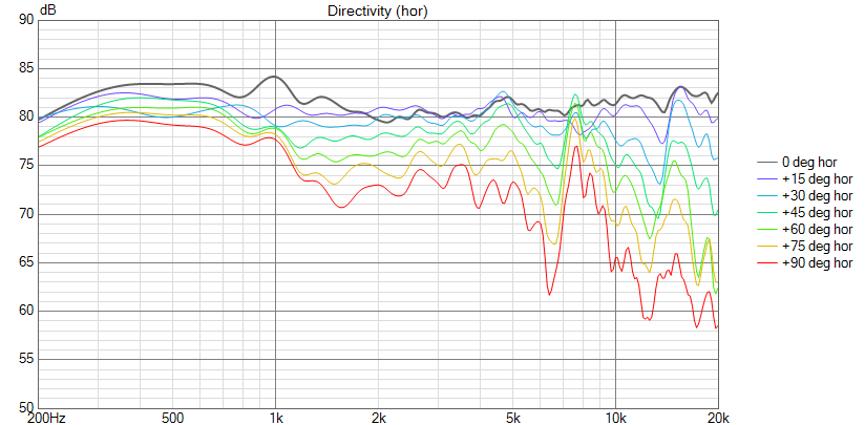
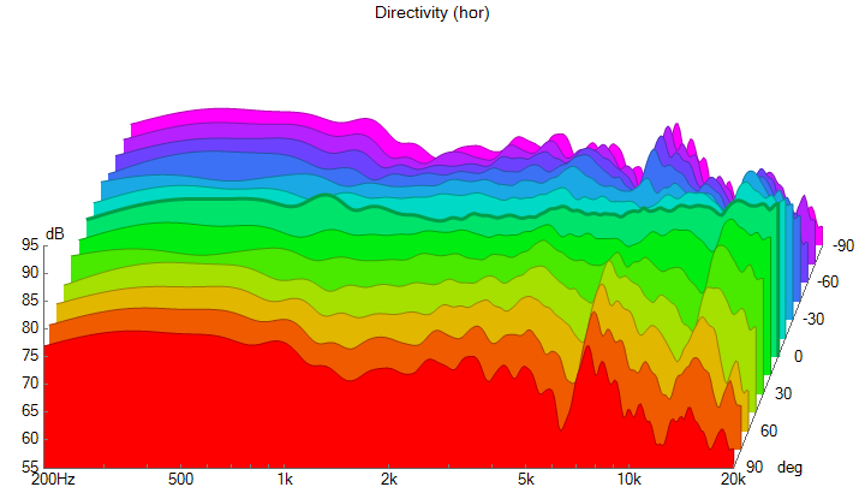
The vertical off-axis FR is quite similar to the horizontal. Thanks to the low crossover point, the vertical lobing issues and narrow directivity typically associated with a conventional D’Appolito configuration were largely mitigated. However, some narrowing is still observable around 3 kHz.
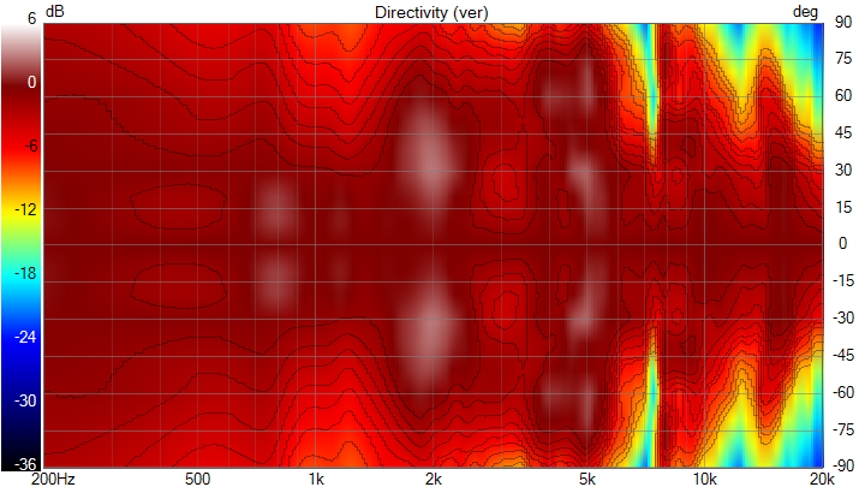
As illustrated by the line chart and waterfall plot, the severe directivity narrowing observed at 7.5 kHz and 14 kHz are also present in the vertical plane.


Based on this initial evaluation and measurement phase, the following action items have been established for the next iteration:
- Cabinet Air Leakage Refinement: Tighter tolerances must be achieved in the next enclosure build to strictly minimize air leaks.
- Tweeter Inductance Compensation: Implement a physical Zobel network to counteract the rising HF impedance.
- Tweeter Clipping Analysis: Verify whether the amplifier or tweeter experiences clipping during actual playback at maximum volume.
- Tweeter 14 kHz Notch Investigation: Determine whether the 14 kHz notch is an artifact of the test equipment and environment or an inherent driver characteristic.
- Tweeter R&B Verification: Monitor for any structural R&B resonances in the finalized cabinet build.
- Off-Axis Directivity Improvement: Apply fillets to the baffle edges on the next enclosure to smooth out acoustic diffraction.
Initial subjective listening impressions are generally positive. However, the bass response feels somewhat shy, while the mid-to-high frequencies are slightly too bright. To address this balance, a downward shelving filter can be applied to attenuate the HF and naturally bring the bass forward. Stay tuned for further updates : )
메타데이터
- post_id
- d2d02c79db6d
- slug
- cmtm-project-prototype-measurements-and-dsp-tuning-d2d02c79db6d
- url
- https://medium.com/@leohuang-acoustics/cmtm-project-prototype-measurements-and-dsp-tuning-d2d02c79db6d
- canonical_url
- https://medium.com/@leohuang-acoustics/cmtm-project-prototype-measurements-and-dsp-tuning-d2d02c79db6d
- author_url
- https://medium.com/@leohuang-acoustics
- status
- ok
- fetched_at
- 2026-06-17 08:20:12