The Smart Trader’s Blueprint: Essential Technical Analysis Checks Before You Risk Capital
Introduction
The Smart Trader’s Blueprint: Essential Technical Analysis Checks Before You Risk Capital
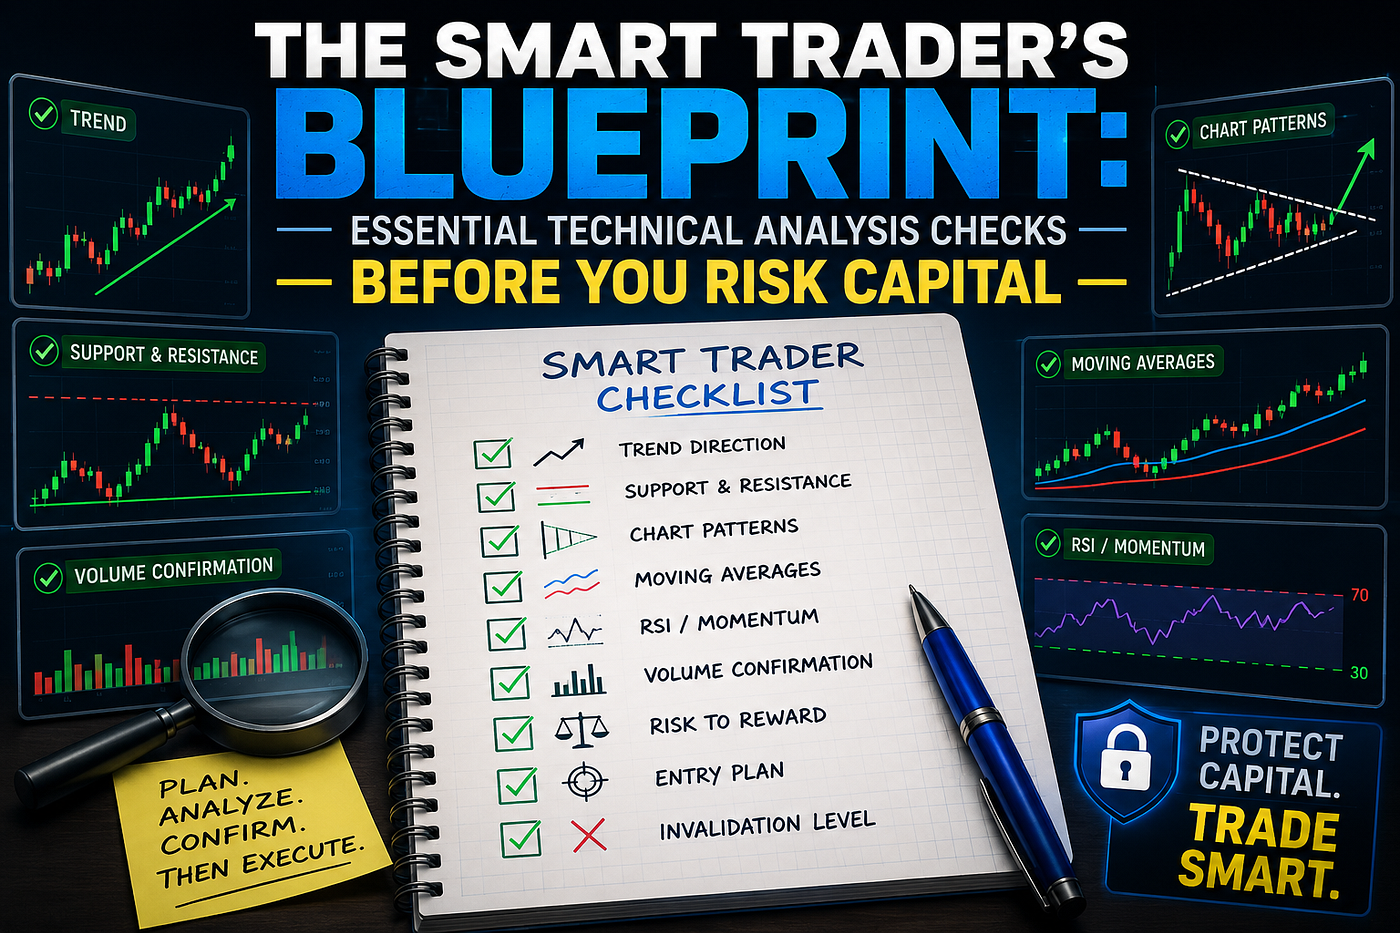
Technical Analysis Checklist Before Entering Any Trade
Introduction
One of the biggest reasons traders lose money in financial markets is not a lack of opportunity but a lack of preparation. Many traders enter positions based on emotions, social media tips, news headlines, or fear of missing out. While markets occasionally reward impulsive decisions, long-term success usually belongs to traders who follow a structured process before entering a trade.
Professional traders rarely place orders without performing a detailed analysis. They use a technical analysis checklist to evaluate market conditions, identify potential risks, and confirm whether a trading opportunity aligns with their strategy. This disciplined approach helps eliminate emotional decision-making and improves consistency over time.
A technical analysis checklist acts as a quality-control system. Just as pilots perform pre-flight checks before takeoff and surgeons follow procedures before an operation, traders should verify critical technical factors before risking capital. The goal is not to predict the future with certainty but to increase the probability of making informed decisions.
Technical analysis provides traders with a framework for evaluating trends, momentum, support and resistance levels, chart patterns, volume behavior, volatility, and overall market structure. When multiple factors align, the probability of a successful trade often improves.
This comprehensive guide explains the essential technical analysis checklist every trader should review before entering a trade. Whether you trade stocks, forex, commodities, indices, or cryptocurrencies, these principles can help improve discipline, reduce avoidable mistakes, and strengthen trading performance.
Why a Technical Analysis Checklist Matters
Many traders focus exclusively on finding entry signals.
However, successful trading involves much more than identifying a potential setup.
A checklist helps traders:
- Maintain consistency
- Reduce emotional decisions
- Improve trade quality
- Manage risk effectively
- Avoid impulsive entries
- Increase confidence
- Follow a structured process
The best traders think in probabilities.
A checklist helps ensure that decisions are based on objective analysis rather than emotion.
Understanding Market Context First
Before analyzing any individual security, evaluate the broader market environment.
Markets rarely move in isolation.
Individual stocks often follow the direction of major indices.
Cryptocurrencies frequently react to broader digital asset sentiment.
Forex pairs respond to economic and geopolitical developments.
Ask these questions:
- Is the overall market trending higher?
- Is the market trending lower?
- Is volatility increasing?
- Are investors displaying risk appetite?
Understanding context helps traders align positions with prevailing conditions.
Check the Primary Trend
Trend identification is one of the most important components of technical analysis.
Many successful traders follow the principle:
“The trend is your friend.”
Determine whether the market is:
- In an uptrend
- In a downtrend
- Trading sideways
Uptrends typically produce:
- Higher highs
- Higher lows
Downtrends generally produce:
- Lower highs
- Lower lows
Trading in the direction of the dominant trend often improves probabilities.
Analyze Multiple Time Frames
A common mistake among beginners is relying on a single chart timeframe.
Professional traders often analyze multiple time frames before entering a trade.
For example:
- Long-term charts reveal broader trends.
- Intermediate charts show market structure.
- Short-term charts provide entry timing.
Multi-timeframe analysis creates a more complete understanding of market conditions.
It also helps identify conflicting signals.
Identify Key Support and Resistance Levels
Support and resistance remain among the most important concepts in technical analysis.
Support represents areas where buyers may become active.
Resistance identifies levels where sellers often emerge.
Before entering a trade, determine:
- Nearby support levels
- Nearby resistance zones
- Historical turning points
- Psychological price levels
These areas frequently influence future market behavior.
Entering directly beneath resistance or above weak support may increase risk.
Evaluate Volume Activity
Volume reveals the level of market participation.
Strong volume often validates price movement.
Weak volume may indicate a lack of conviction.
Before entering a trade, examine:
- Average daily volume
- Recent volume spikes
- Volume trends
- Breakout volume confirmation
A breakout supported by strong volume generally carries greater credibility than one occurring on low volume.
Volume helps separate meaningful moves from temporary fluctuations.
Confirm Trend Strength with Moving Averages
Moving averages help traders evaluate trend direction and momentum.
Popular moving averages include:
- 20-day moving average
- 50-day moving average
- 100-day moving average
- 200-day moving average
Questions to consider:
- Is price above key moving averages?
- Are moving averages rising or falling?
- Do moving averages support the trend direction?
Moving averages provide valuable confirmation.
They help traders avoid entering against dominant market momentum.
Review Momentum Indicators
Momentum indicators measure the strength behind price movements.
Popular tools include:
- Relative Strength Index (RSI)
- MACD
- Stochastic Oscillator
Momentum analysis helps answer important questions:
- Is momentum strengthening?
- Is momentum weakening?
- Is the market overbought?
- Is the market oversold?
Momentum confirmation often improves trade quality.
However, indicators should complement price analysis rather than replace it.
Look for Chart Pattern Confirmation
Chart patterns frequently provide valuable clues regarding future price movement.
Common bullish patterns include:
- Cup and Handle
- Ascending Triangle
- Bull Flag
- Double Bottom
Common bearish patterns include:
- Head and Shoulders
- Descending Triangle
- Bear Flag
- Double Top
Before entering a trade, determine whether a recognizable pattern supports your thesis.
Patterns often improve trade structure and clarity.
Assess Volatility Conditions
Volatility influences risk and opportunity.
High volatility can create larger price swings.
Low volatility often precedes significant market moves.
Evaluate:
- Recent price fluctuations
- Average trading range
- Volatility trends
Understanding volatility helps determine position size and stop-loss placement.
Ignoring volatility can lead to unnecessary risk exposure.
Check Relative Strength
Strong assets often continue outperforming weak assets.
Relative strength analysis compares a security’s performance against a benchmark.
Questions to ask:
- Is the asset outperforming the broader market?
- Is institutional interest increasing?
- Is the trend stronger than comparable securities?
Relative strength frequently identifies market leaders.
Many successful traders prioritize the strongest opportunities.
Verify Risk-to-Reward Ratio
Every trade should offer favorable potential relative to risk.
Before entering a position, calculate:
- Entry point
- Stop-loss location
- Profit target
Many professional traders seek minimum risk-to-reward ratios of:
- 1:2
- 1:3
- Higher
Favorable risk-to-reward profiles help maintain profitability even when some trades fail.
Define a Stop-Loss Strategy
One of the most important checklist items involves risk management.
Every trade should have a predefined exit plan.
Consider:
- Technical stop-loss levels
- Volatility-based stops
- Support and resistance zones
The stop-loss should be logical rather than arbitrary.
Proper stop placement protects capital while allowing trades sufficient room to develop.
Determine Position Size
Position sizing is often overlooked.
Even excellent trade setups can become dangerous if position size is excessive.
Before entering a trade, determine:
- Maximum acceptable loss
- Percentage of capital at risk
- Position size relative to account value
Professional traders focus on preserving capital first.
Position sizing plays a major role in long-term success.
Check Upcoming News and Events
Technical analysis does not operate in isolation.
Major news events can influence market behavior dramatically.
Review:
- Earnings announcements
- Economic reports
- Central bank decisions
- Industry developments
Unexpected events can invalidate technical setups.
Understanding upcoming catalysts helps traders manage risk more effectively.
Evaluate Market Sentiment
Sentiment often drives short-term price movements.
Excessive optimism or pessimism can influence outcomes.
Consider:
- Investor sentiment
- Market positioning
- Fear and greed indicators
Sentiment analysis provides additional context.
Combining sentiment with technical analysis creates a more balanced perspective.
Create a Written Trading Plan
Before entering any trade, document your reasoning.
Include:
- Entry criteria
- Stop-loss location
- Profit target
- Trade rationale
- Risk assessment
Writing down your plan improves discipline and accountability.
Professional traders often maintain detailed trading journals.
Avoid Emotional Decision-Making
Emotions remain one of the biggest threats to trading success.
Before placing a trade, ask:
- Am I following my strategy?
- Am I reacting emotionally?
- Am I chasing price?
- Am I experiencing fear of missing out?
Emotional awareness helps prevent costly mistakes.
Discipline often separates successful traders from unsuccessful ones.
Technology and Modern Technical Analysis
Today’s traders have access to advanced tools that simplify analysis.
Artificial intelligence and machine learning can:
- Identify chart patterns
- Scan thousands of securities
- Monitor momentum shifts
- Detect unusual volume activity
Modern platforms increase efficiency.
However, technology should support sound decision-making rather than replace it.
Human judgment remains essential.
Building Consistency Through Process
The greatest benefit of a technical analysis checklist is consistency.
Markets change constantly.
A structured process helps traders remain objective.
Over time, consistency produces valuable data.
Traders can review results, refine strategies, and improve performance.
The goal is not perfection.
The goal is disciplined execution over hundreds of trades.
Conclusion
A technical analysis checklist is one of the most powerful tools a trader can develop. By systematically reviewing trend direction, market context, support and resistance levels, volume activity, momentum indicators, chart patterns, volatility conditions, risk-to-reward ratios, and position sizing before entering a trade, traders can significantly improve decision quality and reduce costly mistakes.
Successful trading is rarely about finding a magical indicator or predicting every market move correctly. Instead, it is about following a repeatable process that consistently identifies favorable opportunities while controlling risk. A comprehensive checklist helps traders remain disciplined, objective, and focused on probabilities rather than emotions.
메타데이터
- post_id
- d2d731c97fae
- slug
- the-smart-traders-blueprint-essential-technical-analysis-checks-before-you-risk-capital-d2d731c97fae
- url
- https://medium.com/@itastrofinance/the-smart-traders-blueprint-essential-technical-analysis-checks-before-you-risk-capital-d2d731c97fae
- canonical_url
- https://medium.com/@itastrofinance/the-smart-traders-blueprint-essential-technical-analysis-checks-before-you-risk-capital-d2d731c97fae
- author_url
- https://medium.com/@itastrofinance
- status
- ok
- fetched_at
- 2026-07-11 09:49:07




