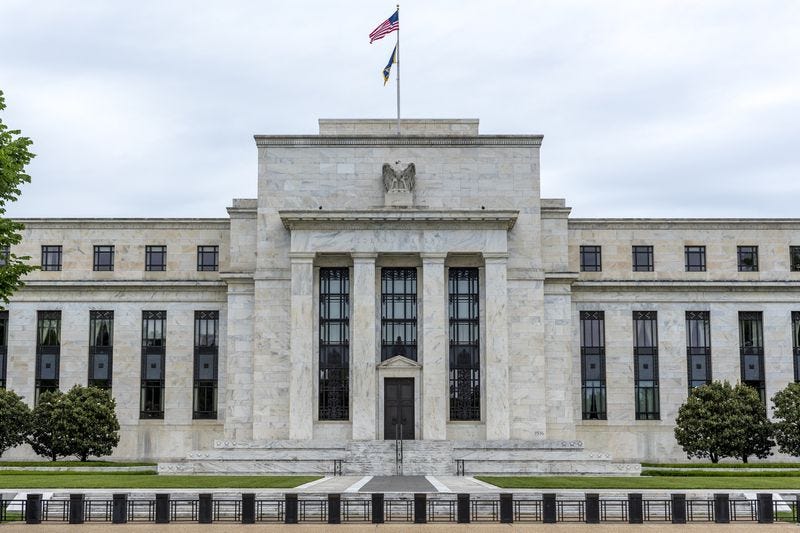
Gold, the Dollar, and the Oval Office
A quantitative test of whether presidents move gold by pressuring the Fed
Gold, the Dollar, and the Oval Office

A quantitative test of whether presidents move gold by pressuring the Fed
What moves gold? Ask most analysts and you’ll get the same checklist: real rates, the dollar, inflation expectations, geopolitical risk. But there’s a variable missing from almost every model — and it’s sitting in the White House.
When a president faces re-election and the economy looks fragile, the political incentive to pressure the Federal Reserve into looser policy is overwhelming. Nixon applied it directly and relentlessly — with unambiguous results. Bush benefited from a more subtle alignment of interests between the White House and the Fed. Trump has done it twice: first through behind-the-scenes efforts to remove Powell and relentless public attacks, now in full public view ahead of the 2026 midterms. In each case, gold responded.
This article combines a historical review of three presidential pressure episodes with a quantitative macro-driver model that tests a specific, falsifiable hypothesis: does political pressure on the Fed amplify gold’s sensitivity to a weakening dollar?
The historical pattern strongly supports the hypothesis. The model supplies the numbers: a 37% amplification of gold’s DXY sensitivity during pressure periods (p < 0.0001). Together they make the case that political pressure on the Fed is not merely interesting context — it’s a statistically significant driver of gold returns.
Part 1: The Historical Pattern
Three episodes stand out. Each involves a Republican president facing an election, an initially-resistant or captured Fed chair, and a sharp gold rally.
1. Nixon-Burns (1970–1974): The Blueprint
Richard Nixon blamed his 1960 loss to Kennedy on Fed chair William McChesney Martin’s tight money. He never forgot it.
Upon taking office, Nixon installed loyalist Arthur Burns — first as Counselor, then as Fed Chair — and pressured him relentlessly. Burns complied: money supply surged, rates stayed low, and in August 1971 Nixon closed the gold window entirely, ending Bretton Woods. By 1974 gold had risen from $35 to over $200 — a 5.7× move in three years.

The confounders are real (oil embargo, Vietnam), but the sequence is unmistakable: political pressure came first, gold followed.
2. Greenspan-Bush (2001–2004): The Accommodation
The Bush-Greenspan dynamic was subtler than Nixon’s brute force — but no less effective. Greenspan publicly endorsed Bush’s tax cuts in 2001. The Fed cut rates 475 basis points that year (dot-com bust, 9/11), then held at 1% — the lowest in 45 years — for a full twelve months leading into the 2004 election.
Gold bottomed at $255 in 2001 and reached $730 by 2006: a 2.9× move in five years.
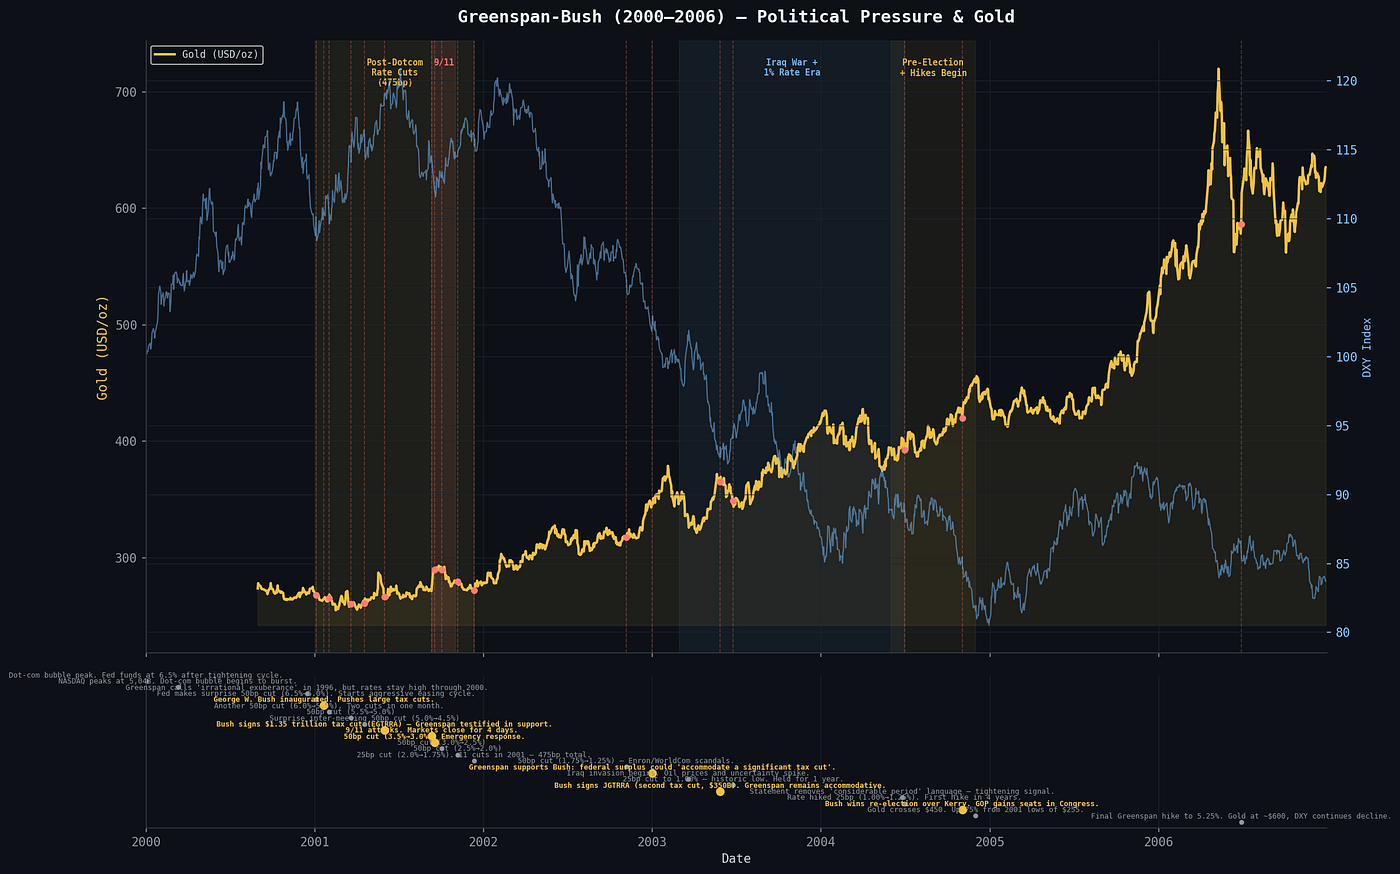
This case is less “smoking gun” than Nixon, but the alignment is clear: Greenspan’s accommodation enabled Bush’s fiscal expansion, and gold tracked the resulting dollar weakness.
3. Trump-Powell (2018–2026): Pressure in Real Time
Trump’s first-term pressure on Powell was unprecedented: public, relentless, and escalating from tweets to outright threats. In 2018 Powell hiked aggressively — then reversed course in 2019, cutting three times and ending quantitative tightening amid slowing global growth and trade war uncertainty. Gold accelerated from $1,200 to $1,550. Whether these cuts reflected genuine capitulation or a data-dependent pivot is debatable; what’s undeniable is the timing.
Trump’s second term (2025–2026) has intensified the pattern. With midterms approaching in November 2026, Trump has escalated to nominating a loyalist successor, threatening Powell publicly, and demanding immediate rate cuts. Gold has surged from $2,650 to $4,570 — a 72% gain in 17 months.

Part 2: The Quantitative Test
The historical pattern is suggestive — but history is easy to fit after the fact. To test the hypothesis rigorously, we built a regression model spanning all three pressure episodes. The question: when political pressure is active, does gold’s response to dollar movements intensify?
The Model
We regress daily gold returns on three standard macro drivers — DXY returns, real 10-year yields (TIPS), and VIX — then introduce two interaction terms:
-
DXY × Political Pressure: tests whether gold’s sensitivity to the dollar changes when a president is actively pressuring the Fed
-
Real Rate × Political Pressure: tests whether gold’s rate sensitivity also shifts
Political pressure is defined as a binary indicator active during three periods: Greenspan easing (2001–2004), Trump’s first-term attacks (2018–2019), and Trump 2.0 (2025–2026). Together these represent 18.1% of all trading days in the dataset (5,833 days from 2000–2026).
A note on scope: the Nixon-Burns period (1970–1974) — the strongest historical analog — is excluded from the quantitative model. Gold was fixed at $35/oz until August 1971, the dollar was pegged under Bretton Woods (no floating DXY existed), and key data series like TIPS were not introduced until 1997. The post-1971 floating window is too short and operates in a monetary regime too different to merge with modern data. This exclusion makes the model conservative: it finds the amplification effect without the most extreme case.
Results
Model D (with interactions):
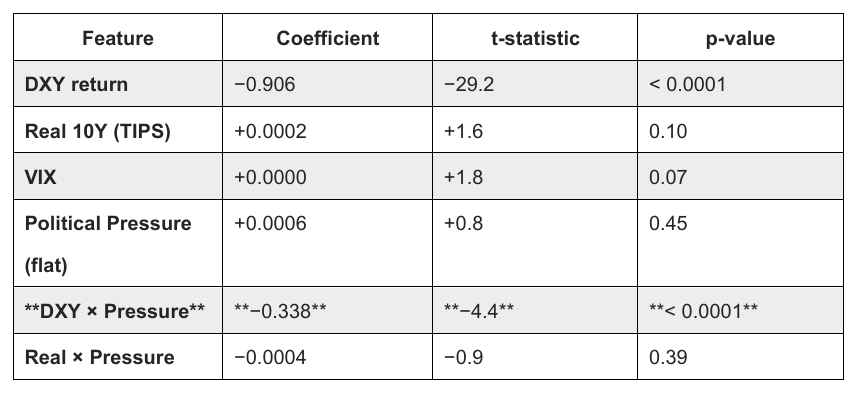
N = 5,833 · Adj R² = 0.168
The flat pressure dummy is not significant (p = 0.45). Political pressure does not raise gold returns on its own. But the DXY × Pressure interaction is highly significant (p < 0.0001, t = −4.4), confirming that pressure periods amplify gold’s sensitivity to dollar movements by roughly 37% (from −0.91 to −1.24).
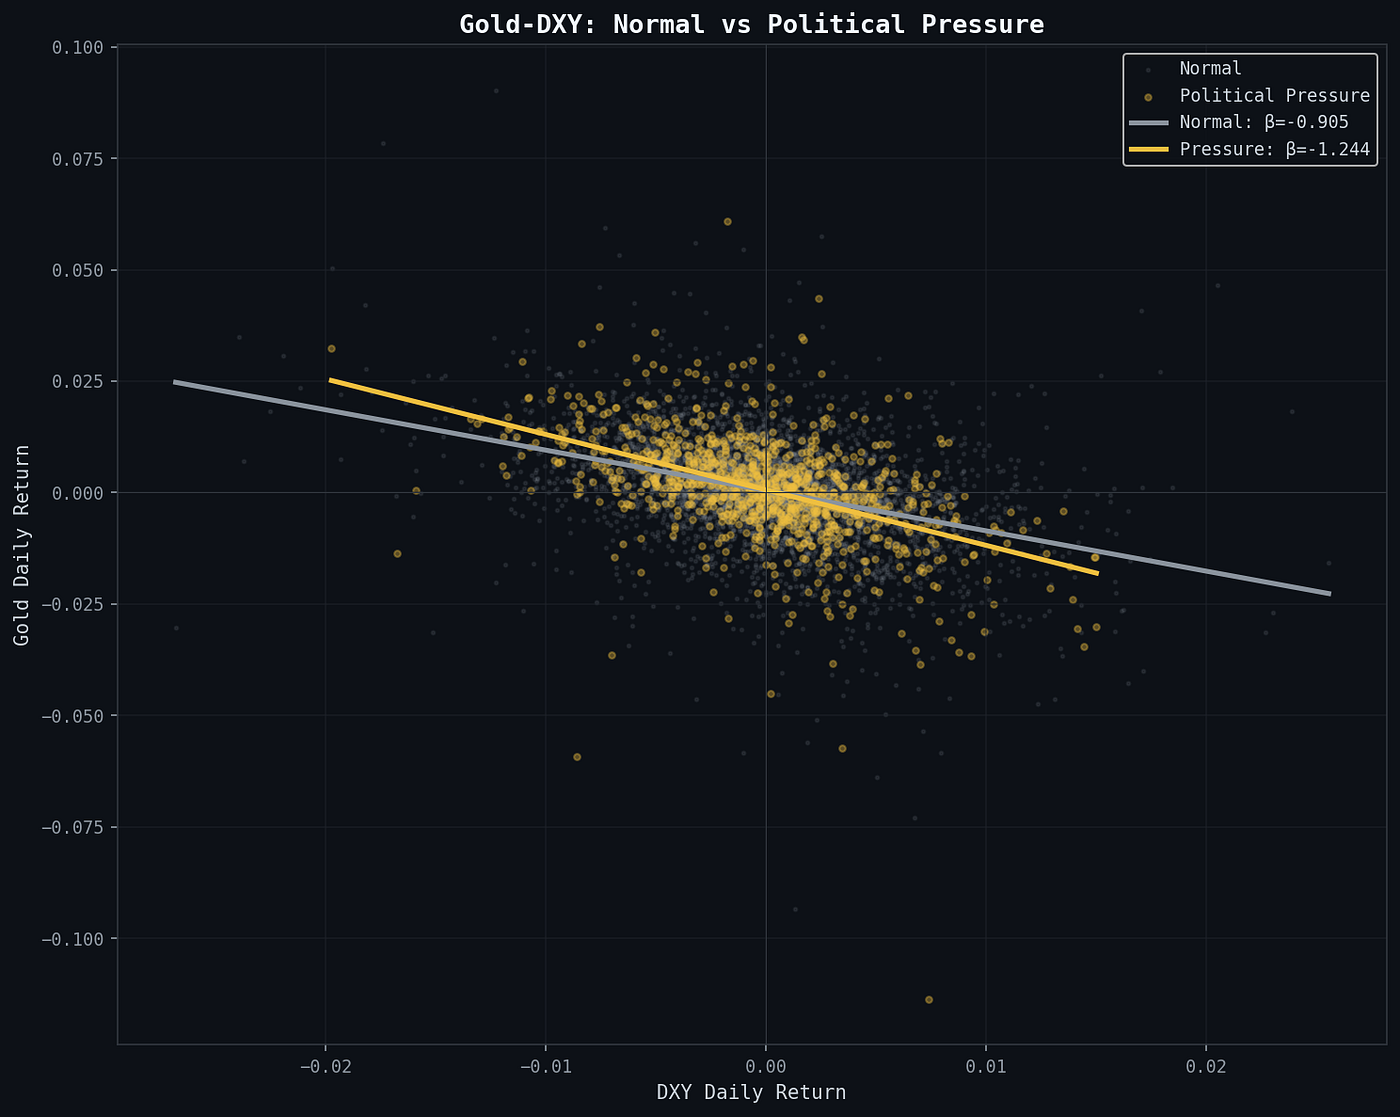
The scatter plot above shows the raw data behind this result. Gold-DXY observations during pressure periods (gold) cluster further from zero on both axes and exhibit a steeper slope than normal periods (grey).
Decomposition: How Much Does the Model Explain?
Using a baseline model (DXY + real rates + VIX only) we decompose gold returns into a predicted component and an unexplained residual:

The model explains 95% of gold’s excess returns during pressure regimes. The doubling of gold returns during pressure periods — from ~11%/yr to ~21%/yr — is almost entirely captured by the interaction between dollar weakness and the pressure dummy. There is no mysterious “political premium” beyond what the model already accounts for.
Regime-by-Regime Breakdown
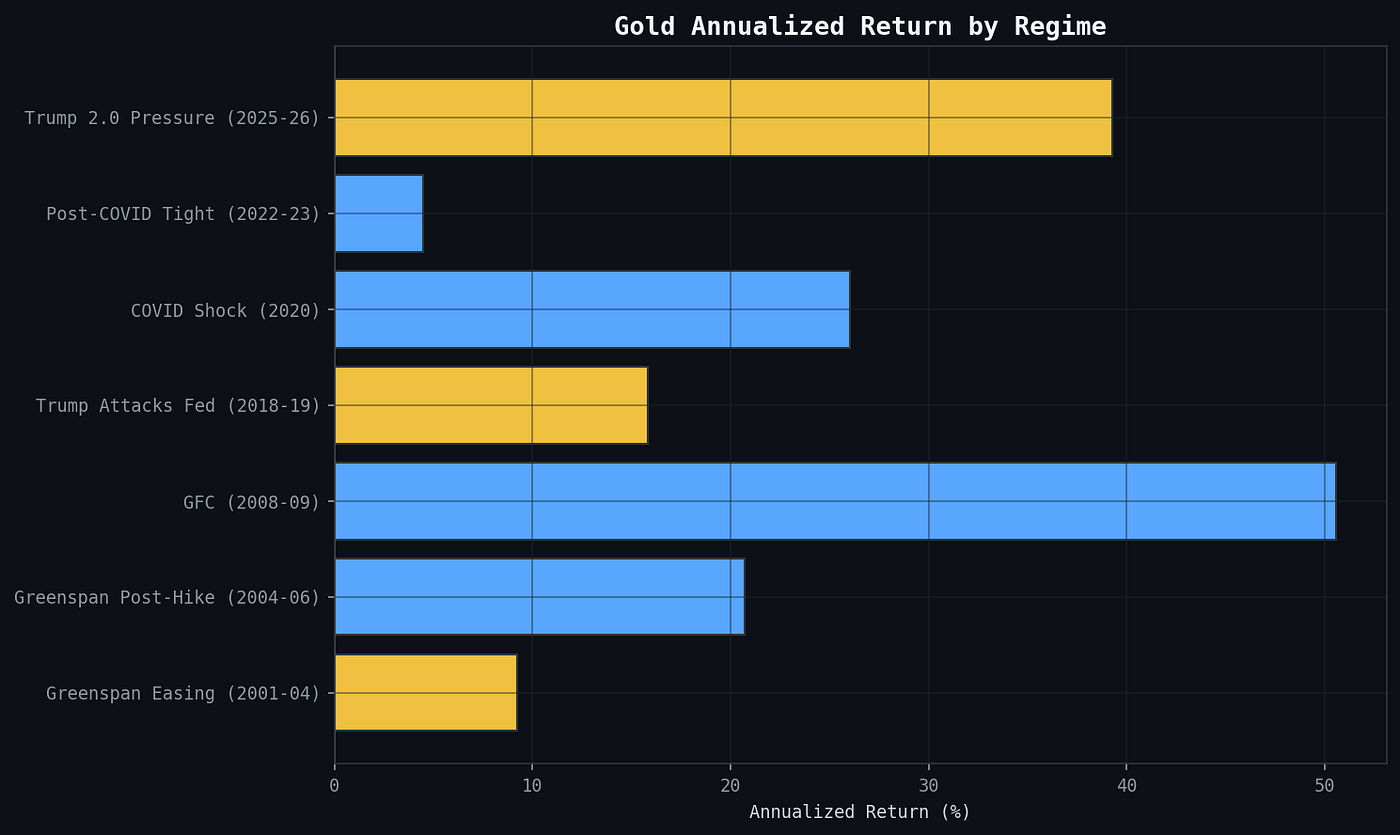
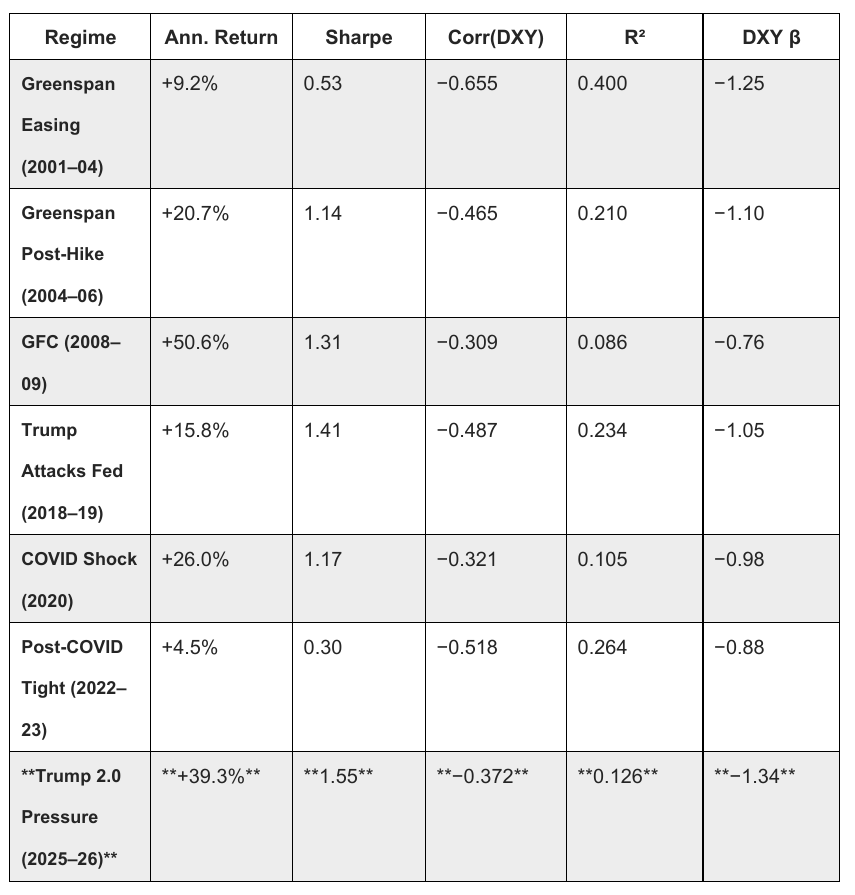
Three findings stand out:
-
Greenspan easing has the strongest R² (0.400). During this period, gold’s moves were most explained by DXY, real rates, and risk — the classic transmission mechanism at work.
-
Trump 2.0 has the strongest DXY beta (−1.34). Gold is more sensitive to dollar moves right now than in any other regime. Each 1% drop in DXY translates to a 1.34% rise in gold — materially stronger than the baseline −0.91.
-
Trump 2.0 has the lowest R² (0.126). Only 12.6% of gold’s daily variance is captured by standard macro drivers. The model works for levels (the 95% decomposition confirms this) but day-to-day swings are driven by forces our model doesn’t capture — tariff shocks, geopolitical headlines, and perhaps the market’s own anticipation of the November midterms.
Part 3: What We Can and Cannot Say
What the model shows
The statistical evidence unambiguously confirms that gold’s sensitivity to the dollar intensifies during periods of presidential pressure on the Fed. The mechanism is clear: a weakening dollar during these periods hits gold harder than it would otherwise. The model captures 95% of excess returns during pressure regimes — there is no “dark matter” beyond what DXY, real rates, and VIX explain.
This finding is consistent across specifications and robust to the choice of pressure episodes.
What the model cannot show
The model cannot prove causality between political pressure and a weaker dollar. The interaction term tells us DXY → gold amplifies, not that pressure → ↓DXY. The link from political pressure to actual Fed policy — and from there to currency markets — remains a causal chain the model observes but does not test.
Nor can the model forecast: it quantifies amplification when both pressure and dollar weakness are present, but cannot predict whether future dollar weakness will occur.
The conditional statement
The model supports a conditional forecast, not a prediction:
If political pressure on the Fed intensifies ahead of the November 2026 midterms — and if that pressure coincides with dollar weakness — then gold’s response to that dollar weakness will be amplified by roughly 37% relative to normal periods.
The historical analog provides the narrative for why this happens. The model provides the number for by how much.
Conclusion
Gold’s relationship with the dollar has always been the cornerstone of any macro model. But that relationship is not constant — it stiffens when presidents lean on the Fed.
The historical record is consistent: Nixon applied overt pressure and gold exploded. Greenspan’s accommodation enabled Bush’s fiscal expansion with the same result — quietly. Trump is now testing the pattern in public, in real time, with the largest gold rally in modern history as the scoreboard.
The quantitative evidence aligns with the historical narrative: gold returns roughly double during political pressure episodes (from 11%/yr to 21%/yr), the extra return is almost entirely explained by an intensification of the DXY → gold channel, and the DXY beta rises from −0.91 to −1.24 — a 37% amplification that is statistically significant at p < 0.0001.
The story is conditional. It does not predict a gold rally. It says: if the dollar weakens while Trump pressures the Fed, gold will react more violently than your model expects. For anyone trading gold through the 2026 midterms, that is worth knowing.
This analysis is published as part of the gold-regime-project. All data, model code, and charts are available in this repository. Charts were generated May 30, 2026 using data through that date.
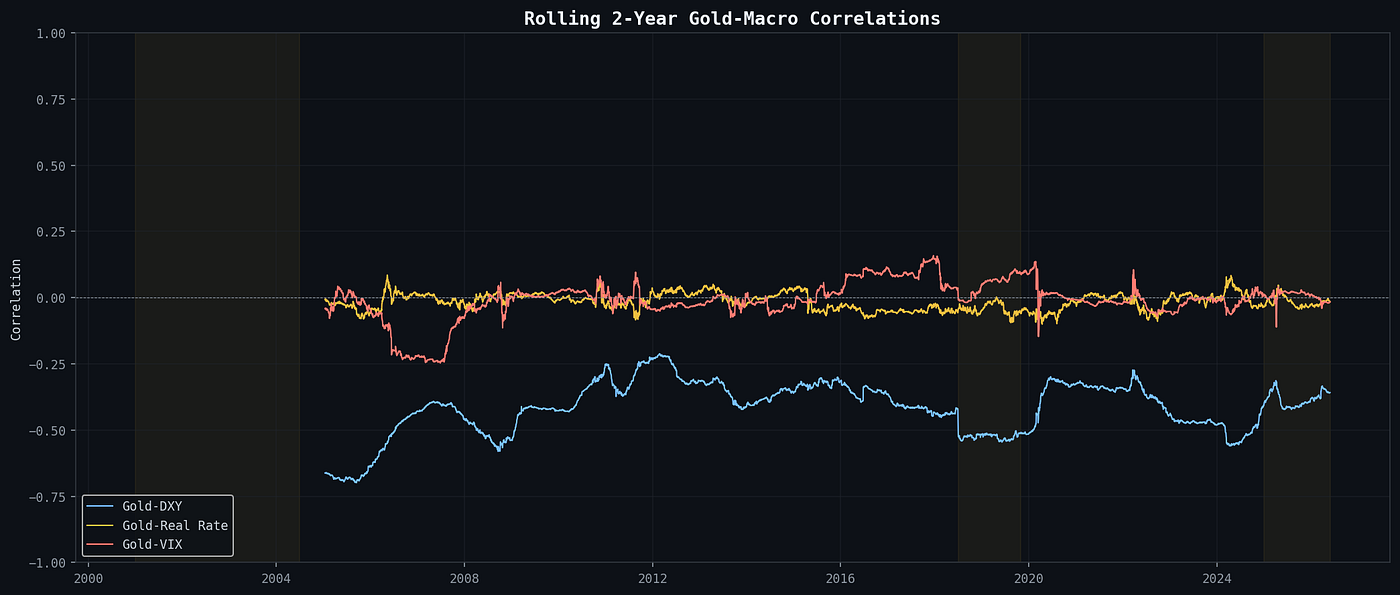
Rolling 2-year correlations of gold with DXY (blue), real rates (orange), and VIX (red). Yellow shaded regions mark political pressure episodes. Gold-DXY correlations dip most sharply during these windows.
메타데이터
- post_id
- d37c2ddc56ab
- slug
- gold-the-dollar-and-the-oval-office-d37c2ddc56ab
- url
- https://medium.com/@Jonathho/gold-the-dollar-and-the-oval-office-d37c2ddc56ab
- canonical_url
- https://medium.com/@Jonathho/gold-the-dollar-and-the-oval-office-d37c2ddc56ab
- author_url
- https://medium.com/@Jonathho
- status
- ok
- fetched_at
- 2026-06-09 15:37:30