Why Your AI Agent Looks Magical in the Demo and Broken in Production
The percentile math that quietly destroys multi-step LLM systems
Why Your AI Agent Looks Magical in the Demo and Broken in Production
The percentile math that quietly destroys multi-step LLM systems
The demo worked.
The agent answered the investor question in 4.2 seconds. Three tool calls, one retrieval, one synthesis step, all stitched together with a confident response. The deck moved on. The deal closed two weeks later.
Three weeks after launch, the support inbox was on fire.
“The agent is broken.”
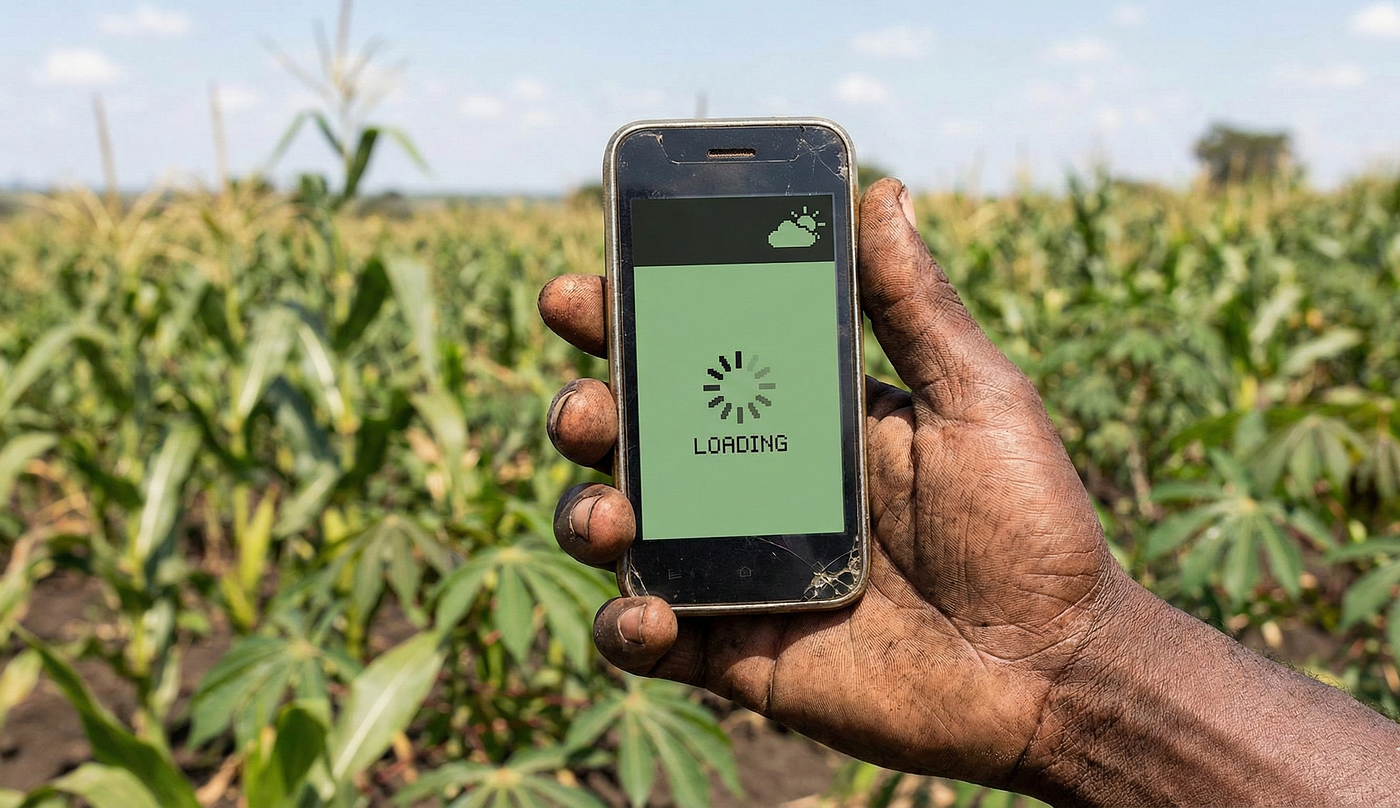
“It just sits there.”
“I waited 45 seconds and then it errored out.”
We pulled the dashboards. Average response time, 4.6 seconds. Within target. Uptime, 99.7 percent. Within target. Yet paying customers were churning.
We were measuring the wrong thing. We had not understood what tail latency does to multi-step systems. By the time we did understand, we had lost more than ten percent of our paid users to a competitor whose model was technically worse than ours.
This is the lesson nobody puts on the conference slide. If you build, ship, or run AI agents, you need to understand percentiles. Not the textbook way. The way that decides whether your product survives its first month with real users.
The percentile crash course
Imagine an airport security line at 6 am.
Most travelers clear screening in under five minutes. A few breeze through in under two. And one unlucky traveler, the one whose laptop bag got flagged, is standing there at twenty minutes while a supervisor walks over.
The average wait is around six minutes. Tolerable on paper. But that one traveler missed their flight. They are now writing reviews of the airport, the airline, and possibly the country.
Percentiles tell you the truth that averages hide.
- p50 is the median. Half of users had a faster experience. Half had a slower one.
- p75 is what three quarters of your users experienced or better.
- p90 captures everyone except the unlucky ten percent.
- p95 is the slowest one in twenty.
- p99 is the slowest one in a hundred. The traveler whose bag got flagged.
In a typical web service, p99 is annoying. In an AI agent, p99 is the entire game.
Why AI systems break the rules
A regular API call has one path through the system. A database query, a deterministic computation, a response. The distribution of latencies is usually well behaved.
An LLM call is not well behaved.
Token generation time depends on how many tokens the model decides to produce. A short answer takes 800 milliseconds. A long answer with a chain of thought takes nine seconds. Same prompt, sometimes. Same model. Different latency by an order of magnitude.
Add streaming variability, GPU queue contention, prompt cache hits and misses, retrieval calls, function tool execution, and a model that occasionally decides to be verbose. You have a distribution with a fat, ugly tail.
A typical LLM call distribution might look like this.
- p50: 1.2 seconds
- p75: 1.8 seconds
- p90: 2.6 seconds
- p95: 3.4 seconds
- p99: 8.7 seconds
The gap between p95 and p99 is the warning sign. Five percent of your users got a fast response. One percent of your users sat through something that took almost three times as long as the next slowest cohort.
That is one call. Now chain five of them.
The math that kills agents
Here is the part that nobody warns you about when you decide to build an agent.
Suppose your agent runs five steps. A retrieval call, a planning call, two tool calls, a synthesis call. Each step has a one percent chance of hitting its p99 tail.
The probability that at least one of those steps hits the tail in any given user request is not one percent. It is closer to five percent.
That means one in twenty requests will hit at least one slow step. And if even one of the five steps takes nine seconds while the rest are fast, the user is staring at a loading spinner for an uncomfortable amount of time.
Now run the math the other way. If your per-step p99 is nine seconds, your end-to-end p99 for a five-step agent will sit somewhere between fifteen and forty seconds depending on how the slow paths line up. The fast majority of users see a four-second response. The unlucky few see something that feels like the system is broken.
They are not wrong. From their experience, it is broken.
Why the demo always works
Demos work because demos are curated.
You run the prompt twice in advance. The caches are warm. The GPU is uncontested. The team is watching. The conditions are perfect.
Production is the opposite. Production is a thousand users hitting your agent at the same time. Cold caches. GPU queues. Network jitter. A vector database that is rebuilding an index. A third-party API that is rate limiting you.
The p50 in the demo is the p50 in production. The p99 in the demo never shows up in the demo.
That is why your AI agent looks magical in front of the customer and slow in front of their billing department.
Three habits that separate AI teams from AI products
Most teams shipping LLM features measure averages and call it observability. The teams shipping AI products that survive measure something different.
One. Track end-to-end p95 and p99, not per-step averages. Per-step averages will tell you the system is healthy when the chained reality is broken. End-to-end percentiles tell you what the user actually experienced from prompt to final token.
Two. Engineer for the tail. Set timeouts on every step. Add fallback paths that route to a smaller, faster model when the primary call exceeds a threshold. Stream early so the user sees motion even when the full response is slow. Cap total response time and degrade gracefully rather than letting an agent run open-ended.
Three. Alert on tail growth, not threshold breach. When your p99 starts climbing while your p50 stays flat, something is degrading at the edges. By the time your p50 moves, the slowest customers have been hurting for hours, and a portion of them have already opened tickets or cancelled.
The hard truth about AI products
The industry has spent the last two years celebrating capability. What model can do this. What benchmark just got beaten. How many tokens per second the new GPU can push.
Almost nobody is talking about distribution.
Yet distribution is what your customers experience. A model that is sharp in the median and ugly in the tail will lose to a slightly less capable model that is consistent. Reliability beats peak performance in production. It always has. It always will.
The benchmark score is not your product. The demo video is not your product. The average response time is not your product.
Your worst response is your real product.
Watch the tail. That is where your AI agent lives or dies.
If this resonated, follow me for more on AI systems, observability, and the hard-won lessons of running platforms at scale.
What is the worst tail-latency surprise you have hit in an AI product? Drop it in the comments. I read every one.
메타데이터
- post_id
- d39a2ab0ae40
- slug
- why-your-ai-agent-looks-magical-in-the-demo-and-broken-in-production-d39a2ab0ae40
- url
- https://medium.com/@shahzadasghar/why-your-ai-agent-looks-magical-in-the-demo-and-broken-in-production-d39a2ab0ae40
- canonical_url
- https://medium.com/@shahzadasghar/why-your-ai-agent-looks-magical-in-the-demo-and-broken-in-production-d39a2ab0ae40
- author_url
- https://medium.com/@shahzadasghar
- status
- ok
- fetched_at
- 2026-06-10 08:17:25