Financial Complaints Analytics — Exploring Consumer Protection through Data
The Consumer Financial Protection Bureau (CFPB), founded in 2011, stands as the United States’ central watchdog for consumer protection in…
Financial Complaints Analytics — Exploring Consumer Protection through Data
Skills: Tableau, Exploratory Data Analysis, Data visualizaion
Background
The Consumer Financial Protection Bureau (CFPB), founded in 2011, stands as the United States’ central watchdog for consumer protection in the financial sector. Its oversight stretches wide, from banks and credit unions to payday lenders, mortgage servicers, and debt collectors. Every complaint filed under its jurisdiction carries a story: frustration, resolution, or silence.
This project dives into that ocean of complaints. Over 62,516 consumer submissions, directed against 1,081 companies, form the foundation of this analysis. The dataset, composed of two linked tables, a Complaints (fact table) and a Company (dimension table), provides a rare view into how the financial industry responds when customers raise their voices.
Built entirely in Tableau, the project turns dense complaint data into an interactive visual story. It is not just about numbers; it is about accountability, who listens, who responds on time, and who does not.
The analysis is organized into three interconnected views:
• Overview — maps out the landscape of complaints, showing what products people complain about, which states report the most issues, and how many cases remain open or resolved.
• Response Performance — measures how quickly and effectively companies act.
• Behavioral Analysis — looks deeper into the outcomes, focusing on monetary and non-monetary relief and how companies handle issues once they reach their desks. It is where resolution meets responsibility.
Link to the interactive dashboard here.
Data Overview and Quality Assessment
The dataset used for this analysis comprises two related tables. The Complaints (Fact) table contains 62,516 complaint records, while the Company (Dimension) table includes information on 1,081 financial institutions.
Key fields in the complaint table include details such as Complaint ID, Date Submitted, Product, Issue, Company Response, Timely Response, Response Time (Days), and State. The company table complements it with attributes like Company ID, Market Share, Reputation Score, Company Size Tier, and Average Response Time.
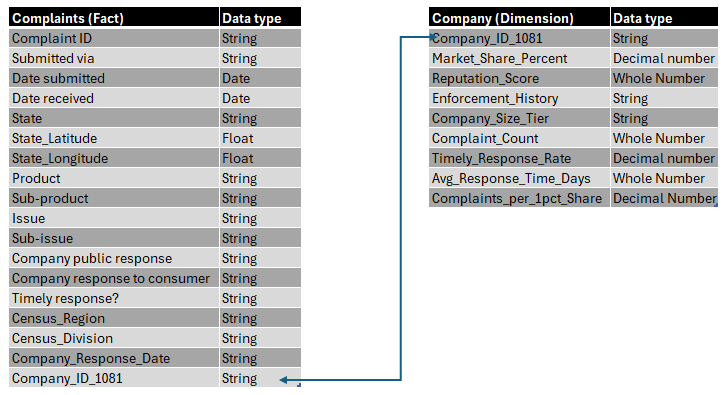
Before the main analysis, a data quality assessment was conducted. The process involved checking for duplicates, identifying missing or inconsistent values, and validating relationships between complaint and company identifiers. Outliers in response times and relief values were reviewed to ensure accuracy and reliability.
This exploratory phase helped confirm the dataset’s integrity and provided a clear foundation for visualization and metric computation.
Executive Summary
General Overview
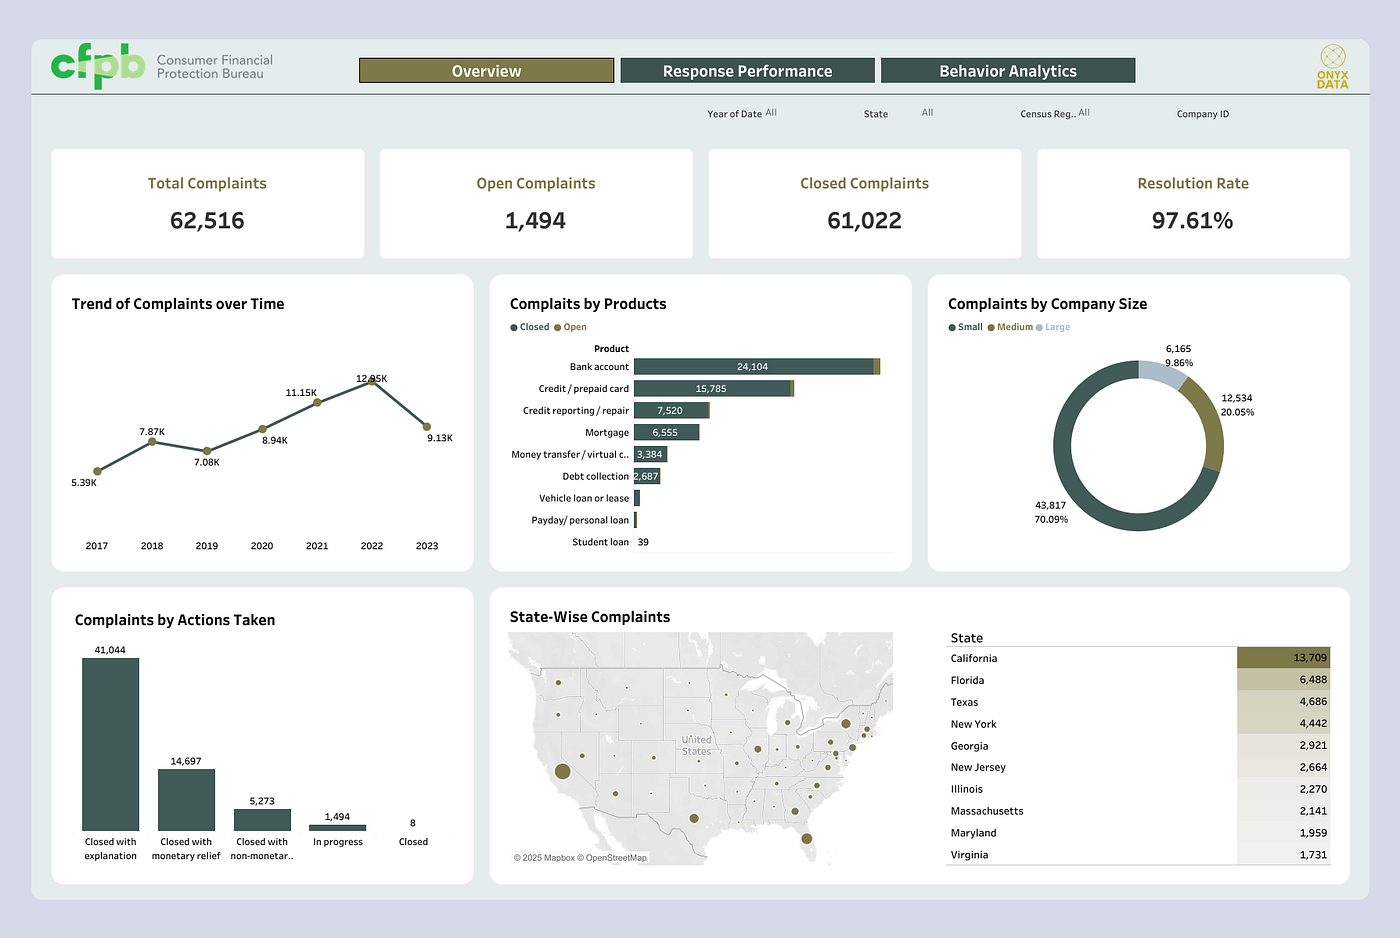
Over 62,000 consumer complaints were analyzed in this study, revealing both the scale and consistency of financial disputes across the United States. Of the 62,516 total complaints, 61,022 have been closed while 1,494 remain open, resulting in a resolution rate of 97.61%. Companies responded, on average, within 15 days, and 93.77% of cases received a timely response.
Complaint volume has grown steadily over the years, climbing from 5,394 in 2017 to a peak of 12,953 in 2022, with a slight dip observed in 2019. This upward trend suggests growing consumer engagement and awareness of financial accountability.
Across product categories, bank account and related services dominate the complaints, accounting for more than 24,000 reports, leading the second place with over 8,000 reports. Geographically, California stands out with 13,709 complaints, more than twice that of Florida, the next most reported state.
Overview
- Complaint volumes have grown steadily over the years, reflecting increased consumer awareness and engagement. The highest spike occurred in 2018 with a 45.94% year-over-year increase, while 2019 saw a brief decline of 10.12% before complaints surged again through 2022, peaking at 12,953.
- By 2023, the total dropped to 9,131, marking a 29.51% decrease, possibly indicating improved company responsiveness or reporting delays.
- Across product categories, checking or savings accounts generated the most complaints, totaling 24,814 cases (39.69% of all reports). Credit cards and prepaid cards followed with 16,197 complaints (25.91%), while credit reporting and repair services accounted for 7,710 (12.33%).
- Other notable areas include mortgages (6,601 complaints, 10.56%), money transfer and virtual currency services (3,453, 5.52%), and debt collection (2,736, 4.38%), with smaller shares for vehicle loans, personal loans, and student loans.
- In terms of outcomes, most complaints were closed with explanation (65.65%) or closed with monetary relief (23.51%). Non-monetary resolutions accounted for 8.43%, while 2.39% remain in progress, showing that most issues were addressed in some form.
- Complaint distribution by company size reveals that small companies received the majority of complaints (70.09%), followed by medium-sized firms (20.05%) and large firms (9.85%).
- Geographically, California leads with 13,709 complaints, representing 21.93% of all submissions. It is followed by Florida (6,488; 10.38%), Texas (4,686; 7.50%), New York (4,442; 7.11%), and Georgia (2,921; 4.67%). Other highly reported states include New Jersey, Illinois, Massachusetts, Maryland, and Virginia, all within the top ten by volume.
Response Performance
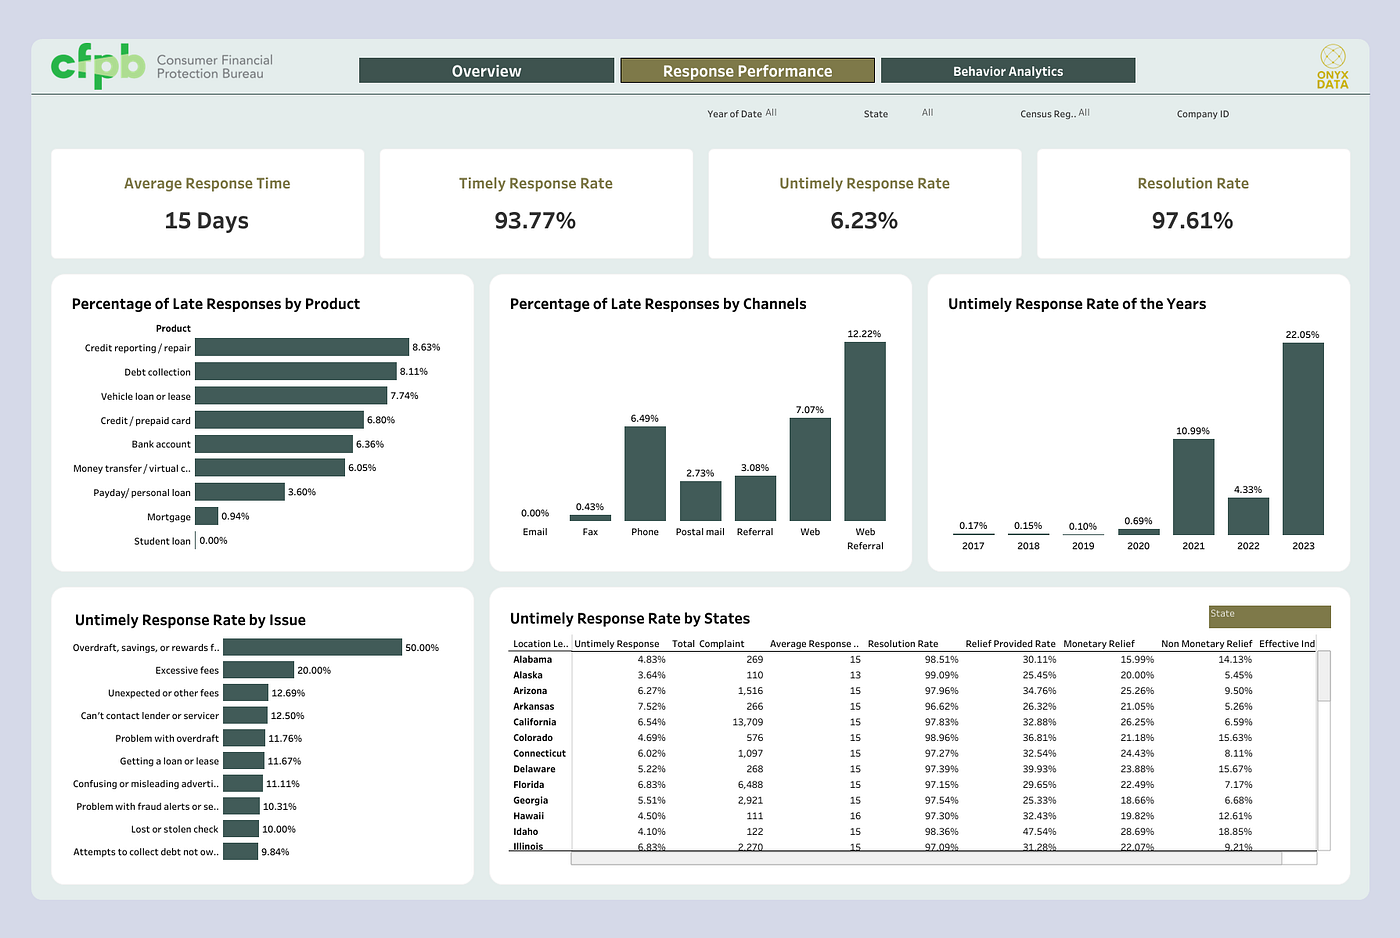
With a timely response rate of 93.77%, most complaints are handled efficiently. However, to understand where delays occur and what factors hinder a perfect record, it is essential to focus on the untimely response rate. This measure reveals subtle weaknesses across products, regions, and communication channels that collectively shape the overall performance of companies.
- Over time, untimely responses have shown irregular patterns. Between 2017 and 2020, late responses were almost negligible, staying below 1%. A sharp jump appeared in 2021 (10.99%), followed by a moderate dip in 2022 (4.33%), and a significant spike again in 2023 (22.05%), indicating potential operational slowdowns or heavier complaint loads.
- Across product categories, the highest untimely response rates are seen in credit reporting services (8.63%) and debt collection (8.11%). Credit cards (6.80%) and checking or savings accounts (6.36%) also contribute noticeably, while mortgages maintain the lowest delay rate at 0.94%, suggesting a more structured handling process in that sector.
- How complaints are submitted also plays a role in responsiveness. Those filed via Web Referral (12.22%) and Web (7.07%) channels are more likely to experience delays compared to Fax (0.43%) and Postal Mail (2.73%) submissions while those submitted via mail has no delays. Digital channels, though faster to access, seem to face higher response bottlenecks.
- Certain issues appear more prone to untimely responses. Complaints involving excessive fees (20.00%), overdraft or reward features (50.00%), and unexpected or other fees (12.69%) stand out as major delay drivers. These categories may require additional verification or internal coordination, extending response time.
- At the state level, untimely response rates range from 6% to 9% among the top ten states with the highest delays. Iowa (9.09%), North Dakota (9.09%), and Indiana (8.86%) report the highest rates, while states like Virginia (7.05%) and Oregon (7.10%) perform slightly better. The pattern suggests that while the issue is widespread, no single state dominates the delays.
Behavioral Analytics
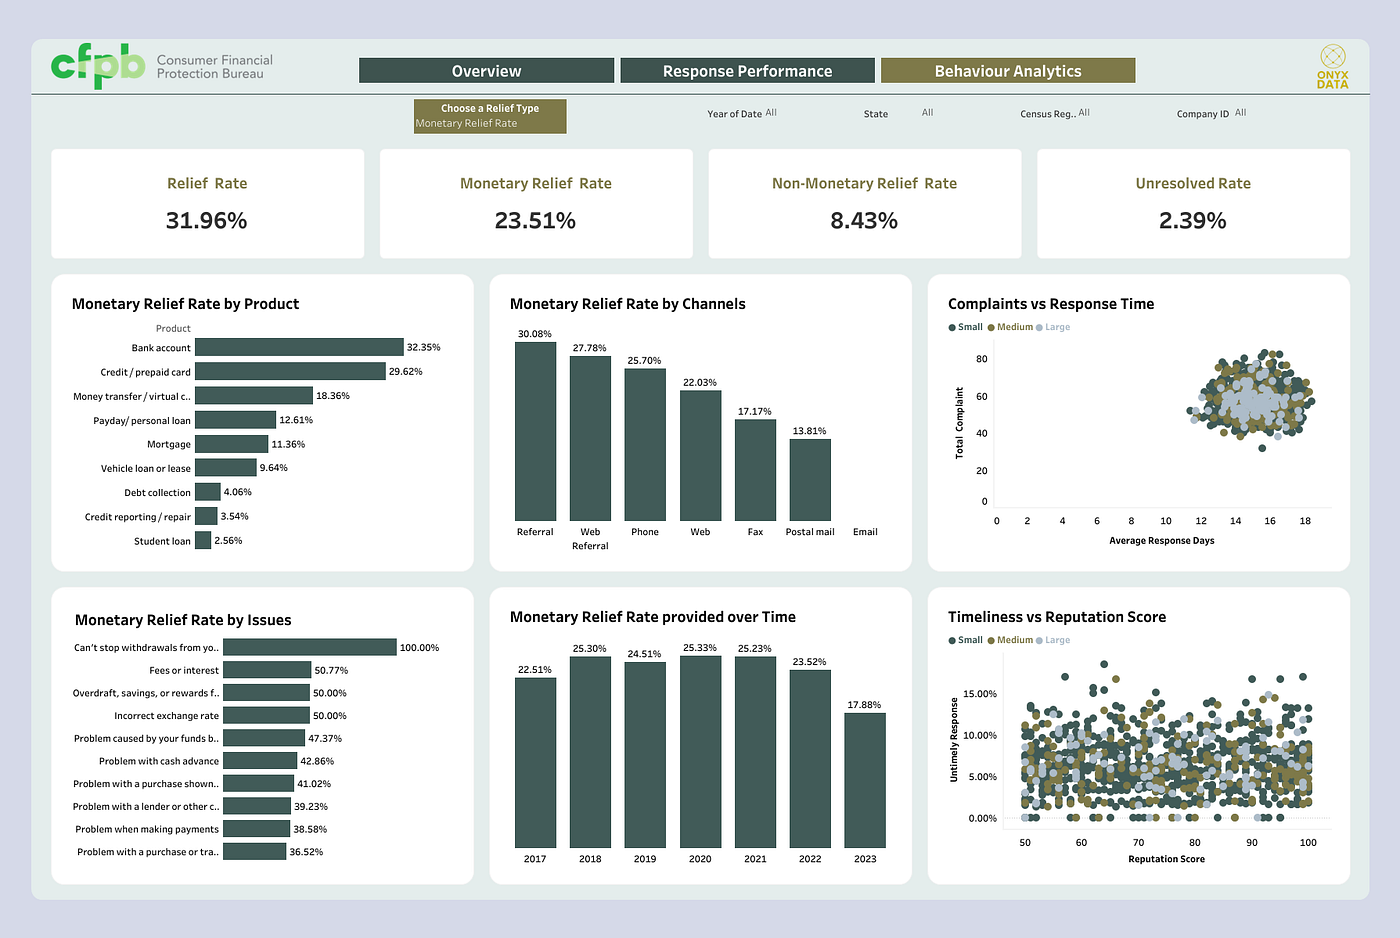
- Over the years, monetary relief rates have remained fairly consistent, fluctuating around 24–25% between 2018 and 2021, before dropping to 17.88% in 2023. The slight decline in recent years could indicate stricter claim validation or changes in company resolution policies.
- By product category, checking or savings accounts (32.35%) and credit cards or prepaid cards (29.62%) generate the highest rates of monetary relief, suggesting companies prioritize direct compensation in these areas. In contrast, credit reporting (3.54%) and debt collection (4.06%) show minimal monetary redress, likely reflecting limited financial liability in those complaint types.
- Submission channels also influence outcomes. Referrals (30.08%), Web Referrals (27.78%), and Phone submissions (25.70%) are more likely to result in monetary relief compared to Postal Mail (13.81%) or Fax (17.17%), showing a preference for faster, traceable channels in compensation handling.
- Certain issues stand out for their high monetary response. Unexpected or other fees (32.78%), overdraft problems (23.53%), and excessive fees (20.00%) consistently yield higher relief rates, indicating that companies are more responsive when charges or losses directly affect consumers’ finances.
- On the other hand, complaints about debt collection or loan processing receive the least monetary relief, reinforcing the idea that financial compensation is more common when tangible funds are at stake rather than procedural disputes.
Recommendations
- Improve Timeliness Across Digital Channels
Web and referral submissions record the highest untimely response rates, above 7% and 12% respectively. Streamlining digital complaint workflows and automating case routing can significantly reduce delays and enhance overall responsiveness.
- Enhance Oversight on High-Risk Issues
Issues like excessive fees, overdrafts, and unexpected charges show both high delay and high monetary relief rates. Establishing targeted monitoring and faster escalation for these categories can improve efficiency and consumer trust.
- Reassess Resolution Procedures for Credit Reporting and Debt Collection
These areas show very low monetary relief despite high complaint volumes. Reviewing investigation and resolution practices can ensure fairer outcomes and better transparency in handling disputes.
- Maintain and Improve Timely Response Benchmark
With a strong 93.77% timely response rate, continuous optimization , through automated reminders, performance tracking, and staff training, can help push response efficiency closer to full compliance.
메타데이터
- post_id
- d3bcd76e6d5f
- slug
- financial-complaints-analytics-exploring-consumer-protection-through-data-d3bcd76e6d5f
- url
- https://medium.com/@amujibtaiwo/financial-complaints-analytics-exploring-consumer-protection-through-data-d3bcd76e6d5f
- canonical_url
- https://medium.com/@amujibtaiwo/financial-complaints-analytics-exploring-consumer-protection-through-data-d3bcd76e6d5f
- author_url
- https://medium.com/@amujibtaiwo
- status
- ok
- fetched_at
- 2026-06-15 20:49:13



