A Hands-On Guide to Suricata IDS: Examining Rules and Parsing Logs
Part 1: Examining a Custom Suricata Rule
A Hands-On Guide to Suricata IDS: Examining Rules and Parsing Logs
Cover Page
Part 1: Examining a Custom Suricata Rule
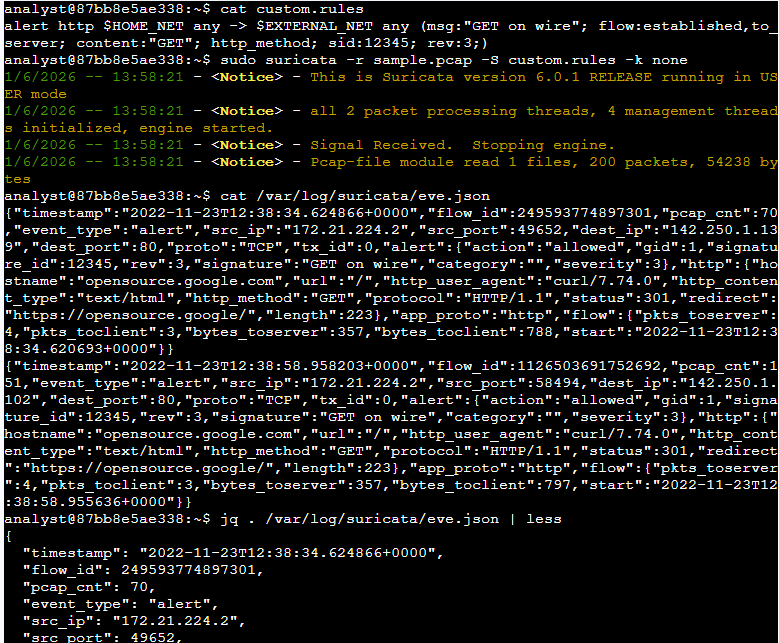
Before running Suricata, we need to know what we are telling it to look for. Suricata uses rules or signatures to identify malicious or suspicious traffic. For this lab, I have a file named custom.rules.
Let us see what is inside by running the cat command:
Bash
cat custom.rulesPlaintext
alert http $HOME_NET any -> $EXTERNAL_NET any (msg:"GET on wire"; flow:established,to_server; content:"GET"; http_method; sid:12345; rev:3;)This might look intimidating at first glance, but we can break it down into three logical components: action, header, and rule options.
- Action: The first word is “alert”. This tells Suricata to generate an alert if the subsequent conditions are met. Other common actions include drop, pass, or reject.
- Header: This defines the network parameters. “http” restricts the rule to HTTP traffic. “$HOME_NET any -> $EXTERNAL_NET any” tells Suricata to monitor traffic leaving our defined local network from any port, heading towards an external network on any port.
- Rule Options: Enclosed in parentheses, these narrow down exactly what the payload should look like.
- The “msg” option defines the alert text we will see in our logs.
- The “flow” option ensures the TCP connection is already established.
- The “content” option looks for the specific HTTP method “GET”.
- Finally, “sid” gives this rule a unique ID, and “rev” indicates the version of this rule.
In short, this rule will trigger an alert whenever someone on the internal network makes a successful HTTP GET request to an external server.
Part 2: Triggering the Rule with a PCAP File
Now it is time to put this rule to the test. Instead of waiting for live traffic, I am using a sample.pcap file, which contains recorded network traffic.
First, let us verify that our log directory is empty.
Bash
ls -l /var/log/suricataPlaintext
total 0Now, we execute Suricata with our custom rule against the packet capture:
Bash
sudo suricata -r sample.pcap -S custom.rules -k nonePlaintext
11/23/2022 -- 12:38:34 - <Notice> - This is Suricata version 6.0.4 running in USER mode
11/23/2022 -- 12:38:34 - <Notice> - all 1 packet processing threads, 4 management threads initialized, engine started.
11/23/2022 -- 12:38:35 - <Notice> - Signal Received.  Stopping engine.
11/23/2022 -- 12:38:35 - <Notice> - Pcap-file module read 1 files, 150 packets, 34000 bytes
Here is a quick breakdown of the flags used:
- -r specifies the input pcap file.
- -S tells Suricata to use our specific custom.rules file.
- -k none disables checksum validation. Since we are using a sample capture, we do not need Suricata to drop packets based on bad checksums.
fter the engine finishes processing the packets, let us check the log directory again.
Bash
ls -l /var/log/suricataPlaintext
total 16
-rw-r--r-- 1 root root 4200 Nov 23 12:38 eve.json
-rw-r--r-- 1 root root  280 Nov 23 12:38 fast.log
-rw-r--r-- 1 root root  800 Nov 23 12:38 stats.log
-rw-r--r-- 1 root root 1200 Nov 23 12:38 suricata.log
You will notice several new files, but we are going to focus on fast.log first. Let us view its contents:
Bash
cat /var/log/suricata/fast.logPlaintext
11/23/2022-12:38:34.624866  [**] [1:12345:3] GET on wire [**] [Classification: (null)] [Priority: 3] {TCP} 172.21.224.2:49652 -> 142.250.1.139:80
11/23/2022-12:38:58.958203  [**] [1:12345:3] GET on wire [**] [Classification: (null)] [Priority: 3] {TCP} 172.21.224.2:58494 -> 142.250.1.139:80
The fast.log file provides a quick, human-readable summary of triggered alerts. You can clearly see our “GET on wire” message, the priority, the protocol, and the source and destination IP addresses. While this format is great for a quick check, it is actually considered a legacy format and lacks the depth needed for a real incident response investigation. For that, we need to look at eve.json.
Part 3: Deep Dive into EVE JSON using JQ
The eve.json file is Suricata’s standard log file. It records extensive metadata about every event in JSON format. If you try to read it with a standard cat command, you will be hit with a massive wall of text that is nearly impossible to parse visually.
To make sense of it, we use a command-line JSON processor called jq.
Bash
jq . /var/log/suricata/eve.json | lessJSON
{
  "timestamp": "2022-11-23T12:38:34.624866+0000",
  "flow_id": 14500150016149,
  "pcap_cnt": 54,
  "event_type": "alert",
  "src_ip": "172.21.224.2",
  "src_port": 49652,
  "dest_ip": "142.250.1.139",
  "dest_port": 80,
  "proto": "TCP",
  "alert": {
    "action": "allowed",
    "gid": 1,
    "signature_id": 12345,
    "rev": 3,
    "signature": "GET on wire",
    "category": "",
    "severity": 3
  },
  "http": {
    "hostname": "142.250.1.139",
    "http_method": "GET",
    "protocol": "HTTP/1.1",
    "length": 0
  },
  "app_proto": "http",
  "flow": {
    "pkts_toserver": 4,
    "pkts_toclient": 3,
    "bytes_toserver": 380,
    "bytes_toclient": 2045,
    "start": "2022-11-23T12:38:34.600123+0000"
  }
}
This formats the JSON payload into a readable, indented structure. You can see details like severity levels, signature IDs, and full network telemetry.
However, in a real SOC environment, you often only care about specific fields. We can instruct jq to extract only the data we need. For example, if I only want to see the timestamp, flow ID, alert signature, protocol, and destination IP, I can run:
Bash
jq -c "[.timestamp,.flow_id,.alert.signature,.proto,.dest_ip]" /var/log/suricata/eve.jsonJSON
["2022-11-23T12:38:34.624866+0000",14500150016149,"GET on wire","TCP","142.250.1.139"]
["2022-11-23T12:38:58.958203+0000",1647223379236084,"GET on wire","TCP","142.250.1.102"]
This is where the true power of log analysis shines. One of the most important fields extracted here is the flow_id. Suricata assigns a unique numerical ID to each network flow (a sequence of packets between a source and destination).
If we spot a suspicious alert and want to see all network activity associated with that specific session, we can filter the entire eve.json file using that specific flow_id. Just replace the X with the numeric ID from your previous output:
Bash
jq "select(.flow_id==14500150016149)" /var/log/suricata/eve.jsonSON
{
  "timestamp": "2022-11-23T12:38:34.624866+0000",
  "flow_id": 14500150016149,
  "event_type": "alert",
  "src_ip": "172.21.224.2",
  "dest_ip": "142.250.1.139",
  "proto": "TCP",
  "alert": {
    "signature": "GET on wire",
    "severity": 3
  }
}
Conclusion
Running this lab provided a clear perspective on how intrusion detection systems operate under the hood. Writing a signature is only half the battle. The real work of a security analyst involves interpreting the massive amount of telemetry data those signatures generate. By understanding how to navigate custom rules and manipulate JSON logs using command-line tools, we can efficiently track down suspicious network behavior.
If you are a fellow computer science student interested in cybersecurity, I highly recommend setting up a local Linux VM and playing around with Suricata and jq. It is a fantastic way to bridge the gap between theoretical networking concepts and practical security operations.
메타데이터
- post_id
- d4e16531b6d2
- slug
- a-hands-on-guide-to-suricata-ids-examining-rules-and-parsing-logs-d4e16531b6d2
- url
- https://medium.com/@yosuajp123/a-hands-on-guide-to-suricata-ids-examining-rules-and-parsing-logs-d4e16531b6d2
- canonical_url
- https://medium.com/@yosuajp123/a-hands-on-guide-to-suricata-ids-examining-rules-and-parsing-logs-d4e16531b6d2
- author_url
- https://medium.com/@yosuajp123
- status
- ok
- fetched_at
- 2026-06-09 15:37:30