Jmeter Complete Guide
JMeter Complete Beginner Guide
Jmeter Complete Guide
JMeter Complete Beginner Guide
How I learned to run my first performance test, step by step
I remember the first time someone asked me to “run a load test.”
I had no idea what that meant. I opened JMeter, saw a blank screen with a tree panel on the left, and closed it again. It felt overwhelming.
If that sounds familiar…This article is for you.
I will walk you through everything from scratch. By the end, you will have a real working test running against a live website. No theory-only explanations. Just actual steps you can follow.
What is JMeter and Why Should You Care?
JMeter is a free tool that pretends to be many users at the same time.
Think about it this way. You build a website and it works perfectly when one person uses it. But what happens when 500 people open it at the same moment? Does it slow down? Does it crash? Does it return errors?
You cannot ask 500 real people to test your website at the same time. JMeter does that job for you. It creates virtual users, sends requests to your server, and measures how fast everything responds.
The best part? It is completely free and runs on any computer.
What We Will Build
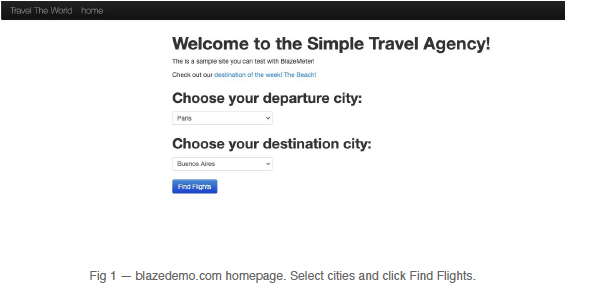
We will test blazedemo.com — a free demo travel website built specifically for performance testing practice.
Our test will simulate users doing this:
Step 1 → Open the homepage
Step 2 → Search for available flights
Step 3 → Go to the purchase page
We will run this flow with 10 virtual users at the same time and measure how the server responds.
How to Open JMeter
If you have JMeter installed, open your Terminal and type:
cd ~/Jmeter/apache-jmeter-5.6.3/bin
sh jmeter.sh
JMeter opens. You will see a blank screen with “Test Plan” in the left panel. That is your starting point.

Step 1: Add a Thread Group
The Thread Group is the heart of JMeter. It is where you tell JMeter how many fake users to create and how they should behave.
Right click on Test Plan in the left panel:
Right click Test Plan
→ Add
→ Threads (Users)
→ Thread Group
You will see a settings screen. Fill it in like this:
Number of Threads : 10    ← 10 virtual users
Ramp-Up Period    : 10    ← start all users over 10 seconds
Loop Count        : 1     ← each user runs the test once
Thread Group settings screen
One important thing about Ramp-Up. If you set it to 0, all 10 users start at the exact same moment. That is like 10 people all hitting a door at once instead of walking through one by one. Always set a ramp-up time — even 5 or 10 seconds makes a big difference for the server.
Step 2: Add Config Elements
Config elements are shared settings that apply to all your requests. You only set them once and every request uses them automatically.
Right click on Thread Group:
Right click Thread Group
→ Add
→ Config Element
Add these three:
HTTP Request Defaults This is where you type the website address once. All your requests will use it automatically — you do not have to repeat it every time.
Server Name: blazedemo.com
Protocol:    https
HTTP Cookie Manager Just add this — no settings needed. It works automatically in the background. Without it, JMeter forgets the login session after every request. With it, sessions stay alive just like a real browser.
CSV Data Set Config This reads data from a CSV file and gives each user different values. We will use it to give each user a different departure and destination city.
Create a file called flights.csv and put this inside:
fromPort,toPort
Paris,London
Boston,Dublin
Rome,Berlin
Chicago,Houston
Miami,Seattle
Denver,Phoenix
Dallas,Portland
Sydney,Singapore
Tokyo,Berlin
London,Paris
Then in CSV Data Set Config:
Filename       : /Users/yourname/Downloads/flights.csv
Variable Names : fromPort,toPort
Delimiter      : ,
Recycle on EOF : True
Sharing mode   : All threads
Step 3: Add a Transaction Controller
Right click on Thread Group:
Right click Thread Group
→ Add
→ Logic Controller
→ Transaction Controller
Name it: Full Flight Flow
The Transaction Controller groups your three requests together and measures the total time it takes to complete all of them. Without it, you can only see each page separately — not how long the whole journey takes.
This is what you report to a client. Not “the homepage took 400ms” — but “the complete booking flow took 1.5 seconds.”
Step 4: Add HTTP Requests
Right click on Transaction Controller and add three HTTP Requests:
Request 1 — Homepage
Name   : 01 - Homepage
Method : GET
Path   : /
Request 2 — Reserve
Name   : 02 - Reserve
Method : GET
Path   : /reserve.php
Then go to the Parameters tab and add:
Name: fromPort    Value: ${fromPort}
Name: toPort      Value: ${toPort}
Check the URL Encode checkbox for both. This handles city names with spaces like “New York” — without it you get an error.
Why do we add parameters here and not on the homepage? Because the homepage is just a form. When a real user clicks “Find Flights,” the city selection gets sent to the reserve page as URL parameters. JMeter skips the clicking part and sends the parameters directly.
Request 3 — Purchase
Name   : 03 - Purchase
Method : POST
Path   : /purchase.php
Step 5: Add a Timer
Right click on Thread Group:
Right click Thread Group
→ Add
→ Timer
→ Constant Throughput Timer
Target throughput : 60
Calculate Throughput based: All active threadsWithout a timer, JMeter sends requests as fast as it possibly can — hundreds per second. No real user ever clicks that fast. The timer makes JMeter slow down and behave like a real person.
Ramp-Up and Timer are two different things that people often confuse:
Ramp-Up = controls when users START
Timer   = controls how fast users CLICK
Ramp-Up runs once at the beginning.
Timer runs continuously throughout the test.Step 6: Add Assertions
An assertion checks that the server sent back the right page. Without it, JMeter counts even error pages as passed — which makes your results completely useless.
Right click on 01 — Homepage:
Right click → Add → Assertions → Response AssertionPattern Matching : Contains
Pattern : Welcome to the Simple Travel AgencyDo the same for the other two requests:
02 - Reserve  → Contains: Flights from
03 - Purchase → Contains: Your flight from
Notice we use “Flights from” and not “Flights from Paris to London.” City names are dynamic — they change based on what the CSV sends. If you write a specific city name the assertion will fail for any other city. Always use the part of the text that never changes.
Step 7: Add Listeners
Right click on Thread Group and add these:
→ Add → Listener → View Results Tree
→ Add → Listener → Aggregate Report
→ Add → Listener → Assertion Results
View Results Tree shows you each request one by one with a green or red icon. Use this only for small tests and debugging.
Aggregate Report shows your performance statistics. This is the one that matters.
Assertion Results shows which specific assertion failed and exactly why.
One important warning: never use Listeners in a large load test with hundreds of users. They save every single result into memory and JMeter can crash. For big tests, use command line mode instead — more on that later.
Step 8: Save and Run
Press Command + S and save as blazedemo_test.jmx.
Then click the green Play button at the top.

Test Structure
Watch View Results Tree. You should see green icons appearing for each request. Green means passed. Red means failed.

View Results Tree showing all green results
Step 9: Read the Results
Click on Aggregate Report. You will see a table with all your requests.

Aggregate Report with results
Here is what each column means:
Samples — how many requests were sent in total
Average — average response time in milliseconds
90% Line — the most important column. 90% of your users got a response within this time. This is more honest than the average because the average can be pulled up by a few very slow requests.
Error % — percentage of failed requests. This should be 0% or very close to it.
Throughput — how many requests the server handled per second.
Std. Dev. — how much the results varied. Low is good. High means inconsistent server behavior.
The golden rule is simple:
Throughput going UP + Deviation going DOWN = Healthy serverStep 10: Generate a Professional HTML Report
For real projects you do not use the GUI for large tests. You run JMeter from the command line and generate a proper HTML report that you can share with your team or client.
Close JMeter first. Then open Terminal:
cd ~/Jmeter/apache-jmeter-5.6.3/bin./jmeter -n -t blazedemo_test.jmx -l results.jtl -e -o reportThen open the report:
open report/index.html
HTML Report dashboard showing APDEX score and pass rate
The HTML report shows an APDEX score (a number from 0 to 1 showing overall performance quality), a pass/fail pie chart, and detailed statistics for every request. This is what you send to a client.
What the Numbers Mean
Here are the performance zones to know:
90th Percentile under 1000ms → Excellent
90th Percentile 1000-2000ms  → Acceptable
90th Percentile 2000-3000ms  → Warning
90th Percentile over 3000ms  → Serious problem
Industry standards by application type:
Banking applications → under 1 second
E-commerce sites     → under 2 seconds
News and blogs       → under 3 seconds
Internal tools       → under 4 seconds
What We Built — A Quick Summary

JMeter Complete Workflow
Let me quickly recap what each component does in our test:
Concurrency Thread Group — creates and manages 10 virtual users simultaneously
HTTP Request Defaults — stores blazedemo.com so we do not repeat it everywhere
HTTP Cookie Manager — keeps sessions alive between requests
CSV Data Set Config — gives each user a different city pair from our file
Constant Throughput Timer — controls the request speed to be realistic
Transaction Controller — measures the total time for the complete flow
HTTP Requests — the actual pages being tested
Response Assertions — verifies the right page came back
Aggregate Report — shows all the performance metrics
Common Mistakes to Avoid
Setting Ramp-Up to 0 All users start at the exact same moment. This is unrealistic and stresses the server in an unnatural way.
Not adding assertions Without assertions, JMeter marks error pages as passed. Your test looks green but nothing is actually being verified.
Forgetting URL Encode City names with spaces like New York cause a URL error. Always check the URL Encode box in your parameters.
Leaving Listeners on during large tests They fill memory and crash JMeter. Use command line for anything over 50 users.
Hardcoding test data 1000 users all searching the same flight is not realistic. Use CSV to give each user different data.
Final Thought
Performance testing sounds complicated before you start. But the basics are actually quite simple once you see them working.
The most important things to remember are: add a Timer so your test is realistic, add Assertions so you actually verify something, and read the 90th percentile column in Aggregate Report, not just the average.
Everything else you can learn as you go.
Start small. Run with 1 user first and make sure everything works. Then increase to 10, then 50, then more. Watch how the numbers change as the load increases. That is where performance testing gets interesting.
Good luck! 💪
Written by Cagatay Durmaz — Senior QA Automation Engineer
메타데이터
- post_id
- d5951e511a3f
- slug
- jmeter-complete-guide-d5951e511a3f
- url
- https://medium.com/@durmazcagatay/jmeter-complete-guide-d5951e511a3f
- canonical_url
- https://medium.com/@durmazcagatay/jmeter-complete-guide-d5951e511a3f
- author_url
- https://medium.com/@durmazcagatay
- status
- ok
- fetched_at
- 2026-07-10 01:40:30