Bitcoin Dominance at 56%: Why Alt Season Is Loading, Not Dead (July 2026)
Bitcoin dominance just hit 56%, and the crypto internet has already written alt season’s obituary. Every account with a chart is telling…
Bitcoin Dominance at 56%: Why Alt Season Is Loading, Not Dead (July 2026)
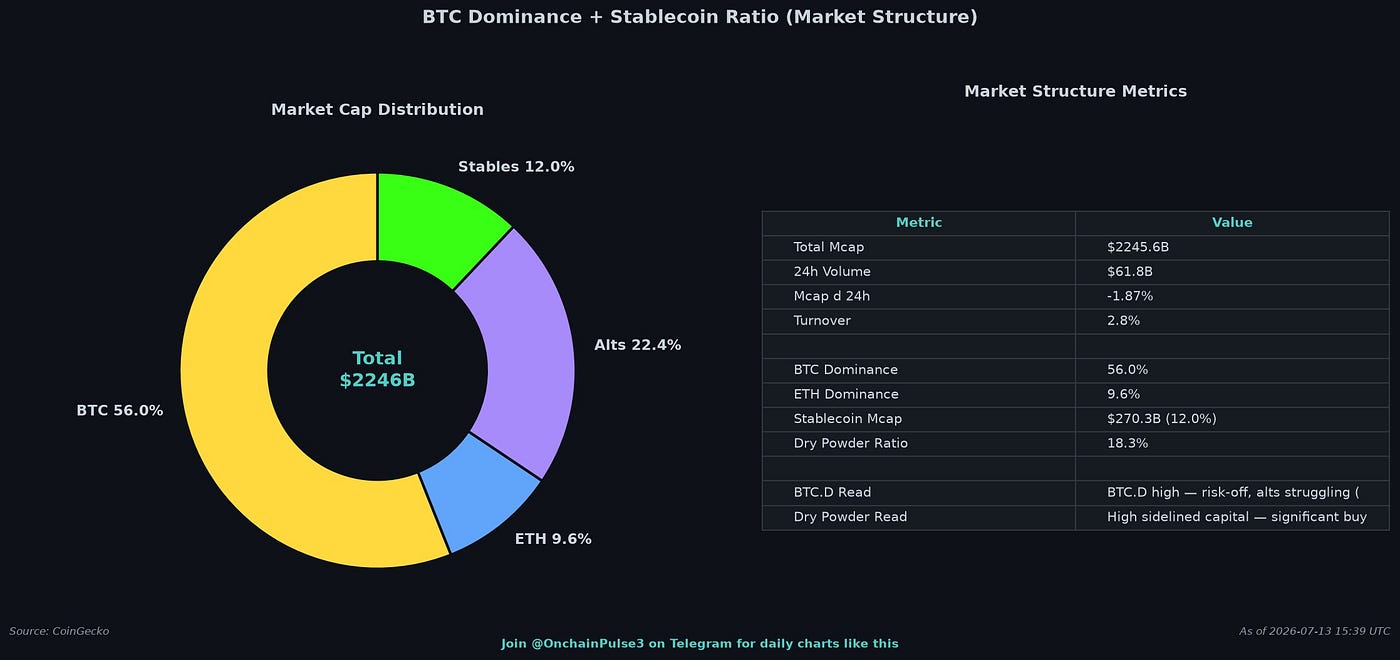
Bitcoin dominance just hit 56%, and the crypto internet has already written alt season’s obituary. Every account with a chart is telling you alts are dead, BTC is the only safe haven, and rotation into altcoins is a fantasy. They said the same thing in September 2019. They were wrong then, and the data says they’re wrong now. Here’s the number nobody is talking about: $270.4 billion in stablecoins is sitting on exchanges right now, representing 18.5% of the combined Bitcoin and Ethereum market cap. That’s not dead money. That’s dry powder. And historically, when Bitcoin dominance peaks, that dry powder rotates into altcoins with violent speed.
This article breaks down what Bitcoin dominance actually measures, why the 56% reading is a signal of alt season loading rather than dying, the historical precedent that makes the case, and the four on-chain metrics to track in real time. If you’ve been selling alts into this fear, you’re going to want to read this before you click another button.
What Bitcoin Dominance Actually Measures
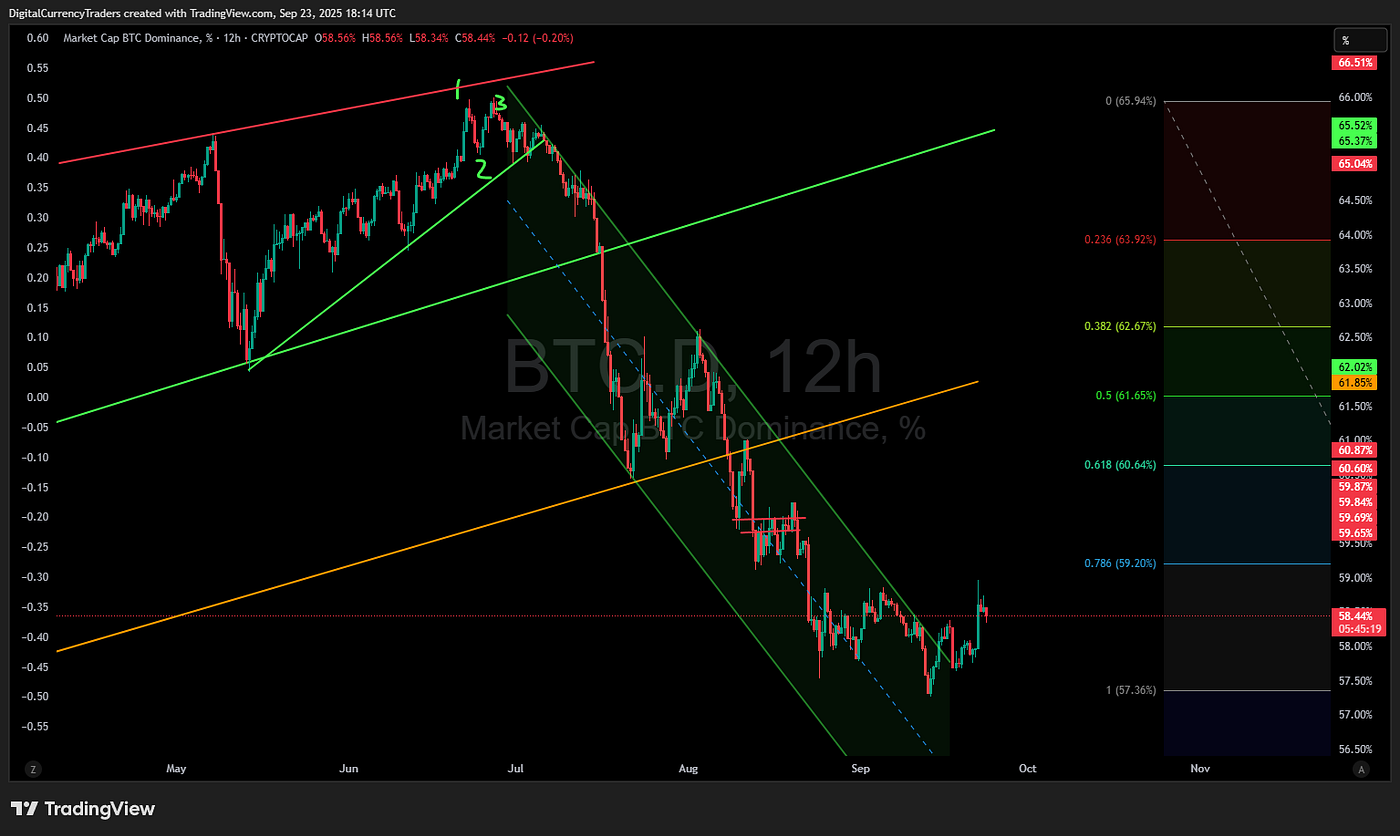
Bitcoin dominance is the percentage of total cryptocurrency market capitalization held by Bitcoin. At 56%, Bitcoin accounts for more than half of all crypto value. The conventional read is simple: high dominance means risk-off, capital is hiding in BTC, and altcoins are being punished. That read is correct as far as it goes. But it’s also incomplete, and the incompleteness is where the edge lives.
What dominance doesn’t tell you is where the rest of the capital is. And right now, the rest of the capital is increasingly in stablecoins. The stablecoin share of total crypto market cap has climbed to 12.1%, or $270.4 billion. That money hasn’t left crypto. It hasn’t been cashed out to fiat. It’s sitting on exchanges, in dollar-pegged tokens, waiting. The technical term is sidelined capital. The trader’s term is dry powder. And the ratio of that dry powder to the combined Bitcoin and Ethereum market cap — the dry powder ratio — is now 18.5%, the highest it’s been since the last cycle peak.
This is the number that changes everything. High Bitcoin dominance tells you where capital is hiding right now. High dry powder ratio tells you how much capital is positioned to deploy. And historically, those two readings peak at the same moment — right before capital rotates.
The September 2019 Precedent: What Happened Last Time
The closest historical parallel to today’s setup is September 2019. Bitcoin dominance had climbed to 57% after a brutal altcoin correction. The dominant narrative on Crypto Twitter was that alt season was dead, DeFi was a bubble that had popped, and Bitcoin was the only crypto worth holding. The sentiment was indistinguishable from today.
What happened next is now history. Over the following ten months, Bitcoin dominance declined from 57% to a low of 40% as capital rotated out of BTC and into altcoins. DeFi Summer exploded. Chainlink went from $1.50 to $20. Aave went from $30 to $600. Yearn Finance went from launch to $40,000 in three months. The people who had declared alt season dead in September 2019 spent the summer of 2020 buying back in at five to twenty times the prices they could have paid.
The parallel isn’t perfect. Every cycle has differences. But the structural setup is the same: high Bitcoin dominance, elevated dry powder ratio, widespread capitulation in altcoin sentiment, and a narrative that says rotation is impossible. Those four conditions have preceded every alt season in crypto history. They’re all present right now.
Why Dominance Falls: The Mechanics of Rotation
Here’s the part that most analysts miss, and it’s the key to the whole thesis. Bitcoin dominance doesn’t fall on its own. It doesn’t decline because Bitcoin goes down. It declines because capital rotates from Bitcoin into altcoins, and altcoins rise faster than Bitcoin, shrinking Bitcoin’s share of the total market cap.
That rotation requires fuel. The fuel is sidelined capital — stablecoins sitting on exchanges, waiting to be deployed. When the dry powder ratio is high, the fuel for rotation is abundant. When Bitcoin dominance is also high, the conditions for rotation are optimal, because capital has already concentrated in BTC and is looking for higher-beta opportunities. The spark that ignites the rotation varies — sometimes it’s a narrative, sometimes a catalyst, sometimes just exhaustion of BTC’s momentum. But the fuel has to be there first, and right now, the fuel is there in quantities not seen since 2019.
The dry powder ratio of 18.5% means that for every dollar currently in Bitcoin and Ethereum, there are 18.5 cents sitting in stablecoins ready to buy. That’s a massive amount of buying power positioned on the sidelines. It doesn’t all rotate at once. But when the rotation starts, it compounds — because altcoin pumps draw more sidelined capital off the bench, which pumps altcoins further, which draws more capital, and so on. That’s how alt seasons happen. That’s how they’ve always happened.
The Four Signals to Track Daily
If you want to catch the rotation in real time, there are four metrics to watch every morning. First, Bitcoin dominance — when it starts declining from a peak, rotation has begun. Second, the dry powder ratio — when it starts declining, sidelined capital is deploying. Third, total stablecoin supply on exchanges — when it shrinks, capital is being spent on crypto. Fourth, altcoin season index — when it climbs above 75, the rotation is confirmed. Right now, dominance is peaking, dry powder is at cycle highs, stablecoin supply is flat, and altcoin season index is low. The setup is loaded. The trigger hasn’t been pulled.
I publish a daily 60-second morning brief covering all four signals at @onchainpulse3 on Telegram, and the @Onchainpulse1_bot delivers the six core charts automatically every morning along with 40+ free on-chain tools — whale tracking, DEX scanners, smart money alerts, and contract audits. The bot exists because tracking these signals manually takes 20 minutes a day, and the difference between catching the rotation on day one versus day thirty is the difference between a 5x and a 1.5x. In a market this loaded with dry powder, that difference matters.
The Bottom Line
Bitcoin dominance at 56% is not the death of alt season. It’s the loading screen. $270.4 billion in stablecoin dry powder is not dead money. It’s the fuel for the next rotation. The September 2019 parallel is not a coincidence. It’s the structural pattern that has preceded every alt season in crypto history. The crowd is writing obituaries. The data is loading ammunition. Listen to the data.
Disclaimer: This article is for informational purposes only and does not constitute financial advice. Crypto is volatile. Always do your own research and never invest more than you can afford to lose.
메타데이터
- post_id
- d5bde183249c
- slug
- bitcoin-dominance-at-56-why-alt-season-is-loading-not-dead-july-2026-d5bde183249c
- url
- https://digitalcurrencytraders.com/bitcoin-dominance-at-56-why-alt-season-is-loading-not-dead-july-2026-d5bde183249c
- canonical_url
- https://digitalcurrencytraders.com/bitcoin-dominance-at-56-why-alt-season-is-loading-not-dead-july-2026-d5bde183249c
- author_url
- https://medium.com/@onchainpulse3
- status
- ok
- fetched_at
- 2026-07-17 01:21:55