From small talk to shared stories: Building a weather dashboard for distributed teams
How our team turned a heatwave into a daily sync tradition using four of Grafana Cloud’s coolest dashboarding features.
From small talk to shared stories: Building a weather dashboard for distributed teams
How our team turned a heatwave into a daily sync tradition using four of Grafana Cloud’s coolest dashboarding features.
It all started with small talk.
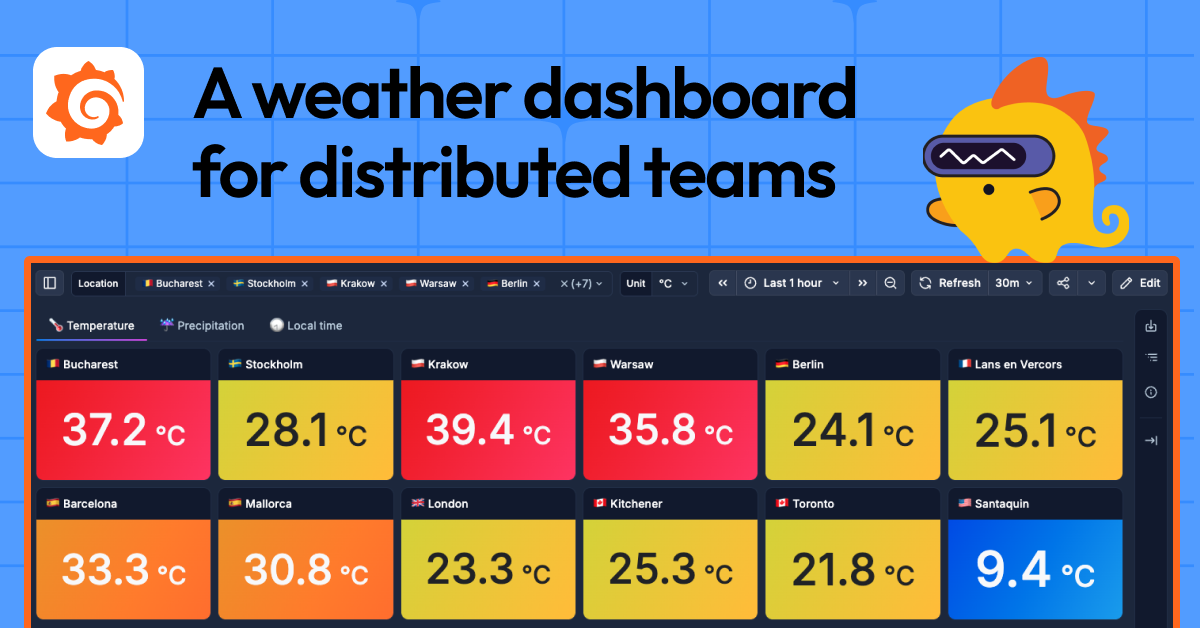
The engineering team I work on at Grafana Labs is spread across 12 locations, 9 countries, and two continents, spanning everything from big capital cities to my tiny village in the French Alps. When everyone’s day starts at a different hour, “How’s the weather?” stops being just filler conversation; it’s genuinely interesting to hear everyone’s different responses on the call.
This was especially true starting last month, when temperatures became extreme. While one teammate in Santaquin had the heating on with unusually cold days, another in Krakow was seeing temps reach as high as 39°C/103°F. Bucharest, meanwhile, hit 37°C/99°F, while Kitchener and the French Alps stayed around 25°C/77°F.
Same planet, same Monday, wildly different climates.
I saw an opportunity to build a Grafana Cloud dashboard to capture these differences. Now in our daily syncs, we open this dashboard and rely on its green-to-red color scale to kickstart the storytelling for us.

This is a single snapshot in time, but across two continents, it’s not the same time. When it’s incredibly hot in mid-afternoon in Europe, it’s barely 7–9 AM for our teammates in the US and Canada.
How to build it
The dashboard happens to show off four of Grafana Cloud’s coolest features: multi-property variables, repeat panels, tabs, and show/hide rules.
1. One variable, many properties
The heart of the dashboard is a single **Location variable, but it’s not just a list of names. Each entry carries its own bundle of data: the display name (with a flag emoji, because why not), plus the latitude and longitude** needed to fetch that location’s weather.
A custom variable where each location carries its own latitude and longitude looks like this:
[
  { "value": "🇫🇷 Lans en Vercors", "latitude": 45.1167, "longitude": 5.5833 },
  { "value": "🇩🇪 Berlin",          "latitude": 52.5200, "longitude": 13.4050 },
  { "value": "🇪🇸 Barcelona",       "latitude": 41.3874, "longitude": 2.1686 },
  { "value": "🇸🇪 Stockholm",       "latitude": 59.3293, "longitude": 18.0686 }
  // ...one entry per teammate's location
]
Before multi-property variables, you’d have to juggle three parallel variables (one for names, one for latitude, and one for longitude) and simply hope the indexes stayed aligned, or crammed the URL param into a value for the variable (e.g. longitude=5.5833&latitude=45.1167). Now a single selection gives you everything neatly: ${location} for the label, ${location.latitude} and ${location.longitude} to query the weather API. One source of truth, no fragile bookkeeping.
Why it matters: Multi-property variables turn a variable from “a list of strings” into “a list of little objects.” Anywhere you have entities with attached metadata, such as regions, hosts, customers, or stores, this collapses a pile of glue into one clean definition.
Pro tip: Use Grafana Assistant to add new locations.The AI-powered assistant will pull in everything for you, from coordinates to country emojis, so it only takes a few seconds!
2. Repeat panels: one location, then 12 (or more)
I designed exactly one stat panel per tab — title ${location}, value bound to that location’s temperature. Then I set it to repeat over the location variable.
Grafana stamps out a copy per selected location automatically. Add a teammate? Add one line to the variable. The grid grows itself. Delete the variable selection down to three locations and you get a tidy three-panel view. I never touch panel #2 through #12.
Why it matters: Repeating panels keep your dashboard DRY. You maintain one panel, not 12, and the layout scales with your data.
3. Tabs: three views, zero clutter
Temperature is only part of the story. Rather than cram everything onto one screen or build three dashboards, I used the new tabs layout to split the views:
🌡️ Temperature tab: the heatwave board above
🌧️ Precipitation tab: same locations, but who’s getting rained on
🕒 Local time tab: what the clock actually reads in each office
Same variable, same repeat logic, three clean contexts. Tabs let a single dashboard hold multiple narratives without making anyone scroll through noise to find the bit they care about.
Why it matters: tabs give you progressive disclosure, creating one dashboard that tells multiple stories.
4. A unit toggle with show/hide rules
Here’s the one that settled a recurring argument: whether to track temperature in Celsius or Fahrenheit.
I added a second variable, **Unit, with two options: °C and °F. Then I used show/hide rules** to conditionally render the right panels: when Unit is °C, the Celsius panels show and the Fahrenheit ones hide, and vice versa. This shows the proper value, unit, and thresholds.
Why it matters: show/hide rules let a single dashboard adapt to who’s looking at it — different units, different roles, different detail levels — without forking it into copies. The dashboard meets each viewer where they are.
Steal this idea
Looking ahead, I cannot wait for winter to use the second tab to compare my snow precipitations to teammates in Canada.
Interested in trying it out for yourself? The pattern above (one rich variable → repeating panels → tabs → show/hide rules) works for a variety of use cases:
- Service health per region
- Revenue per store
- Build status per repo
- CO₂, air quality, daylight hours… whatever sparks a conversation
You can export the JSON from Grafana Play and drop in your own locations. And remember: the best dashboards are always the ones that tell a story, or strike up a conversation.
메타데이터
- post_id
- d7f44df8ef45
- slug
- from-small-talk-to-shared-stories-building-a-weather-dashboard-for-distributed-teams-d7f44df8ef45
- url
- https://medium.com/grafana-labs/from-small-talk-to-shared-stories-building-a-weather-dashboard-for-distributed-teams-d7f44df8ef45
- canonical_url
- https://medium.com/grafana-labs/from-small-talk-to-shared-stories-building-a-weather-dashboard-for-distributed-teams-d7f44df8ef45
- author_url
- https://medium.com/@yaelleC
- status
- ok
- fetched_at
- 2026-07-11 04:02:42