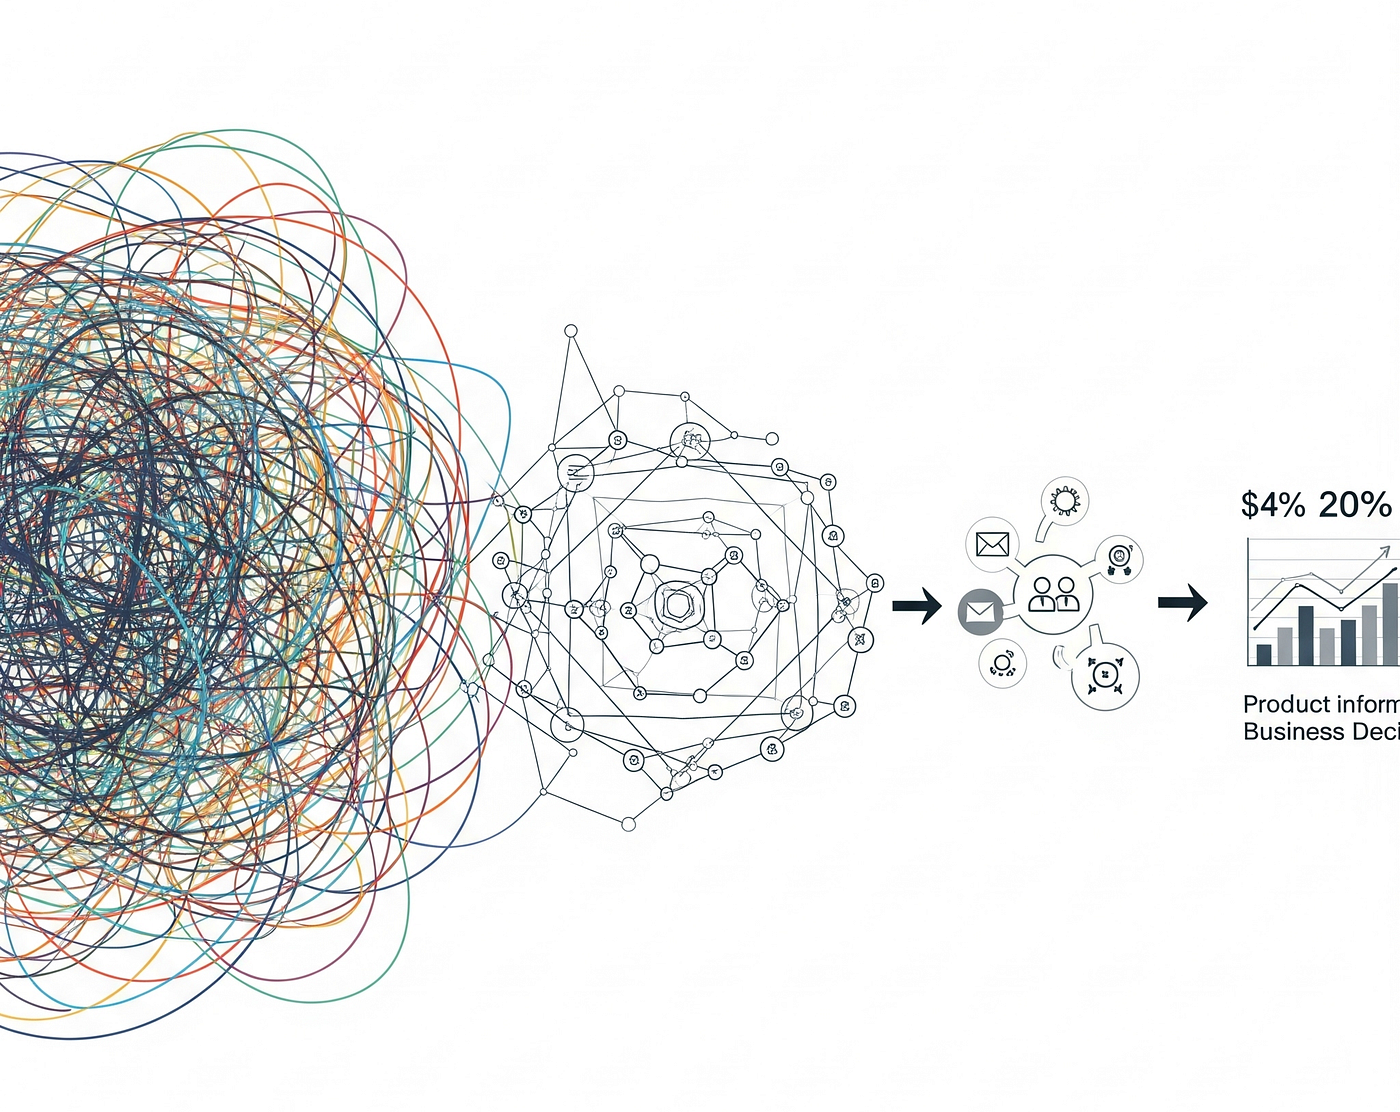
SQL for Business Intelligence Dashboards: How SQL queries form the backbone of interactive…
Bridging Raw Data and Strategic Visualizations
SQL for Business Intelligence Dashboards: How SQL queries form the backbone of interactive dashboards and reports
Bridging Raw Data and Strategic Visualizations
Business Intelligence (BI) dashboards and reports are indispensable tools. They transform raw, disparate data into actionable insights, empowering organizations to make informed decisions, identify critical trends, and meticulously track performance. But peel back the layers of slick visualizations and intuitive interactive filters, and you’ll uncover the true powerhouse behind it all: SQL (Structured Query Language).

SQL is far more than just a querying language; it’s the fundamental dialect through which BI platforms communicate with databases. It’s responsible for retrieving, manipulating, and aggregating the vast oceans of information that fuel these powerful tools. Without robust, optimized, and intelligently designed SQL queries, even the most sophisticated BI platforms would be nothing more than empty, static shells.
How SQL Feeds the Dashboard
Think of a BI dashboard as a highly advanced control panel for your business. Every dial, gauge, chart, and table represents a specific metric or trend crucial for understanding operations. To populate these dynamic visualizations, the dashboard desperately needs data, and that’s precisely where SQL steps in.
Let us check how SQL queries form this crucial foundational layer:
- Precise Data Extraction: SQL’s primary role is to extract exactly the right data from potentially numerous and varied source systems. This could involve pulling daily sales figures from an Enterprise Resource Planning (ERP) system, analyzing website traffic patterns from a web analytics database, or retrieving detailed customer demographics from a Customer Relationship Management (CRM) system. SQL’s
SELECTstatements, meticulously combined withFROMandWHEREclauses, are the architects that define what data is needed and from where it should originate. - Structured Data Delivery: Ultimately, SQL structures the processed data into a format that the BI tool can effortlessly interpret and visualize. This almost always means returning result sets that resemble clean, organized tables, with clearly defined columns and rows that directly map to the dashboard’s specific visualization requirements.
- Robust Data Transformation and Cleansing: Raw data, fresh from its source, is almost never in a perfect state for direct visualization. SQL excels at transforming, refining, and cleaning this data, making it suitable for analysis. This critical process includes:
- Aggregation: Summarizing vast datasets into meaningful metrics. Common aggregations performed directly within SQL include calculating
SUM()of sales by region, determining theAVG()customer lifetime value, or preciselyCOUNT()ing unique website visitors. These operations frequently leverage theGROUP BYclause to segment data and theHAVINGclause to filter aggregated results. - Filtering: Focusing on specific subsets of data is essential for targeted insights. This is expertly achieved using
**WHEREclauses** to filter by criteria like specific time periods, particular product categories, or distinct customer segments. - Joining Data from Disparate Sources: Combining related data from multiple tables (e.g., matching customer information with their order details to understand purchasing habits) is a fundamental aspect of creating comprehensive, holistic insights. This is seamlessly handled by SQL’s powerful
**JOINclauses** (such asINNER JOIN,LEFT JOIN,RIGHT JOIN, andFULL OUTER JOIN), which define how tables relate to each other. - On-the-Fly Calculations: Creating new derived metrics that aren’t stored directly in the database is a common requirement. SQL allows for the creation of calculated fields directly within the query, such as computing profit margins (
(revenue - cost) / revenue) or conversion rates. - Data Type Conversion: Ensuring that data is in the correct format (e.g., converting text fields to numerical values or standardizing date formats) for proper display or subsequent calculations is another vital SQL capability.
Interactive Dashboards: SQL’s Dynamic Role in Real-Time Insights
The true allure and immense power of modern BI dashboards lie in their interactivity. Users aren’t just passive viewers; they can actively slice and dice data, drill down into granular details, apply various filters, and explore insights from countless angles. This dynamic, responsive behavior is almost entirely orchestrated by the rapid re-execution and modification of SQL queries.

When a user interacts with a dashboard element — for instance, clicking on a specific region on a sales map, selecting a custom date range, or applying a product category filter — the BI tool doesn’t merely shuffle around pre-loaded data. Instead, it dynamically generates and executes a new SQL query (or intelligently modifies an existing one) to retrieve the updated, refined dataset that reflects the user’s current selection.
Let’s explore common interactive scenarios and how SQL dynamically facilitates them:
- Filtering Data: When a user selects “North America” from a region filter, the BI tool intelligently modifies the underlying SQL query to include a
**WHERE region = 'North America'** clause, instantly narrowing the focus of all relevant visualizations. - Drill-Down Capabilities: Clicking on a high-level sales figure for a particular month might trigger a new, more granular SQL query. This query could fetch daily or even hourly sales data for that specific month, effectively adding more granular
**GROUP BYclauses or more detailed `WHERE`** conditions to the original query. - Parameterization for Customization: Many advanced dashboards allow users to input specific values (e.g., a particular customer ID, a desired sales target, or a budget threshold). These user-defined parameters are then seamlessly incorporated directly into the SQL query, making the dashboard highly customizable and adaptable to individual analytical needs.
- Dynamic Time Series Analysis: Changing the time granularity of a report (e.g., switching from quarterly to monthly, or monthly to daily views) involves dynamically modifying the
**GROUP BY** clauses and date-related functions within the SQL query, instantly re-rendering the time series charts.
This continuous, real-time interplay between user interaction and dynamic SQL query execution is the very essence of what makes modern BI dashboards so incredibly powerful, responsive, and indispensable for agile decision-making.
The Profound Benefits of Strong SQL for BI
Investing in well-crafted, optimized SQL queries for your BI initiatives offers a multitude of significant advantages that directly impact business performance:
- Accuracy and Consistency: SQL provides a single source of truth. By defining the data retrieval and transformation logic consistently and centrally, you guarantee that all dashboards, reports, and analyses display accurate, reliable, and comparable information across the organization.
- Superior Performance and Responsiveness: Optimized SQL queries are absolutely critical for fast-loading, responsive dashboards. Slow-performing queries lead to frustrated users, delayed insights, and ultimately hinder agile decision-making. Employing techniques like proper indexing, efficient joins, and avoiding unnecessary complex subqueries are paramount for achieving rapid data retrieval.
- Exceptional Flexibility and Customization: SQL’s inherent versatility allows BI developers to precisely tailor queries to very specific, unique business requirements. This enables the creation of highly customized dashboards that perfectly meet nuanced user needs and provide targeted insights.
- Enhanced Scalability: As an organization’s data volumes inevitably grow, well-structured and efficiently written SQL queries are far more likely to scale effectively. This prevents performance bottlenecks and ensures that your BI infrastructure can handle increasing data loads without significant re-architecture.
- Improved Maintainability and Collaboration: Clear, well-commented, and logically organized SQL queries are significantly easier to understand, debug, and maintain. This reduces the effort required for future updates, enhancements, and troubleshooting, fostering better collaboration among data teams.
- Cost-Effectiveness: Effectively leveraging existing database infrastructure and in-house SQL expertise can be a highly cost-effective approach compared to relying solely on expensive, proprietary data manipulation tools or requiring extensive data duplication.
Essential Best Practices for SQL in BI Dashboards
To truly unlock the full potential of SQL in your business intelligence initiatives, adhering to these best practices is crucial:

- Deeply Understand Your Data Model: A profound understanding of your source database schema, table relationships, primary keys, and foreign keys is the absolute foundation for writing effective, accurate, and efficient SQL queries.
- Leverage Common Table Expressions (CTEs): Using
**WITHclauses** for CTEs significantly enhances the readability, modularity, and maintainability of complex SQL queries by breaking them down into logical, named sub-queries. - Design for Parameterization: Build your SQL queries to inherently accept parameters from the BI tool. This is fundamental for enabling the interactive filtering, drill-down, and customization features that users expect.
- Version Control Your SQL Code: Treat your SQL queries as valuable code assets. Store them in a version control system like Git to track changes, collaborate effectively, and revert to previous versions if needed.
- Thoroughly Document Your Queries: Add clear, concise comments within your SQL code to explain complex logic, assumptions made during data transformation, and dependencies on specific source tables or business rules.
- Rigorously Test All Queries: Extensively test your SQL queries with various data scenarios, edge cases, and different parameter inputs to ensure they return accurate and expected results under all conditions.
- Continuous Monitoring and Tuning: Dashboard performance isn’t a “set it and forget it” task. Continuously monitor query execution times and dashboard load times. Use database performance tools to identify and further optimize any slow-performing queries.
- Ruthlessly Optimize for Performance:
- Strategic Indexing: Ensure that appropriate indexes are created on columns that are frequently used in
WHEREclauses,JOINconditions, andORDER BYclauses. - Select Only What’s Necessary: Always avoid the lazy
**SELECT ***. Explicitly list only the specific columns that are genuinely required for your dashboard or report. - Efficient Join Types: Choose the correct
JOINtype (INNER JOIN,LEFT JOIN, etc.) for your specific need, and ensure that the columns used in yourJOINconditions are appropriately indexed. - Minimize Subqueries: While useful, deeply nested subqueries can sometimes be less efficient. Explore alternatives like
**JOINs or Common Table Expressions (CTEs)** where they offer better performance and readability. - Filter Data Early: Apply
**WHEREclauses** as early as possible in the query execution plan. This significantly reduces the size of the dataset that subsequent operations (like joins or aggregations) need to process.
The allure of Business Intelligence dashboards often lies in their visually appealing charts and intuitive interactivity, it’s the humble yet incredibly powerful SQL that truly makes it all possible. SQL queries are the diligent workhorses that tirelessly extract, transform, and deliver the precise data needed, acting as the intelligent, dynamic bridge between raw information and actionable, insightful visualizations.
For anyone involved in the world of business intelligence, from data analysts and BI developers to business users who want to truly understand the data driving their reports, a strong, foundational understanding of SQL is not merely beneficial, but absolutely essential. It is, without a doubt, the unsung hero that truly empowers data-driven decision-making in the modern enterprise.
메타데이터
- post_id
- d8d06100e16f
- slug
- sql-for-business-intelligence-dashboards-how-sql-queries-form-the-backbone-of-interactive-d8d06100e16f
- url
- https://medium.com/@vishnutr/sql-for-business-intelligence-dashboards-how-sql-queries-form-the-backbone-of-interactive-d8d06100e16f
- canonical_url
- https://medium.com/@vishnutr/sql-for-business-intelligence-dashboards-how-sql-queries-form-the-backbone-of-interactive-d8d06100e16f
- author_url
- https://medium.com/@vishnutr
- status
- ok
- fetched_at
- 2026-07-27 13:21:04