Data as a habit
There’s a version of this story I told recently about a distributor placing an order on a Friday afternoon. A phone call, a standard order…
Data as a habit
There’s a version of this story I told recently about a distributor placing an order on a Friday afternoon. A phone call, a standard order size, an invoice, five working days, stock arrives, shelf’s full again. Repeat for a year and you’ve run a working supply chain — cash-based, relationship-based, and almost entirely blind to itself.
The fix isn’t a better app. It’s a habit: capture the same fields, the same way, every single time, for long enough that a pattern can exist. Once you commit to that, something interesting happens — the habit doesn’t just improve one side of a distributor’s business. It improves both sides at once, because a distributor sits in the middle of two flows that are usually managed as if they have nothing to do with each other: what comes in, and what goes out.
The supply side
This is the manufacturer-facing half of the business — buying, receiving, paying.
Order timing and lead time. Every order logged, every delivery logged against it, gives you the one number nobody writes down: how long this specific SKU, from this specific manufacturer, actually takes to arrive. Not “about five days” — the real distribution, including the outlier week it took nine.
What it enables: a prompt to reorder before the shelf empties, timed to the actual lead time rather than a guess.
Buy price and fill rate. Capture what you paid, every time, and whether the manufacturer delivered the full order or shorted you. Buy prices move with season and negotiation. Fill rates tell you which suppliers you can actually rely on when it matters.
What it enables: a true landed cost per SKU, and an early warning when a supplier’s reliability is slipping — before it becomes a stockout you didn’t see coming.
Payment terms and working capital. When you pay against 30-day invoice terms, capturing that cycle alongside sellout tells you something most distributors never calculate: whether you’re selling the stock before the invoice is due, or funding your supplier’s balance sheet with your own cash.
What it enables: a working capital view, SKU by SKU — which products the business finances comfortably, and which ones are quietly bleeding cash flow.
The demand side
This is the retailer-facing half — what actually moves, and to whom.
Sellout rate. Not “we sold a ton eventually” but the actual velocity, by SKU, by week, by season. This is the number that turns a standard order size into a right-sized one.
What it enables: an order quantity recommendation instead of a habit — order what the data says you’ll sell before the next delivery, not what you ordered last time.
Returns, damage, and waste. Captured honestly, not hidden. A SKU with a high sellout rate but high wastage isn’t actually the product you think it is.
What it enables: a true margin per SKU — not list price minus buy price, but what’s left after the stock that never made it to a paying customer.
Price and promotion response. Every time a price moves — yours or a competitor’s — and you log what happens to sellout, you’re building an elasticity curve one data point at a time. Most distributors have a gut feel for this. Very few have the data.
What it enables: a promotion that’s sized to actually shift volume, instead of a discount applied on instinct.
Channel and customer mix. The same SKU sells differently to a corner kiosk than to a mid-size wholesaler down the road. Capturing who bought what, not just what sold, is the difference between one sellout number and a map of where demand actually concentrates.
What it enables: a next-best-customer prompt — who to call first when new stock lands, based on who actually moves it fastest.
Predict, then prescribe
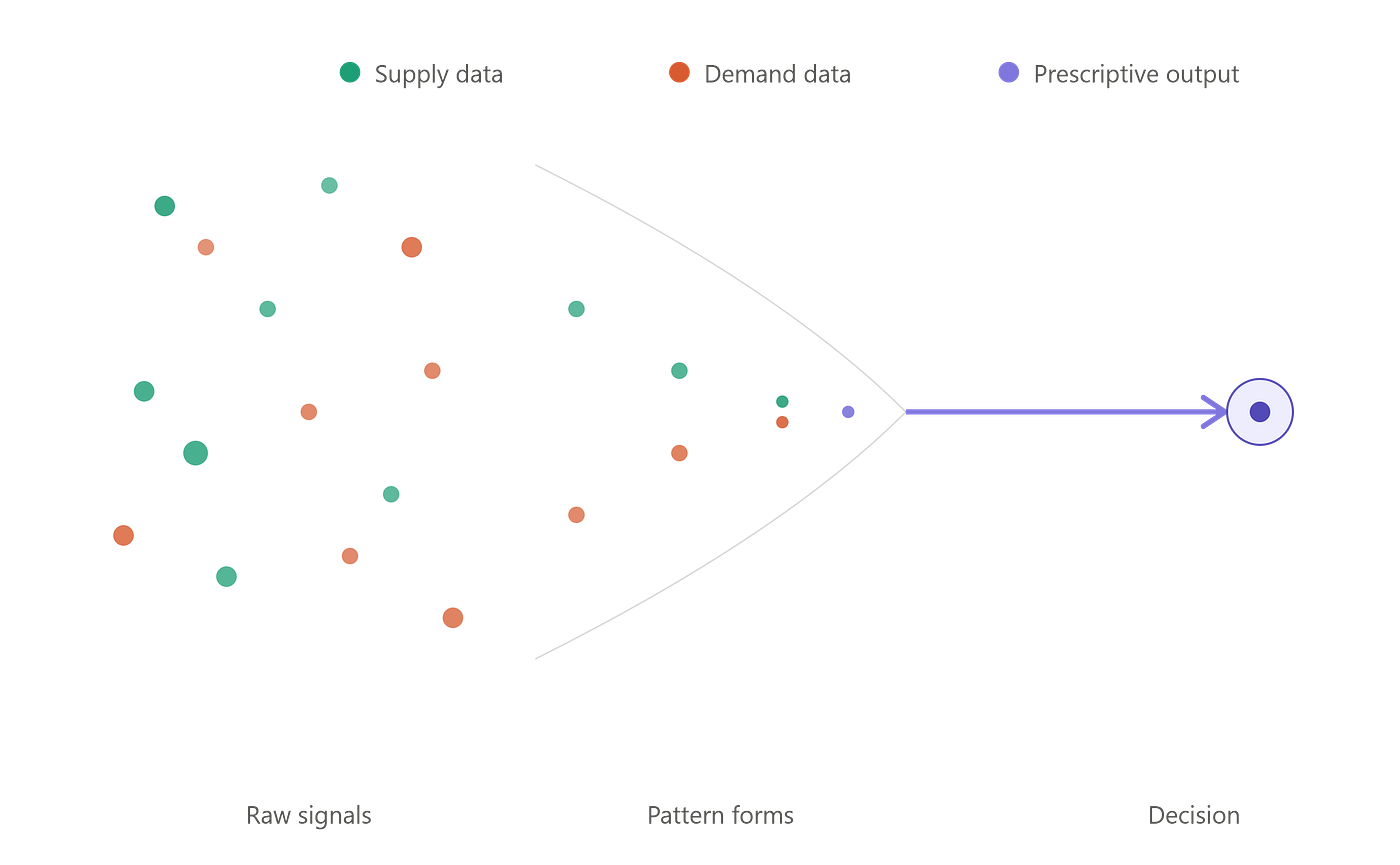
Once both sides are logging the same fields the same way, the system moves through two distinct stages — and it’s worth being precise about which is which, because they get conflated constantly.
Predict is pattern-finding. A year of orders and a year of sellout, sitting in the same place, start showing you things nobody typed in on purpose: this SKU’s lead time actually clusters around six days, not five. This SKU’s sellout doubles every December. This supplier’s fill rate drops every time you order more than 800 units. Nobody decided any of that — the pattern was always there, waiting for enough repeated, consistent data to surface it.
Prescribe is what you do with the pattern. Not “here’s a chart” — a decision, handed to the person who needs it, at the moment they need it: reorder this SKU now, order this quantity, expect this margin, flag this supplier before the next order goes out. Prediction tells you what’s true. Prescription tells you what to do about it.
And here’s the part worth saying plainly, because it cuts against the hype: it’s not AI, stupid — it’s arithmetic. Lead time, sellout rate, margin, reorder point — none of that is a novel algorithm. It’s addition, division, and a moving average. The reason nobody was doing this ten years ago wasn’t that the maths was hard. It’s that nobody had the data captured consistently enough to do the maths on, and not enough cheap compute sitting close enough to the field to run it in real time, at the scale of every SKU, every retailer, every day. #compute
That’s changed. The compute is here. The models are here. What’s still missing, in most distributor businesses, is the habit that feeds them.
Where it compounds
None of these examples are impressive on their own. A lead time. A sellout rate. A fill rate. Individually, they’re just fields in a form.
The compounding happens when supply-side data and demand-side data sit in the same system and start talking to each other. Buy price plus sellout price is real ROI, per SKU, for the first time. Lead time plus sellout rate is a reorder point that’s actually correct instead of a guess dressed up as a policy. Fill rate plus channel mix tells you which supplier relationships are worth protecting when stock is tight and someone has to go without.
That’s the intelligence layer — not a separate feature bolted on top, but the direct output of two habits running in parallel long enough to intersect.
The part everyone skips
Every company wants the prescription. Very few want to do the eighteen months of unglamorous, occasionally boring work of logging the same fields, the same way, on both sides of the ledger, before the prescription is even possible.
AI doesn’t replace that work. It’s useless without it. The model doesn’t know your lead time — you gave it that, one logged delivery at a time. It doesn’t know your margin — you gave it that too, one recorded sale at a time on one side and one recorded invoice on the other.
The moat was never the algorithm. It’s the habit underneath it — and it has to run on both sides of the business, or it isn’t a habit, it’s a half-measure.
Build the habit. On both sides. The intelligence comes free.
This continues a thread from The human in the loop: what AI cannot do without — on why the last mile of FMCG has to be built by hand before it can be built with AI.
메타데이터
- post_id
- d962400a9dec
- slug
- data-as-a-habit-d962400a9dec
- url
- https://medium.com/@justin2908/data-as-a-habit-d962400a9dec
- canonical_url
- https://medium.com/@justin2908/data-as-a-habit-d962400a9dec
- author_url
- https://medium.com/@justin2908
- status
- ok
- fetched_at
- 2026-08-08 17:02:39