SIGTERM Doesn’t Mean “Stop”
What we learned rebuilding liveness, readiness and graceful shutdown for a high-throughput payments authorization service
SIGTERM Doesn’t Mean “Stop”
What we learned rebuilding liveness, readiness and graceful shutdown for a high-throughput payments authorization service
For years, our payment authorization service had exactly one health endpoint:
GET /health → 200 OKIt pinged the database, returned some JSON, and Kubernetes used it for both the liveness probe and the readiness probe. It looked fine. It passed code review. It ran in production across many regions.
It was also the root cause of two entire classes of incident: a 40-second database blip that we amplified into a multi-minute outage, and a steady trickle of failed requests on every single deploy — on a service where a failed request means someone’s card got declined at a checkout.
This post is the design we replaced it with: a dedicated health listener, three distinct probe contracts, a loopback prober, a circuit breaker for zombie pods, and a choreographed shutdown sequence.
It’s also, honestly, a post about being wrong. While fact-checking this article against our own source code, I found two real bugs in the shutdown path I was about to hold up as an example. They’re in Part 6. Finding them is the most useful thing this post did, and I’ve left them in rather than quietly fixing the prose, because how they hid is the actual lesson.
I’ve written this for two audiences. If you’re early in your career, Parts 1–3 give you the mental model — what liveness and readiness actually mean and why they are not the same question. If you’re experienced, the interesting parts are 4 through 6: the circuit-breaker arithmetic, the ordering of the shutdown sequence, and the two bugs.
Part 1: Two incidents that look unrelated but aren’t
Incident A: the database sneezed, so we restarted every pod
One afternoon the primary database had a brief failover — roughly 40 seconds of elevated errors. Annoying, but survivable. A well-behaved service degrades, retries, and recovers.
Instead:
/healthpings the database. Database unreachable./healthreturns 500.- The liveness probe points at
/health. It fails three times in a row. - Kubernetes concludes the container is broken and kills it.
- The pod restarts: cold process, empty connection pools, cold caches.
- It comes back, immediately tries to connect to the same sick database, fails again.
- Repeat. Across every pod. Simultaneously.
A 40-second dependency blip became a multi-minute outage, and the restart storm piled reconnection load onto a database that was already struggling. We amplified the incident we were trying to survive.
The bug isn’t in the database. The bug is in the sentence “the liveness probe points at /health, and /health checks the database."
Incident B: every deploy dropped requests
Separately, every rollout produced a small spike of 5xx errors. Small enough to shrug at in a dashboard. Large enough that on a card-authorization path it meant real declined transactions.
What was happening:
- Kubernetes sends
SIGTERMto the pod. - Our process sees
SIGTERMand immediately starts shutting down the HTTP server. - Meanwhile, Kubernetes is still telling the rest of the cluster that this pod is gone.
That third step deserves unpacking, because it’s the crux and it’s usually glossed over. Kubernetes keeps a list of the pod IPs sitting behind each Service. Every node in the cluster caches its own copy of that list, and so does every sidecar proxy if you run a service mesh. Removing a pod means updating all of those copies, one at a time, across the cluster. (The list object is called an EndpointSlice; the per-node component that rewrites routing rules from it is kube-proxy.) That propagation takes hundreds of milliseconds — sometimes seconds.
So for a brief window, load balancers are still confidently sending traffic to a pod that has already stopped accepting connections. Connection refused → 502/503.
The fix is counterintuitive, and it’s the single most important idea in this post:
*SIGTERM** does not mean "stop serving." It means "start telling Kubernetes you're not ready, and keep serving until it believes you."***
Both incidents come from one root cause: we used one signal to answer three completely different questions.
Part 2: Three questions, not one
Kubernetes doesn’t have a “health check.” It has three probes, and each asks a different question with a different consequence.
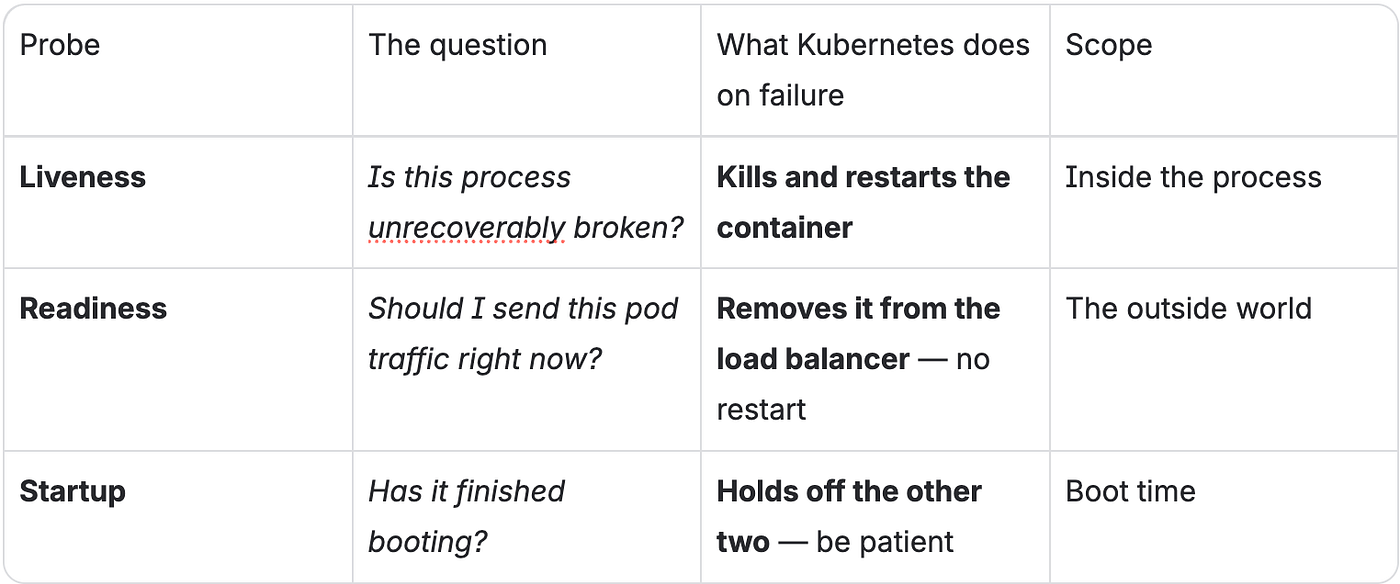
Sit with the third column, because that’s the whole game:
- Liveness failure = a restart. Restarts are violent. They discard in-flight work, throw away warm connection pools, and trigger thundering-herd reconnects. You want one when — and only when — the process is genuinely wedged: a deadlock, a hung event loop, an exhausted scheduler.
- Readiness failure = traffic removal. Cheap, instant, fully reversible. The pod keeps running, keeps its connections, and rejoins the load balancer the moment things improve.
Now re-read Incident A. A database outage is not a reason to restart your process — restarting won’t fix the database, and it destroys everything the process had usefully accumulated. It is an excellent reason to stop sending that pod traffic.
Which gives the rule everything else follows from:
Liveness checks only things inside the process. Readiness checks the outside world.
Liveness must never touch a database, a cache, or a downstream service. Readiness must check exactly those things.
If you take one thing from this post, take that.
Part 3: The design
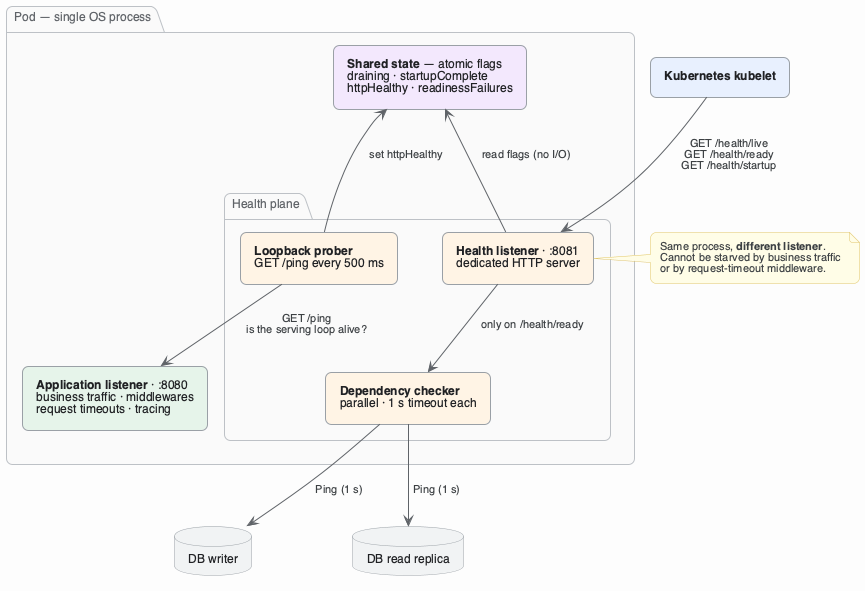
Health probes architecture
Four decisions are encoded there.
Decision 1: A dedicated health listener on its own port
The health endpoints live on port 8081, served by a second HTTP server inside the same OS process as the application on 8080.
Why not just add routes to the existing server? Because a health endpoint sharing a listener with business traffic inherits every failure mode of that traffic:
- Saturation. Under load your request queue backs up. The health endpoint waits in the same queue. The probe times out, liveness fails, and Kubernetes restarts a pod that was merely busy — removing capacity exactly when you needed it. This is how a traffic spike becomes an outage.
- Middleware. Our application server has request-timeout middleware, tracing, panic recovery, tenancy resolution, header parsing. Each one is a chance for a health check to fail for reasons unrelated to health.
- Shutdown. The killer. During graceful shutdown you deliberately stop accepting new connections on the application server — but you must keep answering probes until the very end. Sharing a listener makes that impossible.
One hard constraint on this pattern:
The health listener MUST live in the same process as the application. Never a sidecar. Never a separate container.
A sidecar health server will happily return 200 OK while the application beside it is a smouldering ruin. It has isolated itself from the thing it's reporting on. That's not a health check; it's a liar with good uptime.
Which raises the obvious question: if the health server is isolated from the app server, how does it know the app server is alive?
Decision 2: A loopback prober — who watches the watcher
The health server actively probes the application through localhost:
type Prober struct {
    targetURL        string        // http://localhost:8080/ping
    client           *http.Client
    state            *State
    interval         time.Duration // 500ms
    timeout          time.Duration // 1s
    consecutiveFails int
    startTime        time.Time
}
func NewProber(targetURL string, state *State, interval, timeout time.Duration) *Prober {
    return &Prober{
        targetURL: targetURL,
        client: &http.Client{
            Timeout: timeout,
            Transport: &http.Transport{
                // Force a fresh TCP connection on every probe. See below.
                DisableKeepAlives: true,
            },
        },
        state:    state,
        interval: interval,
        timeout:  timeout,
    }
}
func (p *Prober) Start(ctx context.Context) {
    // Misconfiguration must be loud, not silent. See the trap below.
    if err := p.validateProbe(); err != nil {
        logger.Warn(ctx, "[Prober] validation failed, prober disabled", err)
        return
    }
    // Start pessimistic: assume unhealthy until proven otherwise.
    p.state.SetHttpHealthy(false)
    p.startTime = time.Now()
    p.doProbe(ctx) // probe immediately; don't wait a full tick
    ticker := time.NewTicker(p.interval)
    defer ticker.Stop()
    for {
        select {
        case <-ctx.Done():
            return
        case <-ticker.C:
            p.doProbe(ctx)
        }
    }
}
func (p *Prober) doProbe(ctx context.Context) {
    alive := p.probe(ctx)
    p.state.SetHttpHealthy(alive) // the only writer of this flag
    if alive {
        if p.consecutiveFails > 0 {
            logger.InfoFields(ctx, "[Prober] app server now responding", nil, logger.Fields{
                "previousConsecFails":  p.consecutiveFails,
                "timeToFirstHealthyMs": time.Since(p.startTime).Milliseconds(),
            })
        }
        p.consecutiveFails = 0
        return
    }
    p.consecutiveFails++
    // Log the first failure, then every 20th. See Part 8 on why.
    if p.consecutiveFails == 1 || p.consecutiveFails%20 == 0 {
        logger.WarnFields(ctx, "[Prober] app server not responding", nil, logger.Fields{
            "targetURL":        p.targetURL,
            "consecutiveFails": p.consecutiveFails,
            "unhealthyForMs":   time.Since(p.startTime).Milliseconds(),
        })
    }
}
func (p *Prober) probe(ctx context.Context) bool {
    probeCtx, cancel := context.WithTimeout(ctx, p.timeout)
    defer cancel()
    req, err := http.NewRequestWithContext(probeCtx, http.MethodGet, p.targetURL, nil)
    if err != nil {
        return false
    }
    resp, err := p.client.Do(req)
    if err != nil {
        return false
    }
    defer resp.Body.Close()
    return resp.StatusCode == http.StatusOK
}
And the target is deliberately the dumbest endpoint in the codebase:
// The cheapest possible proof of life. No DB. No cache. No downstream calls.
// If this doesn't answer, the HTTP serving loop itself is wedged.
server.GET("/ping", func(c echo.Context) error {
    return c.String(http.StatusOK, "pong")
})
Three details, each of which cost someone a bad afternoon:
DisableKeepAlives: true. With keep-alives the prober reuses one TCP connection forever. If that single connection is fine but the server's accept loop is broken, the prober reports success while no new client can connect. A fresh connection every 500ms tests the accept path, not one lucky socket.
Starting pessimistic. The naive default is “healthy until proven otherwise.” That creates a race: the process marks startup complete, the prober goroutine is scheduled but hasn’t run, and for a few milliseconds the pod advertises readiness before anything has verified it can serve. Kubernetes admits it to the load balancer. Traffic arrives. Errors. Starting at false keeps the pod out of rotation until a real HTTP round trip has succeeded.
But pessimism has a sharp edge. Look at what happens if validateProbe() fails — a typo'd URL, a zero interval from a bad config value. The prober logs a warning and returns. Nothing ever sets httpHealthy again. It stays false forever, so readiness never passes, and the pod never joins the load balancer. A one-character config typo becomes a deployment that silently never becomes ready. If you combine "start pessimistic" with "give up quietly on bad config," you have built a config typo into an outage. Make that path fatal at startup, or alert on it loudly.
And the timing invariant that ties it together:
prober interval (500ms) << prober timeout (1s) < kubelet probe period (5s)The internal loop must be an order of magnitude faster than the external probe. When Kubernetes asks “are you alive?”, the answer must already be sitting in memory. A probe handler reads a flag; it does not conduct an investigation.
Decision 3: State as atomic flags, not a mutex
Every probe request reads shared state. Three probes plus external monitoring, across a fleet, on a latency-critical service — contention here is real.
The usual way to share state between goroutines is a mutex: a lock that one goroutine holds while others wait. That’s the problem. A probe handler that can wait can be starved, and a starved liveness handler is indistinguishable from a dead process. You’ve built a self-destruct button. So state uses atomics — single machine instructions that read and write a value without any goroutine ever blocking:
type State struct {
    draining          atomic.Bool
    startupComplete   atomic.Bool
    httpHealthy       atomic.Bool   // written by the prober
    workerHealthy     atomic.Bool   // written by the watchdog (worker mode)
    readinessFailures atomic.Int64  // circuit-breaker counter
}

func (s *State) IsAppHealthy() bool {
    return s.httpHealthy.Load() && s.workerHealthy.Load()
}
Note the two separate dimensions collapsed by IsAppHealthy() — that's what lets one implementation serve both an HTTP API and a background message worker.
Decision 4: The order of checks is load-bearing
Here’s the readiness handler. The sequence is not arbitrary.
func (h *Handlers) Readiness(c echo.Context) error {
    // 1. DRAINING FIRST. Shutting down? Say no immediately.
    //    Deliberately does NOT check dependencies: we already know the answer,
    //    and asking would waste drain budget we don't have.
    if h.state.IsDraining() {
        return c.JSON(http.StatusServiceUnavailable,
            ReadyResponse{Status: "draining", Draining: true})
    }
    // 2. Still booting? Not ready. Also cheap. Also doesn't count as a failure
    //    for the circuit breaker in Part 4 - booting isn't faulted.
    if !h.state.IsStartupComplete() {
        return c.JSON(http.StatusServiceUnavailable,
            ReadyResponse{Status: "starting"})
    }
    // 3. Is our own serving loop alive? In-memory flag, set by the prober.
    //    (The worker flag, IsWorkerHealthy, is checked the same way here.)
    if !h.state.IsAppHealthy() {
        h.state.IncrementReadinessFailures()
        return c.JSON(http.StatusServiceUnavailable, ReadyResponse{
            Status: "unhealthy",
            Errors: []string{"app server not responding"},
        })
    }
    // 4. ONLY NOW do we touch the network. Most expensive check last.
    if h.checker != nil {
        if err := h.checker.CheckDependencies(c.Request().Context()); err != nil {
            h.state.IncrementReadinessFailures()
            return c.JSON(http.StatusServiceUnavailable, ReadyResponse{
                Status: "unhealthy",
                Errors: []string{err.Error()},
            })
        }
    }
    h.state.ResetReadinessFailures()
    return c.JSON(http.StatusOK, ReadyResponse{Status: "ok"})
}
Cheapest check first, most expensive last. Every early return is a network call not made. During a rollout, hundreds of pods drain simultaneously; if each ran a full dependency sweep on every readiness probe while draining, we’d hammer the database with pointless pings at the exact moment the cluster is least stable.
And the liveness handler, by deliberate contrast — notice what’s missing:
func (h *Handlers) Liveness(c echo.Context) error {
    // Draining? Still ALIVE. Return 200.
    // Never let a graceful shutdown look like a crash.
    if h.state.IsDraining() {
        return c.JSON(http.StatusOK,
            LiveResponse{Status: "draining", AppHealthy: h.state.IsAppHealthy()})
    }
    // Circuit breaker: unready for a very long time? Ask to be restarted. (Part 4)
    if h.circuitBreakerThreshold > 0 &&
        h.state.ReadinessFailures() >= h.circuitBreakerThreshold {
        return c.JSON(http.StatusServiceUnavailable,
            LiveResponse{Status: "faulted", AppHealthy: false})
    }
    if !h.state.IsAppHealthy() {
        return c.JSON(http.StatusServiceUnavailable,
            LiveResponse{Status: "unhealthy", AppHealthy: false})
    }
    return c.JSON(http.StatusOK, LiveResponse{Status: "ok", AppHealthy: true})
}
No database. No cache. No downstream. No I/O of any kind. Just flags.
That first branch is easy to overlook and essential: liveness returns 200 while draining. If liveness failed during shutdown, Kubernetes would SIGKILL the container mid-drain, destroying the in-flight requests you were carefully trying to finish. Draining is a healthy state — it's the process doing exactly what it was told.
Dependency checks: parallel and bounded
The readiness probe has a hard budget: the kubelet’s timeoutSeconds. Check five dependencies sequentially at up to a second each, and you've built a probe that times out under exactly the partial-degradation conditions it exists to detect.
So checks run concurrently, each with its own timeout, and all failures are collected rather than short-circuiting on the first:
func (dc *DependencyChecker) CheckDependencies(ctx context.Context) error {
    if len(dc.dependencies) == 0 {
        return nil
    }
   // Buffered to len(deps) so no sender can block, even if we stop reading.
    results := make(chan checkResult, len(dc.dependencies))
    var wg sync.WaitGroup
    for _, dep := range dc.dependencies {
        wg.Add(1)
        go func(d Dependency) {
            defer wg.Done()
            results <- dc.checkWithTimeout(ctx, d) // per-dependency ceiling
        }(dep)
    }
    go func() { wg.Wait(); close(results) }()
    var failures []string
    for r := range results {
        if r.err != nil {
            failures = append(failures, fmt.Sprintf("%s: %v", r.name, r.err))
        }
    }
    if len(failures) > 0 {
        return fmt.Errorf("dependencies unhealthy: %s", strings.Join(failures, "; "))
    }
    return nil
}
Total latency is now max(dependency latencies), not sum. And because all failures are collected, the 503 body tells an on-call engineer everything at once:
{
  "status": "unhealthy",
  "draining": false,
  "errors": ["dependencies unhealthy: db-read: context deadline exceeded"]
}
That’s a debuggable health check. {"status":"error"} is not.
Adding a dependency is a five-line interface implementation:
type DBReadDependency struct{ db *sql.DB }

func (d *DBReadDependency) Check(ctx context.Context) error {
    return d.db.PingContext(ctx) // honours the injected timeout
}
func (d *DBReadDependency) Name() string { return "db-read" }
Two rules about what belongs in there:
- Only required dependencies. If your service can still authorize payments while the analytics publisher is down, the analytics publisher must not appear in readiness. Otherwise a non-critical outage becomes a total one — you’ve coupled your availability to your least important dependency.
- Never create a dependency cycle. If service A’s readiness calls service B, and B’s readiness calls A, one blip deadlocks both permanently — neither can ever become ready again. Check dependencies you own the connection to (your database, your cache), not the readiness endpoints of your neighbours.
Part 4: The zombie pod, and the circuit breaker
Here’s an interesting consequence of separating liveness from readiness.
We made liveness ignore dependencies. Good. But consider a pod whose connection pool is permanently corrupted — a stuck goroutine holding every connection, a TLS session that will never renegotiate, some state only a restart can clear:
- Liveness: passes. The process runs,
/pinganswers. - Readiness: fails forever. It can’t reach the database.
- Kubernetes: does nothing. Ever.
That’s a zombie pod. It counts against your replica count, consumes memory and CPU, serves zero traffic, and sits there until a human notices. Scale that across a rolling deploy and you get a “fully deployed” workload where a third of the fleet is quietly serving nothing.
So we deliberately reintroduce a narrow, delayed coupling:
// Readiness: increments on genuine failures, resets on any success.
// Liveness:
if h.circuitBreakerThreshold > 0 &&
    h.state.ReadinessFailures() >= h.circuitBreakerThreshold {
    return c.JSON(http.StatusServiceUnavailable,
        LiveResponse{Status: "faulted", AppHealthy: false})
}
Sustained, uninterrupted readiness failure eventually escalates into a liveness failure, and Kubernetes restarts the pod. A single readiness success resets the counter to zero, so a transient blip never trips it. Only a genuinely stuck pod reaches the threshold.
Two subtleties are worth more than the mechanism itself.
First: the counter is driven by requests, not by time. It increments once per failing readiness request. So:
time-to-trip = threshold × kubelet readiness periodSecondsWith a threshold of 60 and periodSeconds: 5, that's 5 minutes of unbroken failure. Drop the period to 2s to make draining more responsive, and you've silently made your circuit breaker trip in 2 minutes instead.
Our own internal documentation got this wrong. It claimed 30 seconds, reasoning from the 500ms prober interval. Wrong loop entirely — the prober drives an in-memory flag; the kubelet drives the counter. Two independent clocks, and the doc had picked the wrong one. If you build something like this, write the formula in the config next to the threshold, or someone will eventually get a surprise restart storm from tuning an unrelated knob.
Second: not every 503 is a failure. Look again at the readiness handler — the draining and starting branches return 503 without incrementing. That's deliberate: a pod that's booting isn't faulted, and a pod that's draining is about to exit anyway. Incrementing on those would mean every slow start and every deploy nudged the fleet toward self-inflicted restarts. When you build a counter that can trigger a restart, be precise about what feeds it.
A related trap. For backward compatibility we kept an alias:
func (h *Handlers) Health(c echo.Context) error {
    return h.Readiness(c) // same semantics — old monitors keep working
}
That alias inherits the counter too: anything polling /health on the health port feeds the same circuit breaker as the kubelet. A blackbox monitor polling once a second alongside a kubelet polling every five multiplies your effective trip rate. In our case we got lucky — the legacy /health that external monitors actually poll lives on the application port and is a completely different, older handler — so nothing external touches the counter today. Lucky is not the same as designed. If you alias an endpoint, you inherit its side effects, including the ones added later.
Set the threshold to 0 to disable the mechanism entirely. That's the right call for a workload where a restart costs more than a zombie.
Part 5: Graceful shutdown — the choreography
Probes protect you from bad pods. Shutdown choreography is what buys zero-downtime deploys.
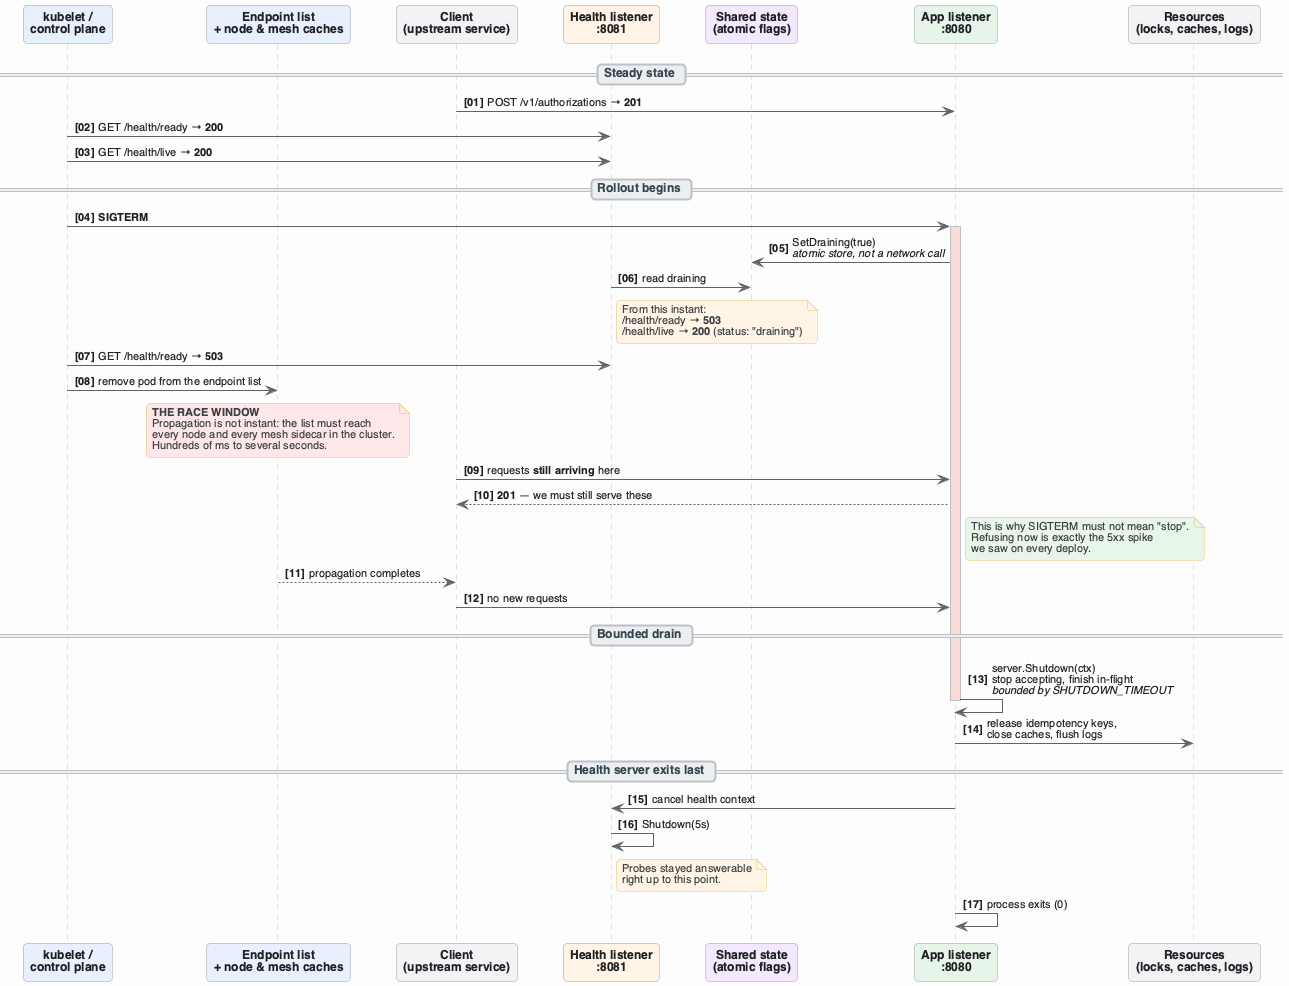
Graceful shutdown sequence diagram
The implementation, essentially verbatim:
func (hs *HTTPServer) run(parentCtx context.Context) {
    go func() {
        err := hs.server.Start(":" + port)
        if err != nil && !errors.Is(err, http.ErrServerClosed) {
            hs.server.Logger.Fatal(err) // real bind failure, not a graceful close
        }
    }()
    // parentCtx is cancelled by signal.NotifyContext on SIGTERM/SIGINT.
    <-parentCtx.Done()
    // ── STEP 1: Stop advertising readiness. Immediately. Before anything else.
    if hs.healthState != nil {
        hs.healthState.SetDraining(true)
    }
    totalShutdown := time.Now()
    // ── STEP 2: Bounded graceful shutdown of the business listener.
    // Stops accepting new connections; lets in-flight handlers finish.
    ctx, cancel := context.WithTimeout(context.Background(),
        time.Duration(shutdownTimeoutSec)*time.Second)
    defer cancel()
    if err := hs.server.Shutdown(ctx); err != nil {
        logger.Error(ctx, "http server graceful shutdown failed", err)
    }
    // ── STEP 3: Release resources.
    hs.closeResources(ctx)
    // ── STEP 4: Measure it. You cannot tune what you don't record.
    metric.ShutdownDuration.Record(context.Background(),
        float64(time.Since(totalShutdown).Milliseconds()),
        attribute.String("type", "total_duration_ms"))
}
Four ideas are hiding in there.
Idea 1: Set draining before literally anything else
SetDraining(true) is the first statement after the signal. Not after closing connections, not after a final flush — first. Every millisecond between SIGTERM and readiness returning 503 is a millisecond during which Kubernetes still believes this pod is a valid target.
And the draining branch skips dependency checks entirely. When you’re going away you don’t need the database’s opinion.
Idea 2: The health server has its own lifetime, and dies last
This is the detail most often missing elsewhere, and it’s subtle:
if hs.healthServer != nil {
    // NOTE: context.Background(), NOT the signal-derived parentCtx.
    // The health server must SURVIVE SIGTERM.
    healthCtx, healthCancel := context.WithCancel(context.Background())
defer func() {
        healthCancel()          // only after run() has fully returned
        hs.healthServer.Wait()  // and only then wait for it to close
    }()
    go hs.healthServer.Start(healthCtx)
}
// AFTER routes are registered and dependencies wired - never before.
if hs.healthState != nil {
    hs.healthState.SetStartupComplete(true)
}
hs.run(parentCtx) // blocks until shutdown completes
Wire the health server to the same signal context as the application and SIGTERM kills both at once. The health endpoints stop answering at the exact moment Kubernetes is most actively probing them — and a probe against a closed port isn't "draining," it's a connection error. Kubernetes may read that as a dead container and escalate to SIGKILL, cutting your drain short.
So: started on a detached context, shut down in a defer that runs only after the application has fully drained. First thing up, last thing down.
Idea 3: Resource cleanup is correctness, not politeness
func (hs *HTTPServer) closeResources(ctx context.Context) {
    start := time.Now()
    // Release in-flight idempotency keys. Without this, a key stays "in flight"
    // until TTL expiry - so a legitimate client retry that lands on a healthy
    // pod gets rejected as a duplicate of a request that never completed.
    if hs.inFlightRegistry != nil {
        if cleaned := hs.inFlightRegistry.CleanupAll(ctx); cleaned > 0 {
            logger.WarnFields(ctx, "released orphaned idempotency keys", nil,
                logger.Fields{"count": cleaned})
        }
    }
    if hs.readCacheClient != nil {
        if err := hs.readCacheClient.Close(); err != nil {
            logger.Error(ctx, "error closing read cache client", err)
        }
    }
    if hs.writeCacheClient != nil {
        if err := hs.writeCacheClient.Close(); err != nil {
            logger.Error(ctx, "error closing write cache client", err)
        }
    }
    // Flush buffered logs LAST - otherwise the story of the shutdown dies
    // with the process.
    if err := logger.Defer(); err != nil {
        logger.Error(ctx, "error flushing logs during shutdown", err)
    }
    metric.ShutdownDuration.Record(ctx,
        float64(time.Since(start).Milliseconds()),
        attribute.String("type", "resource_cleanup_ms"))
}
That first block generalizes beyond payments. We prevent duplicate authorizations with an idempotency registry: a key is marked in-flight for the duration of a request. If a pod dies mid-request without releasing its keys, those keys stay locked until TTL — so the client’s perfectly reasonable retry, routed to a healthy pod, is rejected as a duplicate of a request that never finished. An ungraceful exit creates a correctness problem, not just an availability one. Releasing distributed locks is part of shutting down.
Note also the two metric dimensions — total duration and cleanup duration. When your drain starts creeping toward the grace period, you need to know which phase got slower.
Idea 4: Measure the drain, or your grace period is a guess
Record shutdown duration as a histogram and you get the one number that determines your configuration:
terminationGracePeriodSeconds ≈ p99(drain duration) × 1.5Better still, alert on the ratio: fire when p99 drain exceeds 80% of the grace period. That alert catches a release that made shutdown slower before deploys start getting SIGKILLed. It converts a future incident into a ticket. (Mind your units when you write that query — ours records milliseconds; a threshold computed against a metric named ..._seconds is wrong by a factor of a thousand, which is exactly the kind of error that looks fine in a dashboard.)
Part 6: Workers are a different animal — and where I found two bugs
Everything above assumed an HTTP service. Our message workers (queue consumers) share the same health package, but the semantics shift, and most writing on this topic stops before here.
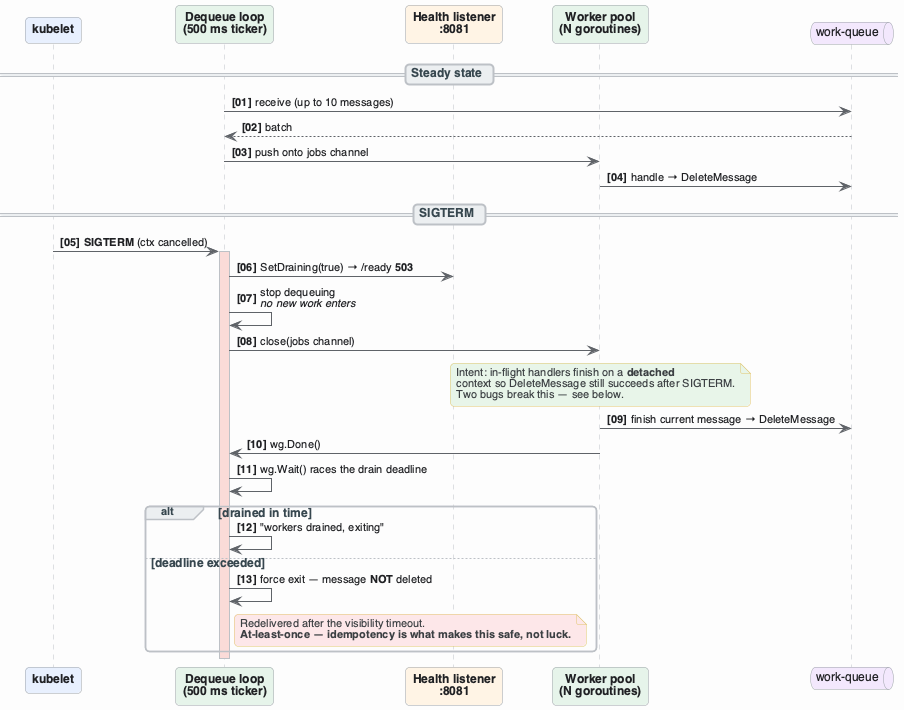
Worker drain sequence diagram
Two bits of vocabulary if queues are new to you. A consumer receives a batch of messages, processes them, then explicitly deletes each one to acknowledge it. Between receive and delete, the queue makes the message invisible to other consumers for a fixed window — the visibility timeout. Finish and delete inside that window and the message is gone for good. Die before deleting, and the message reappears and gets processed again by someone else. That’s at-least-once delivery: the queue would rather deliver twice than lose a message, which means your handlers must be idempotent. Not “should be.” Must.
Readiness on a worker means “should I accept new work?”
A worker has no inbound load balancer, so “remove from the endpoint list” is meaningless. Readiness becomes a work-intake gate and a rollout signal instead: a blue/green or canary rollout won’t promote a worker that never reports ready. It still protects you from shipping a broken consumer — just via a different pipeline.
The pattern: a detached drain context
When SIGTERM cancels the parent context, the dequeue loop should stop instantly — that's what you want. But the message currently being processed must not be cancelled, because cancelling it aborts the DeleteMessage call. The work gets done and the acknowledgement is lost, so the queue redelivers a message you already processed.
Go 1.21 added exactly the right tool: context.WithoutCancel, which inherits a context's values (trace IDs, tenant, request metadata) while severing cancellation propagation. So:
// Give in-flight work its own budget, not tied to the cancelled parent.
drainCtx, cancel := context.WithTimeout(
    context.WithoutCancel(ctx),   // detached from SIGTERM
    time.Duration(shutdownTimeoutSec)*time.Second,
)
defer cancel()
<-ctx.Done()   // signal arrived
close(jobs)    // no new work enters the pool
done := make(chan struct{})
go func() { wg.Wait(); close(done) }()
select {
case <-done:
    logger.Info(ctx, "workers drained gracefully", nil)
case <-drainCtx.Done():
    logger.Warn(ctx, "drain deadline exceeded; forcing shutdown", nil)
    // Anything still in flight is simply not deleted.
    // The queue redelivers it after the visibility timeout.
}
That is the pattern I set out to write about. Then I read our source properly.
Bug 1: the drain budget expires before it’s ever used
Look closely at when drainCtx is created. In our consumer it's built once, at the top of Consume(), before the dequeue loop starts — i.e. at pod startup.
context.WithTimeout starts its clock the moment you call it. So the 10-second drain budget begins counting at process start. Ten seconds later — long before any deploy — drainCtx is already expired.
Which means when SIGTERM finally arrives, hours into the pod's life, that select doesn't race anything. drainCtx.Done() is already closed. It takes that branch immediately, logs "drain deadline exceeded," and returns without waiting for in-flight work at all.
The drain is dead on arrival. And it fails in the most deceptive way possible: the log line is the one you’d expect from a legitimately slow drain. It warns that the drain timeout was reached and it’s exiting anyway — which reads exactly like a busy pod under load. Nobody looks twice at a warning that already has a plausible explanation.
The fix is a one-line move — construct drainCtx inside the ctx.Done() branch, when shutdown actually begins:
case <-ctx.Done():
    close(jobs)
// Start the clock NOW, not at startup.
    drainCtx, drainCancel := context.WithTimeout(
        context.WithoutCancel(ctx),
        time.Duration(shutdownTimeoutSec)*time.Second,
    )
    defer drainCancel()
    // ... then race wg.Wait() against drainCtx.Done()
Bug 2: the detached context arrives one message too late
The second one is subtler. Handing drainCtx to the worker pool isn't enough; you have to use it for the right messages. Our workers choose per message, as each one comes off the channel:
for msg := range msgCh {
    processCtx := ctx
    if ctx.Err() != nil {      // evaluated when the message is PULLED
        processCtx = drainCtx
    }
    // ... process with processCtx, then DeleteMessage with it
}
Read the timeline. A worker pulls a message while everything is healthy, so ctx.Err() is nil and processCtx = ctx. Then SIGTERM lands. That message is now mid-flight holding the cancelled context — every downstream call it makes, including the final DeleteMessage, is cancelled.
So the detached context protects exactly the messages that were already in the channel buffer at shutdown, and fails for the messages that were actually in flight — the ones the whole mechanism existed to protect. Those get processed successfully and then fail to acknowledge, so the queue redelivers them and they’re processed a second time.
The blast radius is bounded only because our handlers are idempotent. That’s the safety net working as designed — but “we’re saved by a control we built for a different reason” is not the same as correct.
The fix is to make the choice at use time, not pull time — pass both contexts down and select the right one at each cancellable operation, or simply run every handler on the detached context with its own per-message timeout.
Why both bugs survived code review
This is the part I’d actually want a junior engineer to read.
Neither bug is a typo. The code has an accurate comment explaining the intent. It uses the modern, correct API. It has a bounded timeout, a WaitGroup, and a select. Every individual line is defensible, and it reviews well precisely because every piece is recognizable as the right pattern.
They survived because shutdown code only executes in the two seconds nobody watches, and when it fails it produces a log line that looks like normal operation. There’s no failing test, no alert, no error rate. You get slightly more duplicate processing than you should — absorbed silently by idempotency.
Two general lessons:
- Anything that only runs during shutdown needs a test that runs during shutdown. Send a real
SIGTERMto a real process under real load and assert on the outcome. Part 8 has the procedure. A unit test that never cancels a context cannot find either of these. context.WithTimeoutstarts its clock at the call site, not at the event. Any deadline that's supposed to bound a future event must be created when that event happens. Go and grep your codebase for aWithTimeoutcreated at startup and consumed much later — that pattern is a silent no-op waiting to happen.
Nested drain budgets, and the number that surprised us
Our worker process runs several consumers concurrently, each with its own drain budget. The supervisor that waits for all of them uses SHUTDOWN_TIMEOUT + 5s — deliberately longer than any child's budget, so each consumer gets a fair chance to finish before the parent gives up.
That has a config consequence which is easy to miss:
The worker’s true worst-case shutdown is
SHUTDOWN_TIMEOUT + 5s + resource cleanup, notSHUTDOWN_TIMEOUT. SoterminationGracePeriodSecondsmust exceed that. Get it wrong andSIGKILLlands mid-drain — and you'll discover it as duplicate-processing alerts, not as a shutdown error.
An honest gap: we prove the wrong thing is alive
Our health package includes a second liveness mode built specifically for workers — a heartbeat the processing loop touches, and a watchdog that flags staleness:
type Heartbeat struct {
    lastBeatNano atomic.Int64
    activated    atomic.Bool
}
func (h *Heartbeat) Touch() {
    h.lastBeatNano.Store(time.Now().UnixNano())
    h.activated.CompareAndSwap(false, true)
}
func (h *Heartbeat) IsAlive(threshold time.Duration) bool {
    // Grace period: before the first Touch, assume alive - otherwise every
    // worker fails liveness during startup, before it has processed anything.
    if !h.activated.Load() {
        return true
    }
    return time.Since(time.Unix(0, h.lastBeatNano.Load())) <= threshold
}
It’s implemented and unit-tested. It is not yet wired into our worker — that’s the next change in this sequence. Today our workers use the same HTTP prober as the API, pointed at their own admin /ping.
Which means worker liveness currently proves the admin HTTP server responds. It does not prove the consume loop is still consuming. A worker whose handler deadlocks on a lock or a hung downstream call will answer /ping cheerfully forever, passing liveness while processing zero messages.
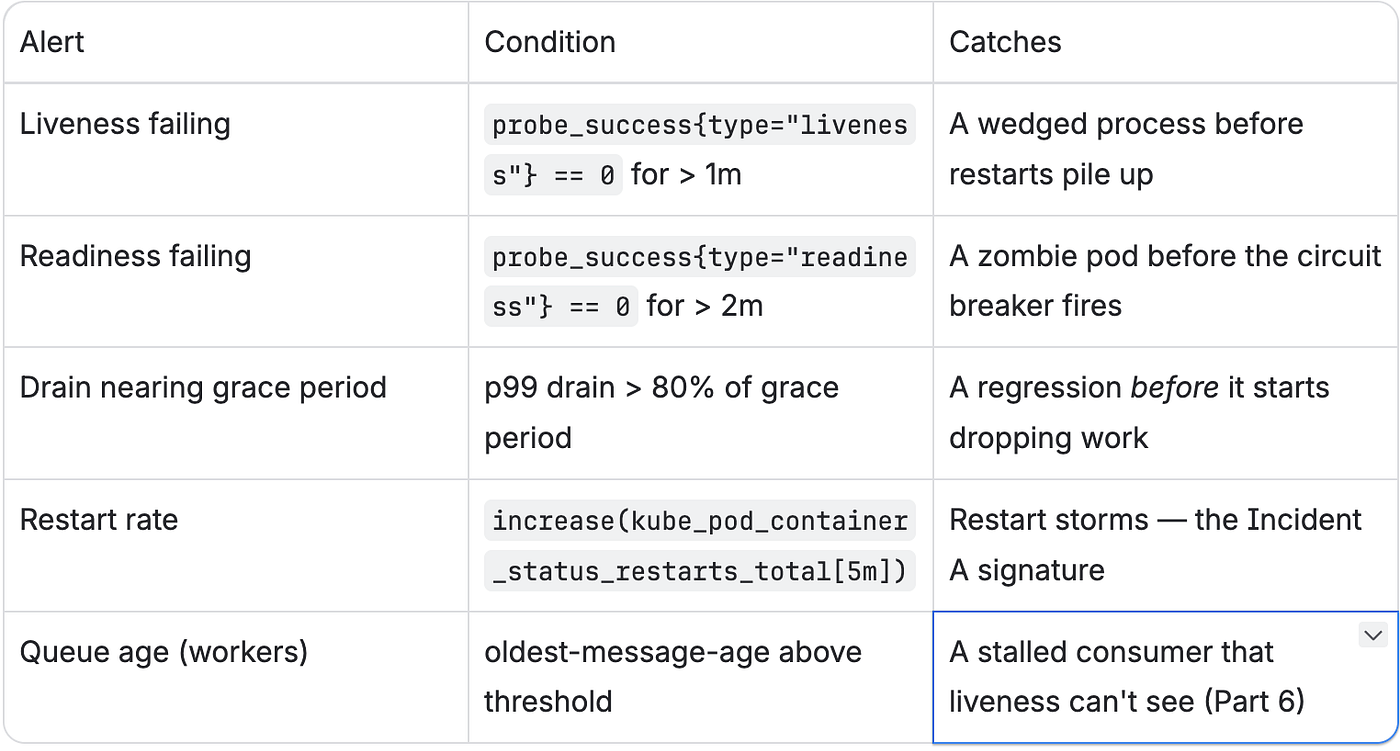
If you’re in the same position — and many teams are, because this is the default outcome of reusing an HTTP health check on a worker — the compensating control you need is queue-depth and oldest-message-age alerting, which catches a stalled consumer from the outside regardless of what liveness thinks. Verify you have it before you rely on it.
Two design notes on the heartbeat itself, because they’re easy to get wrong:
- Touch it from inside the real work loop — after each message, plus an idle ticker so an empty queue doesn’t look like a hang. A heartbeat touched by a background ticker running next to the consumer proves the ticker is alive, which is not the claim you need.
- The
activatedgrace period is essential. Before the firstTouch(),IsAlive()returns true; staleness detection arms itself only once the loop has proven it runs at least once. Without it, every worker fails liveness on boot.
I’m including this gap rather than omitting it, because it’s the most common failure mode of health-check work in general: it is very easy to build a probe that measures something adjacent to what you care about, and then trust it. Ask of every liveness check — what specific broken state does this catch, and what sails straight through?
Part 7: The configuration, and the arithmetic behind it
Code is half the story; the numbers in your manifests are the other half.
health:
  enabled: true
  port: 8081                  # the dedicated health listener
  livenessPath:  /health/live
  readinessPath: /health/ready
  startupPath:   /health/startup
  livenessInitialDelay:  5
  readinessInitialDelay: 5
  startupInitialDelay:   0    # the startup probe should begin immediately
  periodSeconds:    5
  timeoutSeconds:   2
  successThreshold: 1
  failureThreshold: 3
# ConfigMap — probe behaviour tunable without a rebuild
ENABLE_DEDICATED_HEALTH_SERVER: "true"
HEALTH_PORT: "8081"
PROBE_INTERVAL_MS: "500" # loopback prober cadence
PROBE_TIMEOUT_MS: "1000" # loopback prober timeout
READINESS_CHECK_TIMEOUT_MS: "1000" # per-dependency ceiling
CIRCUIT_BREAKER_THRESHOLD: "60" # consecutive readiness failures → restartHere’s where I have to be candid, because writing this section is what made us notice the problem.
We designed the probe contracts carefully and then let a single shared YAML block configure all three probes. Readiness and liveness want opposite tuning, and one block cannot express both:
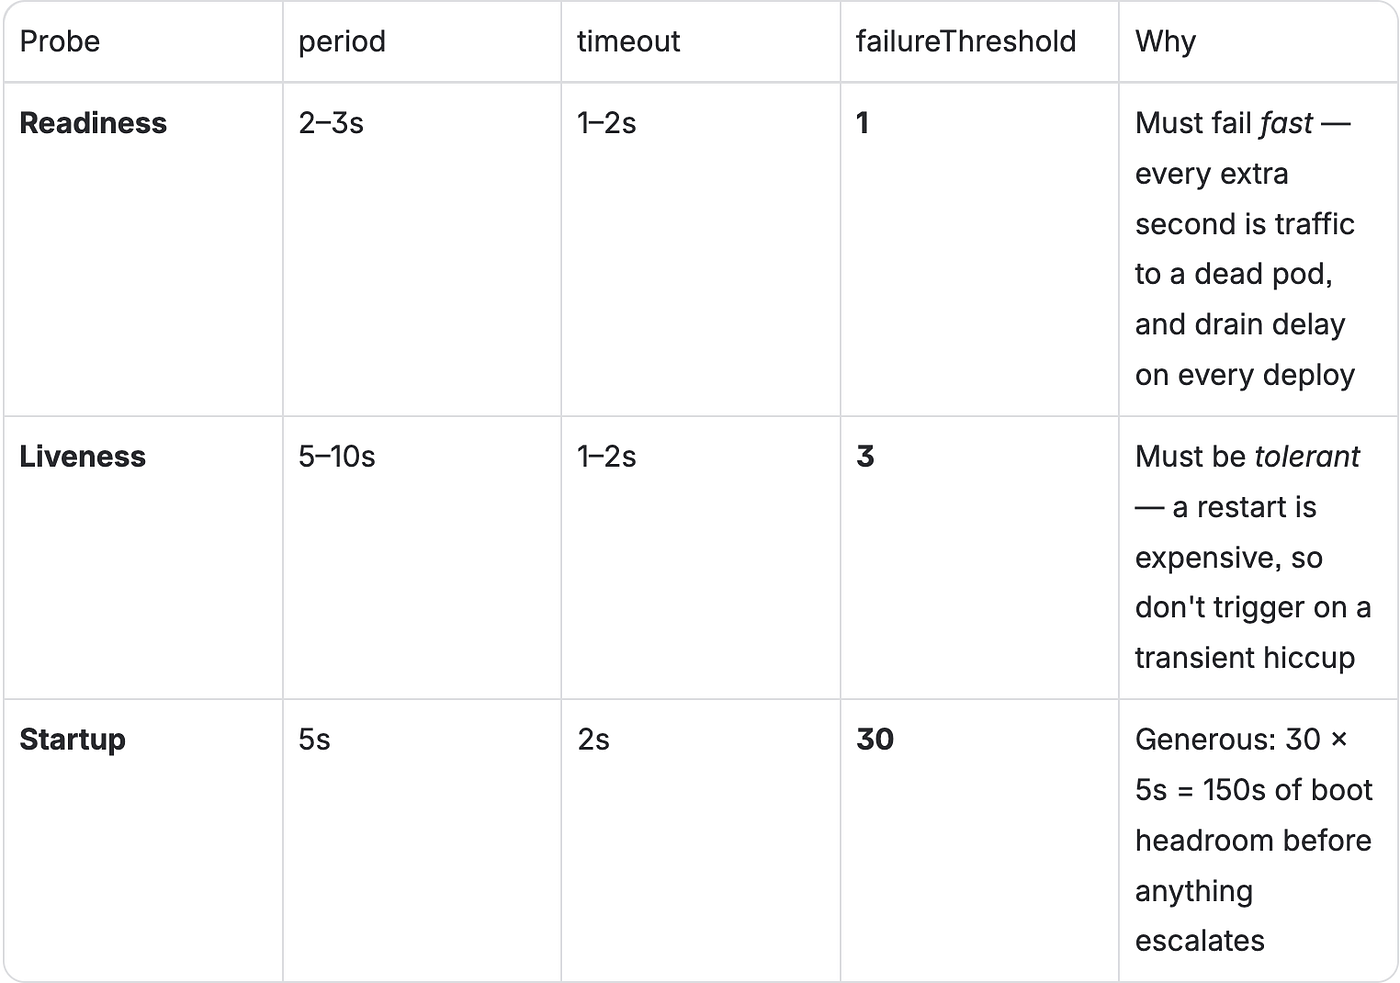
Compare that to what we actually shipped: periodSeconds: 5, failureThreshold: 3 for all three.
- For liveness that’s correct and tolerant. Fine.
- For readiness it’s too slow. The formula that matters is:
detection delay ≈ periodSeconds × failureThreshold (+ up to timeoutSeconds)- At 5 × 3 that’s up to 15 seconds during which a bad pod still receives traffic. On a service doing thousands of authorizations a second, 15 seconds is a lot of declines.
- For startup it’s arguably worst, and we hadn’t noticed at all. Our design docs say the startup probe should get
failureThreshold: 30— roughly 150 seconds of boot headroom. We pass a single flatfailureThreshold: 3, which our shared chart fans out to all three probes: about 15 seconds. A pod that takes longer than that to warm up gets killed during startup, which then looks like a crash loop rather than a slow boot. The probe we added specifically to protect slow starts had been quietly configured to punish them. - Note the shape of that finding: one YAML key, three probes with three different needs, and a chart we don’t own deciding how the key is applied. If your probe block has a single
failureThreshold, go read the chart that consumes it before you trust any of the three numbers.
That’s the drift worth hunting in your own cluster. The code was designed carefully; the YAML was copy-pasted; the YAML is what runs.
The timing invariant
terminationGracePeriodSeconds > worst-case app drain > service-mesh drainConcretely, for our worker:
terminationGracePeriodSeconds
    >  SHUTDOWN_TIMEOUT (10s)  +  supervisor margin (5s)  +  resource cleanup
    >  mesh sidecar drain
If the grace period is smaller than your worst-case drain, Kubernetes SIGKILLs you mid-flight and every carefully written shutdown path above becomes dead code. If the mesh sidecar drains before the application, in-flight requests lose their network out from under them.
And a gap in our own setup, stated plainly: we don’t pin terminationGracePeriodSeconds in our chart — we inherit it from a shared platform chart. Nor is SHUTDOWN_TIMEOUT set in our ConfigMap; it falls through to a code default. So the two numbers that must satisfy an inequality live in three different places, none of them next to each other, and one of them can change without our review.
Pin both explicitly, side by side, with a comment showing the arithmetic. Two values that must satisfy an inequality should never live in two different repositories.
Part 8: How to test this
Health checks pass in CI and fail in production, because CI has no SIGTERM, no latency and no load. Three layers:
1. Unit-test the state machine. The probe handlers are pure functions of flags, which makes the whole truth table testable with no infrastructure:
// doGET: helper wrapping httptest.NewRequest + NewRecorder + echo.New().NewContext
func TestLiveness_StaysAliveWhileDraining(t *testing.T) {
    state := healthserver.NewState()
    state.SetDraining(true)
    rec := doGET(t, healthserver.NewHandlers(state, nil, 0).Liveness)
    // The whole point: draining is a HEALTHY state.
    assert.Equal(t, http.StatusOK, rec.Code)
}

func TestReadiness_DrainingReturns503(t *testing.T) {
    state := healthserver.NewState()
    state.SetStartupComplete(true)
    state.SetDraining(true)
    rec := doGET(t, healthserver.NewHandlers(state, nil, 0).Readiness)
    assert.Equal(t, http.StatusServiceUnavailable, rec.Code)
    assert.Contains(t, rec.Body.String(), `"draining":true`)
}
That first test is the regression guard for a bug that would otherwise surface months later as an unexplained 5xx spike during deploys.
2. Integration-test on an ephemeral port. Start the real health server on a listener bound to :0, flip the state flags, assert real HTTP responses. This catches wiring mistakes: a route on the wrong server, a nil checker, an alias that drifted from its target.
3. Drain-test under load. The only test that would have caught either bug in Part 6, and the only one that tells you what your grace period should be:
- Drive the service at 25%, 75% and 100% of peak throughput.
- Send
SIGTERMto one pod while it's under load. - Measure: time to first 503 on readiness; time until the last in-flight request completes; for workers, time until the last message is acknowledged.
- Assert zero dropped requests and zero duplicate processing.
- Read p99 drain duration off the histogram; set
terminationGracePeriodSeconds = p99 × 1.5. - Re-run every release and alert if drain time regresses.
Step 6 is the one everyone skips, and it’s the one that keeps working after you’ve moved on.
Part 9: Observability (what we’re adding, not what we have)
Probes are a control loop, and a control loop you can’t see is a control loop you can’t tune. To be clear about status: our shutdown duration is already instrumented — that’s the histogram Part 5 records. The probe-level signals below are the gap we’re closing, and I’m flagging that explicitly because “aspirational monitoring described in past tense” is its own kind of technical debt.
Two signals worth exporting:
probe_success{type="liveness"|"readiness"|"startup"}— a gauge, per pod, set to 0 when that specific check fails. Not "is the endpoint up" but "which check is failing, where."drain_duration— a histogram of shutdown time, which is what sets your grace period.
One distinction that cost us some confusion: blackbox probing is not probe instrumentation. If your monitoring stack already exports something called probe_success, check whether it's a blackbox exporter hitting your endpoint from outside. That tells you the endpoint is reachable. It does not tell you which internal check failed or on which pod. You want both.
Alerts worth having:
Finally, instrument the probe internals. Notice the log sampling in the prober earlier: first failure, then every 20th, then recovery with total unhealthy duration. At a 500ms interval, logging every failure produces 120 lines per minute per pod and buries the signal in its own noise. That pattern gives you an immediate alert, a periodic heartbeat proving it’s still broken, and a clean “recovered after N ms” line to paste into the incident timeline. Worth stealing for any hot-loop logging.
Part 10: The checklist
Endpoints
/health/live,/health/ready,/health/startupon a dedicated port, in the same process- Keep the old
/healthas an alias for compatibility — then find and migrate its callers - Never a sidecar: it can report healthy while the app is dead
- If you alias an endpoint, audit what side effects you inherited
Liveness
- Zero external calls. No DB, no cache, no downstream. Flags only.
- Returns 200 while draining
- Actually proves the work loop is alive — loopback ping for HTTP; heartbeat touched inside the loop for workers
Readiness
- Every required dependency, checked in parallel, each with a tight timeout
- Optional dependencies never flip it
- No dependency cycles between services
- 503 the instant draining starts, without running dependency checks
- The 503 body names the failing dependency
- Booting and draining don’t feed the restart counter
Startup
- Use it if boot takes more than ~10s
- Generous
failureThreshold— and verify the deployed value, not the documented one - Set
startupCompleteafter routes are registered
Shutdown
draining = trueis the first statement afterSIGTERM- Application server drains with a bounded timeout
- In-flight work runs on a detached context — created at shutdown, and selected at use time
- Distributed locks / idempotency keys released
- Health server on a detached context, shut down last
- Logs flushed at the very end
Config
terminationGracePeriodSeconds > worst-case drain > mesh drain— pinned, with the arithmetic in a comment- Readiness tuned aggressive; liveness tolerant. Not the same block.
- Restart-counter threshold documented with its wall-clock formula
- Grep for
WithTimeoutcreated at startup but consumed later
Verification
- Unit tests for the full state truth table
- Integration tests on an ephemeral listener
- Drain test under load, per release — the only test that finds shutdown bugs
What I’d tell my past self
A health check is an API contract, not a debug endpoint. Kubernetes takes destructive, automated action based on its answer. Design it with the care you’d give an endpoint that moves money.
Liveness and readiness are opposites in temperament. Liveness should fear false positives — a wrong answer costs a restart. Readiness should fear false negatives — a wrong answer costs a bad request. Tuning them identically guarantees one of them is wrong.
SIGTERM means "start telling Kubernetes you're not ready," not "stop working." Every zero-downtime deploy depends on the pod outliving its own removal from the load balancer.
The health check must observe the thing you care about, not something adjacent. Our worker liveness proves an HTTP server responds; it does not prove messages are being consumed. Go find your equivalent, and ask what would sail straight through.
Code that only runs during shutdown is code that is never really tested. Both bugs in Part 6 reviewed well, used the right APIs, and had accurate comments. They survived because nothing exercises the two seconds after SIGTERM — and because when they failed, they logged something that looked entirely reasonable. If a failure mode produces a plausible-looking log line, you will not find it by reading logs.
Nobody demos a readiness probe. But this is the difference between a database blip being a paragraph in a postmortem and a database blip being an outage — and between a deploy your team schedules for 2am and one you ship at lunchtime without thinking about it.
If you’ve found a clean way to prove a message-consumer loop is genuinely alive — not just that its HTTP server answers — I’d really like to hear it. That’s the open problem I’m still sitting with.
All service, queue and resource names in this post are anonymized; the architecture, the code shapes and the two bugs are real.
메타데이터
- post_id
- d9d72eebf4b8
- slug
- sigterm-doesnt-mean-stop-d9d72eebf4b8
- url
- https://medium.com/@amanzoot/sigterm-doesnt-mean-stop-d9d72eebf4b8
- canonical_url
- https://medium.com/@amanzoot/sigterm-doesnt-mean-stop-d9d72eebf4b8
- author_url
- https://medium.com/@amanzoot
- status
- ok
- fetched_at
- 2026-08-23 21:37:58


