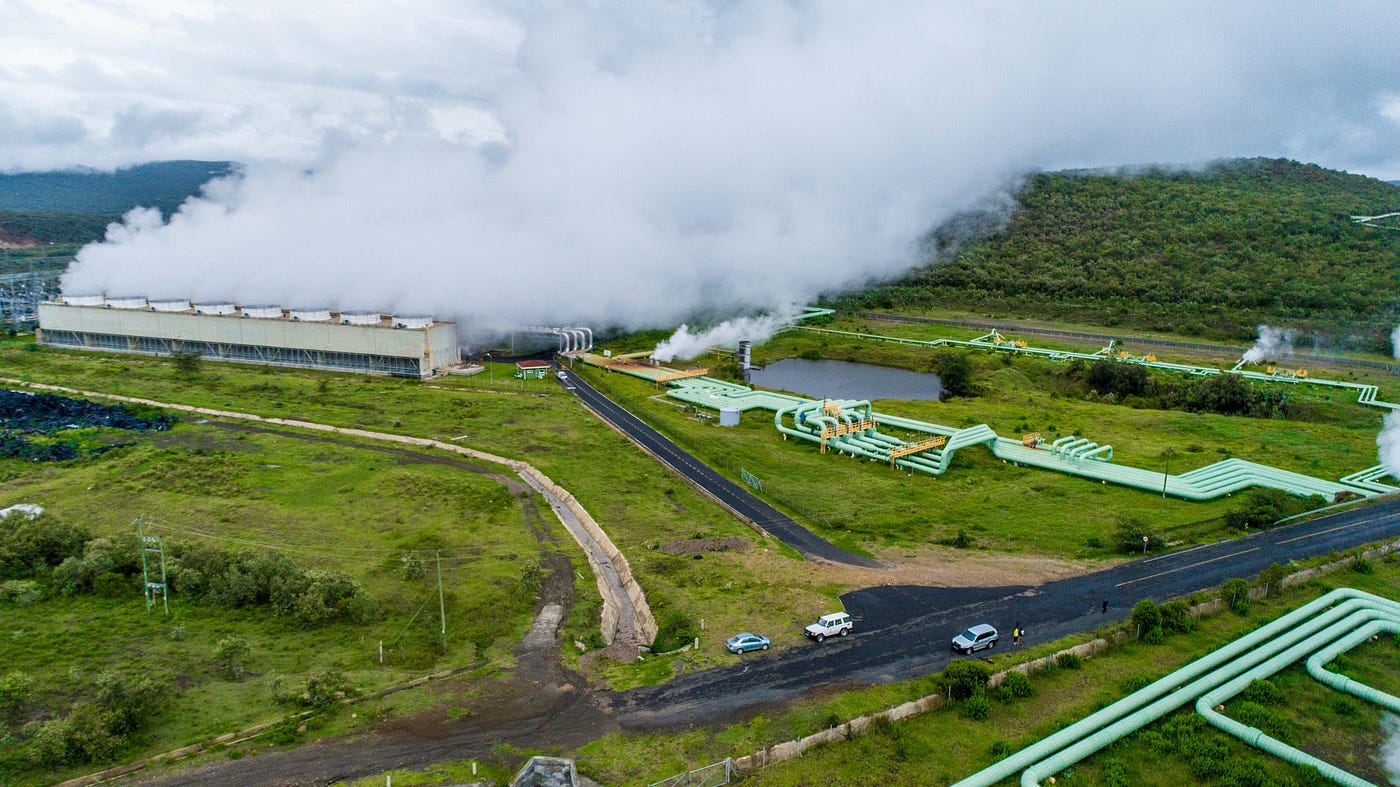
Carbon Footprint Analytics: a data integration story
Measuring GHG emissions is a data integration challenge. See how Teradata’s CFA solution accelerator tackles it.
Carbon Footprint Analytics: a data integration story
Measuring GHG emissions is a data integration challenge. See how Teradata’s CFA solution accelerator tackles it.

Galina Nelyubova ; Earth Day — a collection of environmental 3D illustrations
Climate emergency intensifies, and companies must play a significant role in ensuring a sustainable future. As climate change is one of the biggest systemic risks, mitigation of adverse financial effects and adaptation to rapidly changing circumstances is key for companies to ensure long-term going concern and growth. Centerpiece for these activities is proper reporting and reducing of companies’ greenhouse gas (GHG) emissions. And doing so requires much more than good intentions: it demands robust data integration, and the right platform.
Why Carbon footprint analytics matters
Every company’s operations — from logistics and manufacturing to IT and facilities — generate emissions. These emissions are environmental concerns, and they can also become a financial and reputational risk. Regulatory bodies are moving toward mandatory enterprise-wide GHG reporting, and stakeholders are demanding transparency and action.
To meet these expectations, companies must answer critical questions:
· How much GHG emissions are we responsible for?
· Which activities contribute the most?
· What’s our roadmap to a sustainable level of GHG emissions? (Ones would say “path to net-zero”, but let’s focus on reduction first before compensating).
The answers lie within the data companies already possess: financial systems, operational logs, energy consumption records… All these contain the clues needed to build a comprehensive GHG emissions profile. And here is precisely the challenge most companies are facing: transforming existing data into actionable insights.

Figure 1 — Calculating a carbon footprint is easy… until your start digging into the details!
Why it’s a data integration story
Carbon footprint analytics is fundamentally a data integration challenge. As the saying goes, “What gets measured, gets managed”. And measuring emissions accurately means harmonizing data from disparate sources, each with its own format, granularity, units, and quality. Trying to report GHG emissions without data integration is like assembling a jigsaw puzzle where pieces are taken from different puzzles: You’ll never see the full picture.
The Carbon Footprint Analytics (CFA) solution accelerator designed by Teradata tackles this complexity challenge. Based on a flexible data model, it ingests enterprise-specific data using proven algorithms, and outputs detailed GHG emissions across all scopes (1, 2 and 3) defined by the GHG Protocol.
Key capabilities include:
· Unit harmonization: automatically converts measures to configurable preferred units (pounds vs kilograms, kWh vs MWh, etc.)

Figure 2 — Automated management of measure systems heterogeneity
· Geospatial awareness: identifies the right emission factors based on location, which is particularly critical for electricity consumption (electricity mix, thus GHG emissions, significantly differ between countries and regions)
· Temporal modeling: the CFA design reflects evolving emission factors and activity periods.
A key point to understand is that CFA is not a reporting tool. It is an engine in which we can connect reporting tools. This engine integrates and enriches data to deliver a harmonized, enterprise-wide view of emissions.
Think before you jump: design matters
Before diving into carbon analytics, companies must design a robust and flexible data model. A poorly structured model can lead to wasted efforts and inconsistent results.
The CFA solution accelerator emphasizes thoughtful architecture:
· A core data model that supports multiple aggregation levels and units
· Pre-integrated calculation rules for seamless processing and explainable results
· Advanced analytics capabilities, including machine learning, geospatial, time-series and string similarities.

Figure 3 — Overview of the CFA data model, designed for scope 1, 2 and 3 GHG emissions
This foundation ensures that companies can not only report emissions, but also forecast, simulate and optimize their GHG emissions reduction strategy.
Why Teradata is the right platform
Teradata Vantage is well positioned to support Carbon Footprint Analytics:
· Geospatial capabilities: visualize GHG emissions and apply location-specific factors.

Figure 4 — Geospatial capabilities facilitate segregation of GHG emissions according to location
· Temporal intelligence: track changes over time with time-aware tables.
· Advanced analytics: leverage ClearScape Analytics™ features to observe the trends and to simulate the effect of your strategic decisions for multiple scenarios.
· Scalable integration: harmonize data from multiple sources with high performance and reliability.

Figure 5 — Multiple data sources must be efficiently integrated, both internal and external
The ClearScape Analytics Experience demo showcases CFA in action — transforming raw data into meaningful carbon insights. So, what are you waiting for? Deploy your own CFA solution accelerator, with Teradata ready to support you every step of the way.
메타데이터
- post_id
- d9f37e95f2d7
- slug
- carbon-footprint-analytics-a-data-integration-story-d9f37e95f2d7
- url
- https://medium.com/teradata/carbon-footprint-analytics-a-data-integration-story-d9f37e95f2d7
- canonical_url
- https://medium.com/teradata/carbon-footprint-analytics-a-data-integration-story-d9f37e95f2d7
- author_url
- https://medium.com/@gregory.leduc
- status
- ok
- fetched_at
- 2026-06-09 15:37:30