An Ultimate Guide to Heart Sound Analysis, Part 4: Hearing for Heart Sound Analysis, Its Strengths…
About 25 years ago, as a young medical doctor, I bought my first expensive stethoscope. The first time I placed its chest piece over a…
An Ultimate Guide to Heart Sound Analysis, Part 4: Hearing for Heart Sound Analysis, Its Strengths and Limitations
About 25 years ago, as a young medical doctor, I bought my first expensive stethoscope. The first time I placed its chest piece over a patient’s heart, I expected to hear something new, bright, loud, clear murmurs and gallops. But I heard the same soft, dull sounds as through my old Sprague-Rappaport stethoscope. Why? Because that’s the nature of heart sounds: they’re soft and dull. They’re different compared to the human voice and music we’re familiar with.
There are three main tools for heart sound analysis:
- Hearing
- Visualization
- AI and other algorithms
Hearing is a very powerful tool. Nearly all known acoustic symptoms of heart disease were discovered by the human ear. To be efficient, we need to know what can be detected by hearing and what can’t, and how to compensate for the “blind spots” of hearing with sound visualization. By the way, we also need to compensate for the blind spots of sound visualization with hearing, ironically.
Hearing Sensitivity
Simplifying things, we can say that sound is all vibrations detectable by the human ear. Generally, we can detect vibrations in the range of 20–20,000 vibrations per second, or Hertz. Below 20 Hz is infrasound; above it is ultrasound. Both are outside our hearing perception.
Hearing sensitivity isn’t constant across the entire audible frequency range. It’s obvious: it’s impossible to imagine that we can easily hear a 20 Hz sound but not a 19 Hz one. Human hearing sensitivity is maximal somewhere between 2,000 and 5,000 Hz, and it gradually decreases toward both extremes of the audible range, where sensitivity becomes zero.
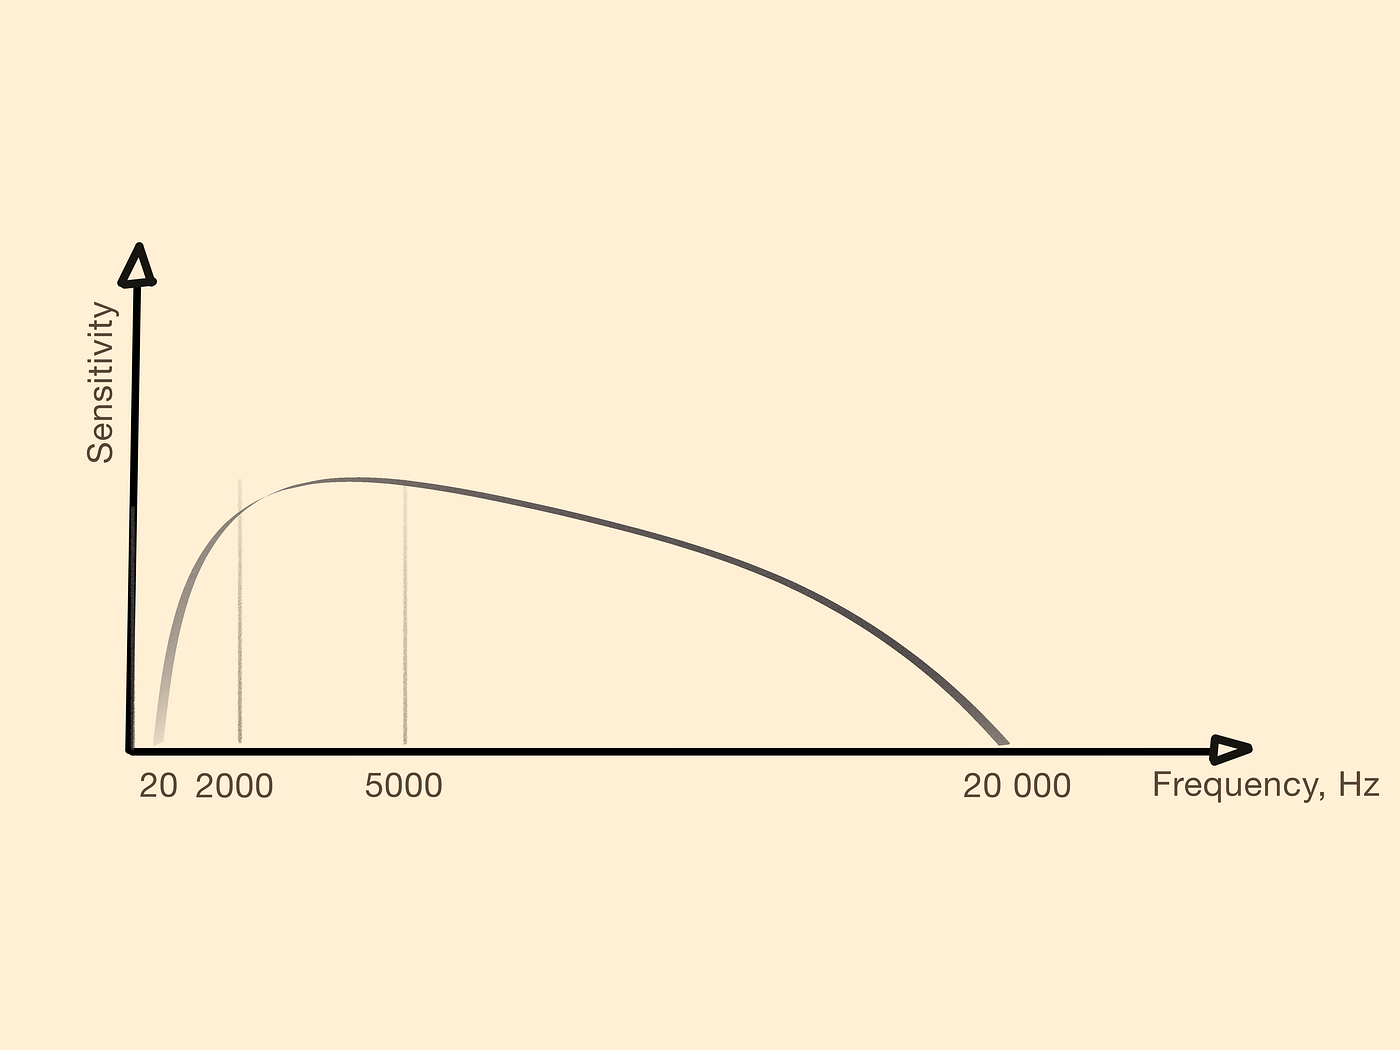
This is a theoretical plot of human hearing sensitivity. It’s maximal approximately between 2,000 and 5,000 Hz and decreases in both directions, becoming zero around 20 and 20,000 Hz. It’s not obligatory, but if you want to dive deeper, read on. To the best of my knowledge, there are no specific units for sound sensitivity. Hearing sensitivity can be measured by detecting the lowest loudness that can be heard across the frequency spectrum. The shape of this threshold plot is the inverse of the current one, U-shaped. To simplify, I used a theoretical sensitivity curve.
Now we’ll focus only on the heart sound frequency range, which is in the left part of the plot above. Here, our ears’ sensitivity is near zero around 20 Hz and rises dramatically with increasing frequency. It’s still very low below 50 Hz, noticeably better around 100 Hz, and pretty high above 400 Hz. For comparison, sensitivity around 500 Hz is about 4,000 times higher than around 50 Hz. I can’t promise absolute accuracy on this claim, but anyway, it’s extremely higher.
Heart sounds nearly never go beyond 2,000 Hz. Actually, many digital stethoscopes, including the most advanced and expensive models, operate in the range below 2,000 Hz. It’s a very unnatural frequency range for us. Here is a short part of my music: the first 10 seconds is the original sound between 20 and 20,000 Hz; the second fragment was filtered to the frequency range of 20–2,000 Hz; the third one was filtered to the frequency range of 20–500 Hz, and the last one was filtered to the frequency range of 20–200 Hz.
[embed]

The frequency filters used for this musical example.
Power Distribution in Heart Sounds
The amplitude or power of heart sound vibrations has the opposite distribution: it’s maximal in the lower frequency range and gradually decreases with increasing frequencies. This is very generalized and approximate, but in my opinion, about 80–90% of heart sound power is below 200 Hz. In most cases, the amplitude of vibrations around 500 Hz is very small, but due to our phenomenal ear sensitivity, we can hear these tiny vibrations efficiently. They can even be perceived as louder than vibrations around 100 Hz, despite the fact that 100 Hz vibrations can be many times more powerful.

Here is a spectrogram of a heart sound obtained by Stethophone. S1 and S2 were detected and labeled by its AI-algorithm. Note that the lowest frequencies have the maximal power, and as frequency rises, amplitude decreases. The first shape depicts a very simplified power distribution across the heart sound frequency range; the second one shows hearing sensitivity distribution.
Comparing Hearing and Sound Visualization
The higher the wave amplitude, the more likely it is to be detectable on a spectrogram or oscillogram. The higher the frequency and amplitude of a heart sound vibration, the more likely it is to be heard. Lower frequencies in heart sounds have large amplitudes and are easily noticeable on the spectrogram, but they’re barely heard. High frequencies can be unnoticeable on the spectrogram and oscillogram but still audible.
Our ears are the most efficient tool for detecting small, high-frequency vibrations — like aortic regurgitation murmurs, for example. Our ears can easily miss low-frequency symptoms, which can be easily detected on a spectrogram.

Here is an example of a heart sound containing two signs: a midsystolic click from mitral valve prolapse (arrow) and an S4. The S4 is clearly visible on the spectrogram and oscillogram, but was not heard. The click has very small amplitude, but it was detectable by hearing. The click is unnoticeable on the oscillogram due to very low amplitude but detectable on the spectrogram. This spectrogram was obtained by comercially unavailable software.
Back to the story that opened this article.
Our hearing sensitivity sets the hard limits of what a conventional (acoustic) stethoscope can reveal, but it doesn’t limit a digital one in the same way. Digital stethoscopes can make heart sounds more detectable by using advanced filtering, real-time sound visualization, and AI-powered algorithms.
메타데이터
- post_id
- da0a3df2f13e
- slug
- an-ultimate-guide-to-heart-sound-analysis-part-4-hearing-for-heart-sound-analysis-its-strengths-da0a3df2f13e
- url
- https://medium.com/@ivshpakiv/an-ultimate-guide-to-heart-sound-analysis-part-4-hearing-for-heart-sound-analysis-its-strengths-da0a3df2f13e
- canonical_url
- https://medium.com/@ivshpakiv/an-ultimate-guide-to-heart-sound-analysis-part-4-hearing-for-heart-sound-analysis-its-strengths-da0a3df2f13e
- author_url
- https://medium.com/@ivshpakiv
- status
- ok
- fetched_at
- 2026-06-29 01:02:39