Time Series 11 — SARIMA (Seasonal ARIMA) Theory
Many real-world time series contain seasonal patterns. These patterns repeat after a fixed interval.
Time Series 11 — SARIMA (Seasonal ARIMA) Theory
Many real-world time series contain seasonal patterns. These patterns repeat after a fixed interval.
Examples:
- Ice cream sales increase every summer
- Electricity usage rises every winter
- Website traffic increases during weekends
Standard ARIMA models can capture trends and correlations but do not capture explicitly model seasonality. To solve this problem, we use SARIMA
What is SARIMA?
SARIMA stands for:
Seasonal AutoRegressive Integrated Moving Average
It is an extension of ARIMA that includes seasonal components.
SARIMA can model:
- regular time dependencies
- seasonal patterns

Example
Suppose we want to forecast monthly airline passengers.
The data contains:
- upward trend
- yearly seasonality
We might use:
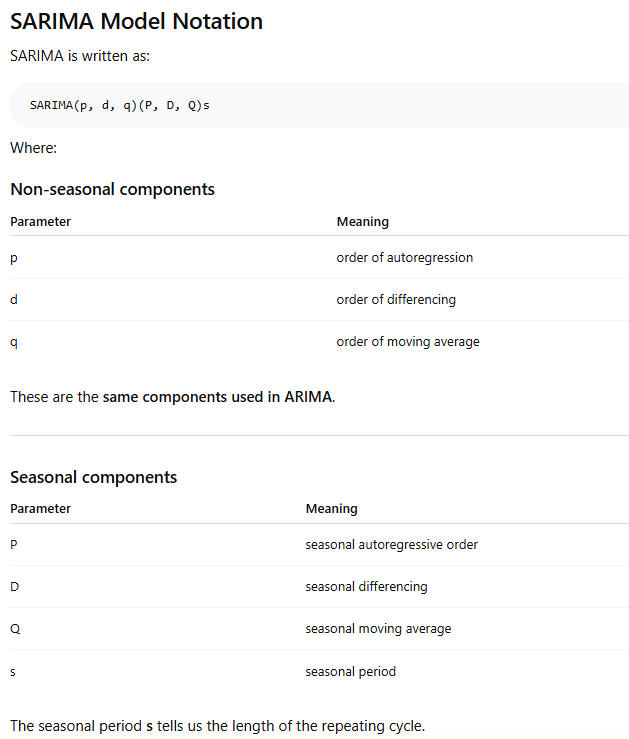
SARIMA(1,1,1)(1,1,1)12Meaning:
Non-seasonal:
- AR = 1
- differencing = 1
- MA = 1
Seasonal:
- seasonal AR = 1
- seasonal differencing = 1
- seasonal MA = 1
- seasonal cycle = 12 months
What Happens When Multiple Seasonalities Exist?
Many real-world datasets have more than one seasonal pattern.
Example: Website traffic
- daily pattern
- weekly pattern
- yearly pattern
The problem is:
SARIMA can only model ONE seasonal cycle at a time.
So we must choose one value of s.
Example:
SARIMA(p,d,q)(P,D,Q)7This captures weekly seasonality but ignores yearly seasonality.
The SARIMA equation contains only one seasonal operator
This means the model can only difference and model one seasonal lag.
If multiple seasonal cycles exist, SARIMA becomes insufficient.
When Should You Use SARIMA?
SARIMA is useful when:
- data shows clear seasonality
- seasonal patterns repeat regularly
- the dataset is reasonably stable
Limitations of SARIMA
Like ARIMA, SARIMA also has some limitations.
1. Assumes linear relationships
The model assumes the series is a linear combination of past values and errors.
Complex nonlinear patterns may not be captured well.
2. Requires parameter tuning
Choosing the correct values for:
p, d, q, P, D, Qcan be difficult.
Analysts typically use:
- ACF and PACF plots
- AIC/BIC model selection
3. Struggles with multiple seasonalities
SARIMA models one seasonal cycle at a time.
Example:
- daily pattern
- weekly pattern
- yearly pattern
To model multiple seasonalities we often use:
- TBATS
- Prophet
- Advanced deep learning models
4. Sensitive to structural changes
If the dataset suddenly changes due to:
- economic shocks
- pandemics
- policy changes
The SARIMA model may perform poorly.
메타데이터
- post_id
- db92baa1cb83
- slug
- time-series-11-sarima-seasonal-arima-theory-db92baa1cb83
- url
- https://medium.com/@abhishekjainindore24/time-series-11-sarima-seasonal-arima-theory-db92baa1cb83
- canonical_url
- https://medium.com/@abhishekjainindore24/time-series-11-sarima-seasonal-arima-theory-db92baa1cb83
- author_url
- https://medium.com/@abhishekjainindore24
- status
- ok
- fetched_at
- 2026-07-13 20:16:07






