Designing Data Map Architecture for Strategic Modeling: Multi-Calendar Data Flow
We had different sub-models, a parent consolidation, a ASO reporting cube . This is how we wired five source systems into a 10-year…
Designing Data Map Architecture for Strategic Modeling: Multi-Calendar Data Flow
We had different sub-models, a parent consolidation, a ASO reporting cube . This is how we wired five source systems into a 10-year strategic model using data maps, model-to-model moves, and Groovy to run it all automatically.
Quick recap
- Converted Module → Custom mode — one-way, sandbox-first
- One ASO cube (SM_REPORTING) inside Planning — all models push into it
- Separate sub-models — SM_MAIN, SM_NORTH, SM_SOUTH, SM_WEST, SM_ONLINE, SM_PARENT
- Different scenarios, identically named across all sub-models for Scenario Rollup to work
- Input/Output view separation enforced — campus CFOs never touch calculated accounts directly
📍 The Problem
The architecture was sound. Every formula was correct. Scenario Rollup was configured. The Board-level output views were beautifully structured. And when we opened the 10-year summary for the first time in front of the client’s VP of Finance, every single cell showed zero.
Different source systems. Different campuses. Eight years of actuals and planning data. None of it had moved anywhere. We needed to design a data pipeline that could take financial data from the operational Planning cubes, move it correctly into each Strategic Modeling sub-model, and then push calculated results into the shared ASO reporting cube all without breaking the calendar offsets, dimension mappings, or load sequence order.
What a Data map Is — And What It Is Not
Before building anything, the team needed alignment on what a data map actually does because it is frequently confused with a standard EPBCS data load and they are fundamentally different things.
A standard data load in EPBCS moves data from an external flat file or source system into a Planning cube. It is inbound, file-based, and typically runs through Data Integration or Data Management. It is for loading raw actuals from an ERP or a CSV export.
A data map in Oracle Strategic Modeling is a model-to-model data movement rule. It defines how data flows between Planning cubes from one ASO cube to another ASO cube, from a ASO cube to the Strategic Modeling engine, or from Strategic Modeling calculated results into the ASO reporting cube. No flat files. No external systems. Internal Oracle EPM pipeline only.
The Complete Data Flow — FIN_RPT to SM_ASO
Here is the full Data Flow architecture we designed. Every arrow in this diagram represents a configured data map or data push with explicit member mapping, period mapping, and load sequence rules.
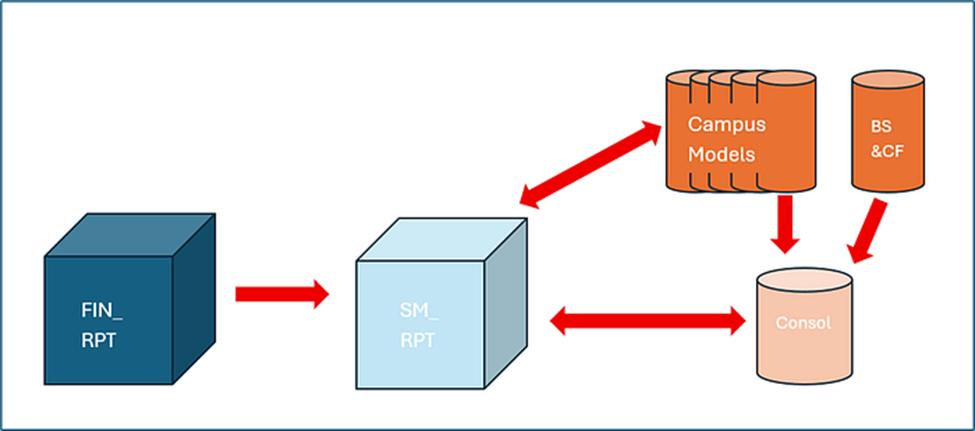
Designing Data Maps for Strategic Modeling Data Flow
Designing Data Maps for Strategic Modeling starts with understanding how Planning cubes connect to downstream targets and how that connection is configured within the application.
In the initial setup, as shown in the first screenshot, the Data Map definition begins by selecting a source cube, which represents the origin of the data within Planning. This is typically a reporting or consolidation cube where validated data resides.

The target selection, however, is more flexible and highlights an important capability Data Maps can point not only to other cubes but also to multiple reporting or ASO cubes, and more importantly, to Strategic Modeling constructs. The dropdown of available targets reflects all eligible cubes and model-based targets, giving the flexibility to route data based on business needs.

Moving further, the configuration evolves from a simple cube-to-cube mapping into a more specialized setup when Strategic Modeling is involved. As seen in the next view, instead of just selecting a cube, the target shifts to a model-based selection, where you explicitly choose the Strategic Modeling model that will receive the data. This introduces an additional layer of abstraction, because unlike cubes, models are designed for long-term financial projections and structured differently. The mapping here ensures that data from a Planning source (like a central or reporting cube) is aligned correctly with a specific model, such as a business unit or functional model.

Finally, the detailed configuration screen demonstrates how dimensions are aligned between source and target. For example, the model mapping (e.g., Central to a specific model like Athletics) shows how Planning entities or structures are directed into corresponding Strategic Modeling models. Similarly, account mappings ensure that detailed Planning accounts are correctly tied to the appropriate line items in the model. This step is critical because Strategic Modeling does not always follow the same dimensional hierarchy as Planning, requiring careful alignment and, in some cases, transformation.

The Source-to-Target mapping acts as a translation layer that aligns two different data structures. In the Account mapping, granular source data (like specific grants) is funneled into broader strategic targets, often using mathematical operators to aggregate multiple line items into a single driver-based account. This ensures the strategic model stays high-level without losing the underlying financial detail required for accurate baseline reporting.

In the Time mapping, the process resolves structural differences between how each system tracks history. While the source might use a single combined string for time (e.g., “1Q26”), the target configuration splits this into two distinct dimensions: Period (the quarter) and Year (the fiscal year). This specific mapping ensures that every data point from your operational plan lands in the correct “time bucket” within the long-range model, allowing for seamless historical comparisons and future projections.

Navigating to Model Data Map Settings
To initiate the integration process, you first right-click the desired model to bring up the action menu and select Properties. This step is essential for accessing the backend configurations where the model’s relationship with other data targets is defined. By selecting this option, you move beyond simple data entry and begin the process of linking your Consolidated model to the broader reporting environment, setting the stage for automated data synchronization.

Adding Data maps into Strategic Models
Within the model settings, the Data Maps tab is where you actively manage which integrations are active for your specific file. To add a Data map into the model, you simply identify the required map from the Available Data Maps list on the left and move it to the Associated Data Maps list on the right. This association tells the system exactly which data flows such as Revenue or OpEx transfers are relevant to this model, ensuring that only the necessary data points are packaged for movement during the model’s lifecycle.
The most efficient way to maintain data consistency is to configure the assigned Data map to run while the model is being checked in. In the Associated Data Maps section, you must set the Run On column to Check In for each map you have added. By doing this, the system triggers an automatic data push the moment a user saves their changes and releases the model lock. This ensures that the target reporting cubes are updated in real-time without requiring any extra manual steps from the user, making the “Check-In” process the definitive point of synchronization for the entire organization.

Securing Model Integrity via User Permissions
Before a model can be effectively managed or synchronized via data maps, proper access controls must be established within the Permissions tab. This interface allows administrators to define exactly who can check out a model and trigger the associated data maps. By assigning roles such as Modeler, Analyst, or Viewer, you control the level of interaction a user has with the Consolidated model. For instance, only users with “Modeler” or “Owner” permissions typically have the authority to perform a “Check-In,” which in turn executes the automated data maps. Setting the “Default” access to “No Access” ensures that sensitive financial logic and data synchronization triggers are protected, allowing only authorized personnel to influence the consolidated results.

Key Takeaways: Data Maps & Security in Strategic Modeling
Automated Accuracy: Setting Data Maps to Run on Check-In guarantees that reporting cubes are updated automatically, eliminating manual errors and ensuring data consistency across the enterprise.
Synchronized Workflows: Associating multiple maps to a single model allows for a “one-click” update of Revenue, Expenses, and Balance Sheet data simultaneously upon model finalization.
Authorized Execution: Strategic security ensures only Modelers and Owners can trigger data movements. This prevents unauthorized users from pushing incomplete or unverified data to target applications.
Integrity Protection: By setting default permissions to No Access, you protect sensitive financial logic and ensure that only designated administrators can modify Data Map associations or model structures.
Inherited Governance: Leveraging Global Permissions simplifies administration, ensuring that user access remains compliant with corporate security policies while streamlining the model check-in process.
메타데이터
- post_id
- dca3d5df0ab4
- slug
- designing-data-map-architecture-for-strategic-modeling-multi-calendar-data-flow-dca3d5df0ab4
- url
- https://medium.com/@venkatasiva600/designing-data-map-architecture-for-strategic-modeling-multi-calendar-data-flow-dca3d5df0ab4
- canonical_url
- https://medium.com/@venkatasiva600/designing-data-map-architecture-for-strategic-modeling-multi-calendar-data-flow-dca3d5df0ab4
- author_url
- https://medium.com/@venkatasiva600
- status
- ok
- fetched_at
- 2026-06-09 15:37:30