Assessing Target Tractability: A Hands-On KNIME Workflow Powered by UniProt, ChEMBL, PDB, and Open…
Applied to an ADOA Case Study
DATA STORIES | CHEMINFORMATICS | KNIME ANALYTICS PLATFORM
Assessing Target Tractability: A Hands-On KNIME Workflow Powered by UniProt, ChEMBL, PDB, and Open Targets Data
Applied to an ADOA Case Study
Co-authors: Peter Wright, Triin Tammsalu
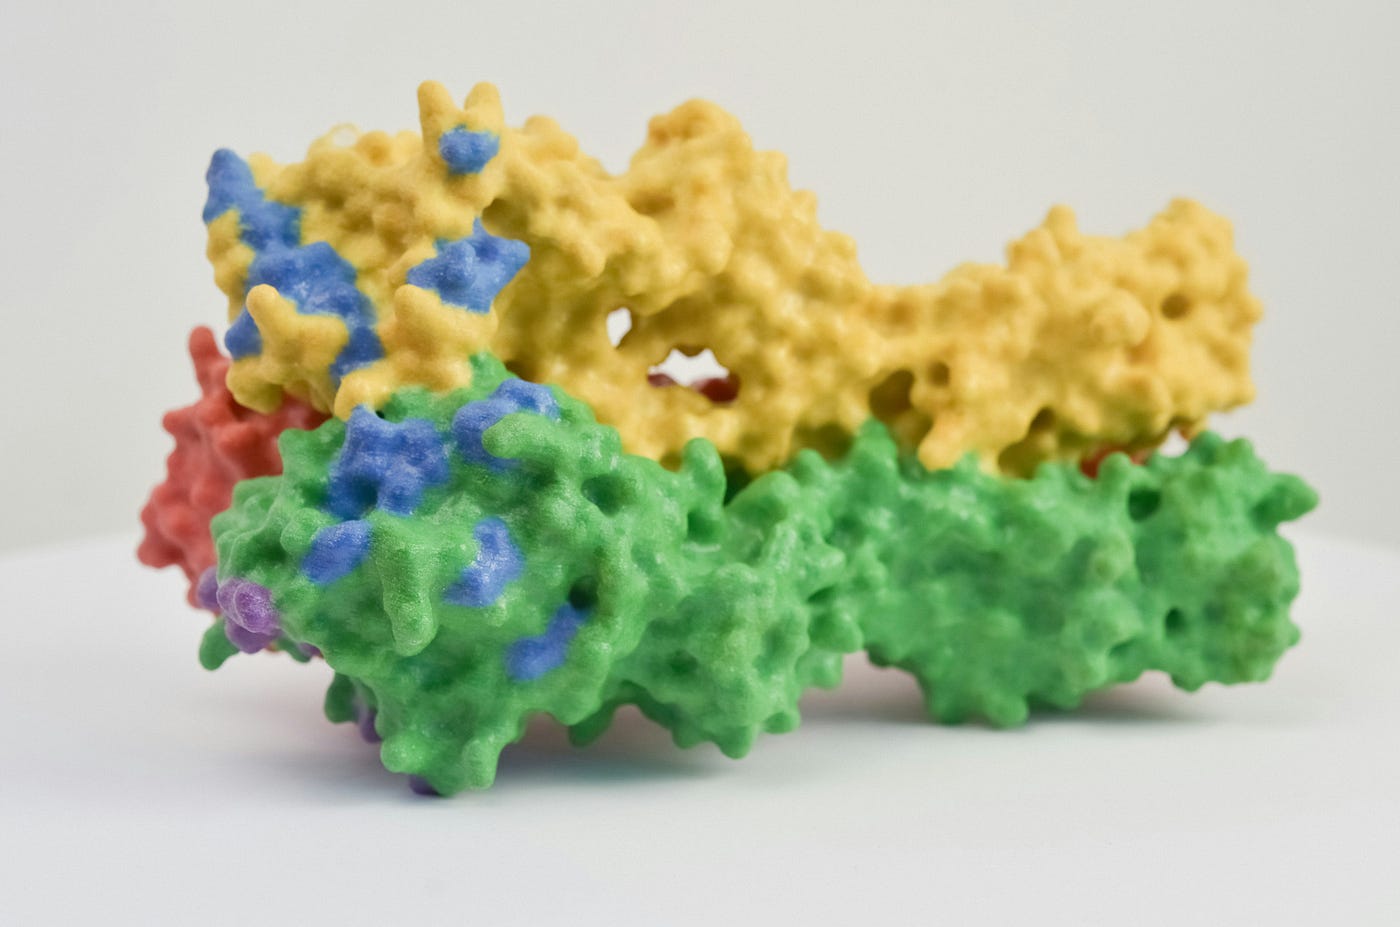
Photo by National Institute of Allergy and Infectious Diseases on Unsplash.
Table of Content
· Introduction · Workflow description ∘ Target input ∘ Target Functional and Expression Data ∘ Target Druggability Data ∘ Target Druggability Data Visualisation · How to Run the Workflow · How to use the workflow for decision-making — an ADOA example · Acknowledgements
Introduction
Once a prioritised list of potential drug targets is identified in a disease project, a critical subsequent step is to thoroughly evaluate both their practical tractability and commercial viability. This comprehensive assessment is essential before committing to the significant resources required for lower-throughput and higher-cost in vitro and in vivo testing for efficacy and safety. Key data points for this evaluation include the expression of potential targets in the tissue of interest, availability of well-characterised chemical probes to assess assay specificity, a deep understanding of “prior art” regarding the target’s use in human clinical trials (including specific drugs and indications), the presence of crystal structures to inform New Chemical Entity (NCE) development by identifying ligand binding sites, and the existence of substantial binding data from biochemical assays and/or functional data from cell-based assays to facilitate Quantitative Structure-Activity Relationship (QSAR) model building for NCE optimisation. These insights collectively inform strategic decisions, ensuring that resources are directed towards targets with the highest likelihood of successful development and market impact.
For such a necessity, at Healx we developed the ***Target Tractability Information Retrieval*** workflow that leverages data from UniProt, Protein Data Bank (PDB), Human Protein Atlas (HPA), Open Targets, and ChEMBL.
To illustrate the real-world application and benefits of the Target Tractability Information Retrieval workflow in drug discovery, we present a case study on a disease that is aligned with Healx’s mission to develop new treatments for underserved rare disease patients, Autosomal Dominant Optic Atrophy (ADOA). ADOA is a rare, genetically-inherited neuro-ophthalmic condition that is characterised by progressive, irreversible sight loss or impairment that affects 1/10,000 to 1/35,000 people worldwide (Lenaers et al., 2012; Orphanet database). The disease primarily affects the Retinal Ganglion Cells (RGCs) and their axons that form the optic nerve and transmit visual information from the eye to the brain. The vision problems experienced by people with ADOA are caused by genetic mutations, most often in the OPA1 gene, that lead to mitochondrial dysfunction and ultimately result in the degeneration of the optic nerve (Lenaers et al, 2012). For the purposes of this blog post we utilise a shortlist of 10 potential targets for ADOA selected based on an in vitro screen by Cretin et al. (2021). Specifically, the authors identified 91 genes whose siRNA knockdown improved the mitochondrial integrity of OPA1-deficient patient fibroblasts and the 10 selected genes showed the highest percent of mitochondrial rescue. However, the screen was based on patient fibroblasts, so it is of the utmost importance to demonstrate that the potential targets are expressed in disease-relevant tissue.
The presented workflow is designed to retrieve information that helps to prioritise targets for ligand- or target-based drug discovery, including NCE development and in vitro assay development. In each section we will explain how the extracted information — ranging from the availability of chemical probes and prior clinical trial data to crystal structures and extensive binding and functional assay data — provide crucial insights that significantly enhanced decision-making, demonstrating how these data points can directly inform strategic choices and resource allocation in drug discovery.
Workflow description
The KNIME ***Target Tractability Information Retrieval*** workflow can be divided into three main parts:
- Target input
- Target functional and expression data
- Target druggability data
In the following text, we will refer to target tractability as the overall feasibility of successfully modulating a biological target, encompassing biological, chemical, and technical factors, and to target druggability as the specific likelihood that a target possesses binding sites suitable for interaction with drug-like molecules.
Target input
In this first part of the workflow, users define a list of biological targets for which they want to retrieve data to support tractability evaluation; this means assessing each target’s potential to be modulated by therapeutic compounds.
The workflow accepts two types of target identifiers:
- UniProt accession codes
- Gene symbols (HGNC-compliant)
After selecting the preferred identifier type, users can input their target list in one of two ways: by uploading a file or by entering identifiers directly into an embedded text editor within the application interface.
If users choose to upload a file, the workflow supports several standard tabular formats, including CSV, TSV, XLSX, and XLS. After uploading, users must select the column containing the target identifiers. When entering identifiers directly, each one should be placed on a separate line.
The workflow currently handles up to 500 targets; however, processing time can increase significantly as this limit is approached depending on the amount of available data for each target.
Target Functional and Expression Data
After defining the target list, the workflow uses two custom KNIME components developed in-house to retrieve and display functional and expression data for each target.
The first component, *UniProt Accession or Gene to Target Info*, retrieves data from UniProt via a GET request using the selected identifiers (UniProt accessions or HGNC gene symbols). By default, it returns only manually reviewed proteins with evidence at the protein level, which is recommended for this workflow. However, these settings can be adjusted to include entries with lower evidence levels (e.g., transcript-level evidence, inferred from homology, predicted) or unreviewed entries as needed.

Fig 1: Configuration dialog of the UniProt Accession or Gene to Target Info component.
The following target data are retrieved from UniProt and Human Protein Atlas, and displayed in either the component’s Interactive View (within the KNIME Analytics Platform) or on the WebPortal page (when the workflow is deployed as a web app):
- IDs: UniProt accession, Ensembl Gene ID, gene name and its synonyms, recommended protein names and its alternatives.
- Protein existence
- Functional data: function, subunit, subcellular location
- Expression data: induction details (expression conditions and stimuli impacting protein levels), links to the Human Protein Atlas providing the expression levels across tissues, cell types, subcellular locations, human cancers and common cell lines
- Disease information: ID, accession, description, evidence code, evidence source, evidence ID

Fig 2: Target functional and expression data as shown in the Interactive View/WebPortal page.
Users can review the functional and expression data and select the targets they are interested in (all are pre-selected by default). Selected targets are then forwarded for druggability data retrieval, offering insights into their suitability for drug development.
Target Druggability Data
Once users have selected targets of interest, they can choose related target types for druggability data retrieval. Available types include protein complex, protein-protein interaction, protein family, protein complex group (a loosely defined complex with unclear subunits), and chimeric protein as defined in ChEMBL. For example, if “protein complex” is selected, all complexes containing the input protein bound with others will be retrieved. The single protein type is always selected by default.

Fig 3: WebPortal/Interactive View dialog for selecting target types to retrieve druggability data.
Druggability data is retrieved from three main sources:
- ChEMBL
- Protein Data Bank (PDB)
- Open Targets (the licensing statuses of individual Open Targets data sources are available from the Open Targets Licence section).
1. Data from ChEMBL
ChEMBL data is essential for estimating ligand-based target tractability. In this workflow, it is retrieved using a set of in-house developed ChEMBL KNIME components that connect to a running instance of the ChEMBL database (see the “*How to run the workflow*” section for details).

Fig 4: Workflow section showing the retrieval of data from the ChEMBL database.
The *ChEMBL UniProt Accession to Target Info* component retrieves basic target information from ChEMBL using UniProt accession codes. Although it primarily targets single proteins, its configuration dialog allows retrieval of data for additional target types (see Fig. 3).

Fig 5: Component retrieving target data from ChEMBL using the target’s UniProt accession.
The target ChEMBL ID obtained from this component is then used to retrieve other essential druggability data.
The *ChEMBL MOA-Indication From Target Retrieval* component extracts Mechanism of Action (MOA) and indication information for input targets identified by ChEMBL IDs. It provides summaries and detailed data on associated approved and investigational drugs, including their development phases, therapeutic uses, and relevant references.

Fig 6: Component retrieving target Mechanism of Action and Indication data from ChEMBL.
The *ChEMBL Activity From Molecule Retrieval* component connects to the ChEMBL database to retrieve and aggregate activity data for specified small-molecule ChEMBL IDs. It provides both averaged activity values with statistics and individual activity records with source references. In this workflow, it is used to determine the activity of approved and investigational drugs linked to the targets of interest. For example, it can retrieve the binding affinity of tolrestat to Human Aldose Reductase as an IC50 value of 18.2 ± 14.6 nM, enabling detailed evaluation of drug-target interactions.

Fig 7: Dialog of the ChEMBL Activity from Molecule Retrieval component, where different minimum target association scores can be set.
The *ChEMBL Activity Type Retrieval (Batch) *component fetches detailed information on the biological activity types available for a given target, identified by its ChEMBL ID and mutation pair. This allows users to gain an overview of the kinds of assays and activity metrics reported for a target. For instance, it reveals that for Human Aldose Reductase, there are activity data reported for 455 distinct compounds with Binding IC50 (nM) values and 63 distinct compounds with Binding Inhibition (%) values. Such information is valuable for assessing the explored Structure-Activity Relationship (SAR) space and can support the development of predictive QSAR models.

Fig 8: Component retrieving available target activity types from ChEMBL.
Finally, the workflow retrieves the number and names of chemical probes associated with each target through our component called *ChEMBL Chemical Probes from Target Retrieval*. The definition of “chemical probe” follows the criteria used in ChEMBL, which sources definitions from chemicalprobes.org and probes-drugs.org. Chemical probes are linked to a target only if they have a documented MOA relationship with the target or exhibit a potency of ≤ 1 µM.

Fig 9: Component retrieving available chemical probe information associated with targets.
2. Data from PDB
Data from the Protein Data Bank (PDB) is critical for assessing structure-based (or target-based) druggability. This workflow employs the *PDB UniProt Accession to Structure* component, a KNIME component developed in-house, to retrieve this data. It connects to the PDBe web service to obtain structure information based on UniProt accession codes and provides detailed records for each structure, as well as summaries for each target.

Fig 10: Workflow section showing the retrieval of data from the PDB database.
3. Data from Open Targets
In addition to detailed ligand-based and structure-based tractability data from ChEMBL and PDB, the workflow retrieves general tractability data from the Open Targets web service. This is done via the *Open Targets Target Tractability Retrieval*, an in-house KNIME component that uses Ensembl gene IDs to obtain small-molecule tractability information. It provides insights based on structural data, ligand quality, druggability scores, and druggable family classifications.

Fig 11: Workflow section showing the retrieval of data from the Open Targets database.
Target Druggability Data Visualisation
After gathering druggability data from all sources, the information is consolidated and presented on a single interactive page. This page summarises diverse data related to each target:
- Associated Mechanisms of Action (MOA) and related diseases/therapeutic indications
- Approved and investigational drugs: compounds that have reached at least Phase I clinical trials, including their biological activities when available
- Chemical probes: number and names of probes associated with each target
- Compounds per activity type: for each activity type, the number of compounds with known activity against the target
- Experimental target structures and ligands from PDB
In the top-left corner, a sunburst chart displays the number of approved and investigational drugs, breaking down each target-MOA pair by organism, target type, name, variant, mechanism of action, highest clinical phase and combined indication, and drug count and phase categories.
On the top-right, a set of widgets allows users to filter data by target type, action type, number of associated drugs, number of indications, and number of available target structures. This functionality is particularly helpful when analysing multiple targets simultaneously.

Fig 12: Target Druggability Data Summary sunburst chart and widgets as shown on the Interactive View/WebPortal page. Data can be analysed interactively by hovering over the sunburst chart and selecting relevant data using the widgets.
At the bottom, a table presents the druggability data, with one row per target-MOA pair. For example, a GPCR target may appear three times with separate data for agonism, antagonism, and partial agonism. Data relevant to the target in general, rather than a specific MOA, is marked with a “(general for target)” suffix in the column headers.
Because the table contains extensive data, a column selector widget is available above it, enabling users to customise which columns are visible.

Fig 13: Column selector for the Target Druggability Summary data table.
We highlight some key data columns, organised by category:
- MOA (per Target-MOA pair): – Maximum clinical phase reached – Number of drugs (approved and investigational) – Disease information: disease name, MeSH ID, disease-specific max clinical phase, and number of disease-specific drugs – Drug activities – Reference URL for the drug’s Mechanism of Action (MOA) – Reference URLs for the drug’s MOA and indication, including maximum clinical phase for Investigational New Drug (IND) status
- Target Ligand-Based Druggability – Available chemical probes for the target, important for providing experimental evidence of target modulation, aiding biological validation and facilitating assay development – Number of compounds with known activity against the target (by activity type), important for indicating the availability of chemical matter for drug development, supporting ligand-based druggability assessment and informing SAR studies including predictive QSAR model development
- Target Structure-Based Druggability – Number of available target structures, broken down by experimental technique – Structural resolution range – Range of entities, ligands and residues present in the structures
- Small Molecule target tractability and tractability description as provided by Open Targets

Fig 14: Section of the Target Druggability Summary data table.
Finally, the results, including both functional and expression data as well as target druggability data, can be exported from the web application as two CSV files.
How to Run the Workflow
The workflow is available here and is almost ready to use. The only thing left to do is set up the ChEMBL DB Connection component in the workflow and make sure it points to a running ChEMBL database. For detailed instructions on configuring this component, as well as steps for setting up ChEMBL itself if needed, see this blog post.
The workflow can be run on a KNIME Hub instance as a web application or locally (via KNIME Analytics Platform) by interacting with the Interactive View of all the components which represent a web page in the application. These components are marked with a workflow annotation in cyan with a “WebPortal” tag.

Fig 15: Example of a component representing a web page in the application. These components are marked with a cyan workflow annotation and tagged with ‘WebPortal’. Running the workflow locally requires user interaction with the Interactive Views of these components.
Please note that the workflow requires an active Internet connection during execution, as it retrieves data in real time from various public databases, including UniProt, PDB, and Open Targets, through their web services. Running the workflow without Internet connectivity may result in errors during these data retrieval steps, impacting its functionality and output.
How to use the workflow for decision-making — an ADOA example
As noted in the introduction, we selected 10 potential targets for ADOA based on an in vitro screening experiment with samples from OPA1-deficient patient fibroblasts (Cretin et al, 2021). Information from the Target Tractability workflow that was used to rank the 10 potential targets is presented in Table 1. Given that ADOA affects primarily the retinal ganglion cells, we used the data from Human Protein Atlas (HPA) to determine whether the potential targets are present in relevant tissues and cell types. We confirmed that all 10 targets are expressed in the human retina, however HPA does not provide information on the retinal ganglion cells. In these situations, we would advise to augment our workflow with data from other lower throughput cell type-specific assays to ensure the target is expressed in the disease-relevant environment. Furthermore, a future addition to the current workflow could include prior selection of tissue and/or cell type of interest to retrieve and visualise the relevant expression information only.

Table 1: Summary of functional and chemical information useful for ranking ADOA targets (see Target Priority Group column) for target- or ligand-driven drug discovery
Next, we noticed that one of the potential targets, AKR1B1, has four inhibitors that have entered clinical trials in the past (Table 1). All four compounds have progressed beyond phase 1 in at least one indication and reviewing the data associated with those studies (direct links provided by the workflow) could provide critical information on the safety of AKR1B1 inhibition. Notably, none of these compounds have been trialled for ADOA, highlighting the novelty of these targets. Meanwhile, the AKR1B1 inhibitor sorbinil has been tested for diabetic retinopathy, which is another medical condition that causes retinal damage and thus suggests a promising ADME (Absorption, Distribution, Metabolism, and Excretion) profile in the relevant tissue. Further investigation of sorbinil preclinical and clinical data could reveal whether this drug has the potential to be repurposed for the treatment of ADOA.
In addition to AKR1B1, chemical probes are available for another potential target HSP90B1 (Table 1). Availability of selective chemical probes facilitates in vitro screening by providing molecules with known activity against the protein of interest. They are essential tools for assay development and enable the assessment of target engagement and functional responses, thereby supporting the biological validation and guiding medicinal chemistry efforts. Furthermore, AKR1B1 and HSD17B10 have adequate binding and functional data from biochemical or cell-based assays which can be used for the development of predictive QSAR models to guide virtual screening and lead optimisation efforts. An example of these data are quantitative ligand-binding data such as the IC50 values that provide essential information on the potency and affinity of compounds for the target. However, an in-depth evaluation of the quality of these data is recommended where further prioritisation among the targets is the objective. In contrast, HSP90B1 and SLC11A2 have limited binding and functional data, making it challenging to develop predictive QSAR models. However, these data can still be utilised with other ligand-based techniques, such as defining the pharmacophore models for these targets.
Finally, the availability of target structures, ideally in co-crystals with a ligand, enables virtual screening techniques such as molecular docking to identify and prioritise ligand candidates. Structural insights allow rational optimisation of ligands to improve potency, selectivity, and safety profiles, accelerating lead discovery and design. Importantly, this information was available for all but two potential targets. However, the structural information in individual databases can sometimes be incomplete, which is why we consider data from several resources. We also recommend evaluating the quality of the structural data, especially if further prioritisation among these targets is of interest.
Overall, we have used the data presented in Table 1 to rank the 10 potential targets for ADOA and provided an example of how one might decide which targets to take forward for further assessment based on assay throughput and budget requirements.
Acknowledgements
We would like to thank the open data and open source community for providing the data and some of the tools that were used to implement this workflow, without which it would not have been possible. More specifically, we would like to thank the KNIME staff and community, as well as the ChEMBL, UniProt, Protein Data Bank and Protein Data Bank in Europe, Open Targets, Human Protein Atlas, Chemical Probes and Probes & Drugs teams.
메타데이터
- post_id
- dca70f9fb3f0
- slug
- target-tractability-knime-workflow-using-uniprot-chembl-pdb-opentargets-dca70f9fb3f0
- url
- https://medium.com/low-code-for-advanced-data-science/target-tractability-knime-workflow-using-uniprot-chembl-pdb-opentargets-dca70f9fb3f0
- canonical_url
- https://medium.com/low-code-for-advanced-data-science/target-tractability-knime-workflow-using-uniprot-chembl-pdb-opentargets-dca70f9fb3f0
- author_url
- https://medium.com/@giovanni_72624
- status
- ok
- fetched_at
- 2026-07-15 10:26:04