How Eclipses, Retrogrades, and Lunar Cycles Affect Market Volatility
Financial markets move through cycles of optimism, fear, greed, panic, recovery, and speculation. Traders see these cycles through price…
How Eclipses, Retrogrades, and Lunar Cycles Affect Market Volatility
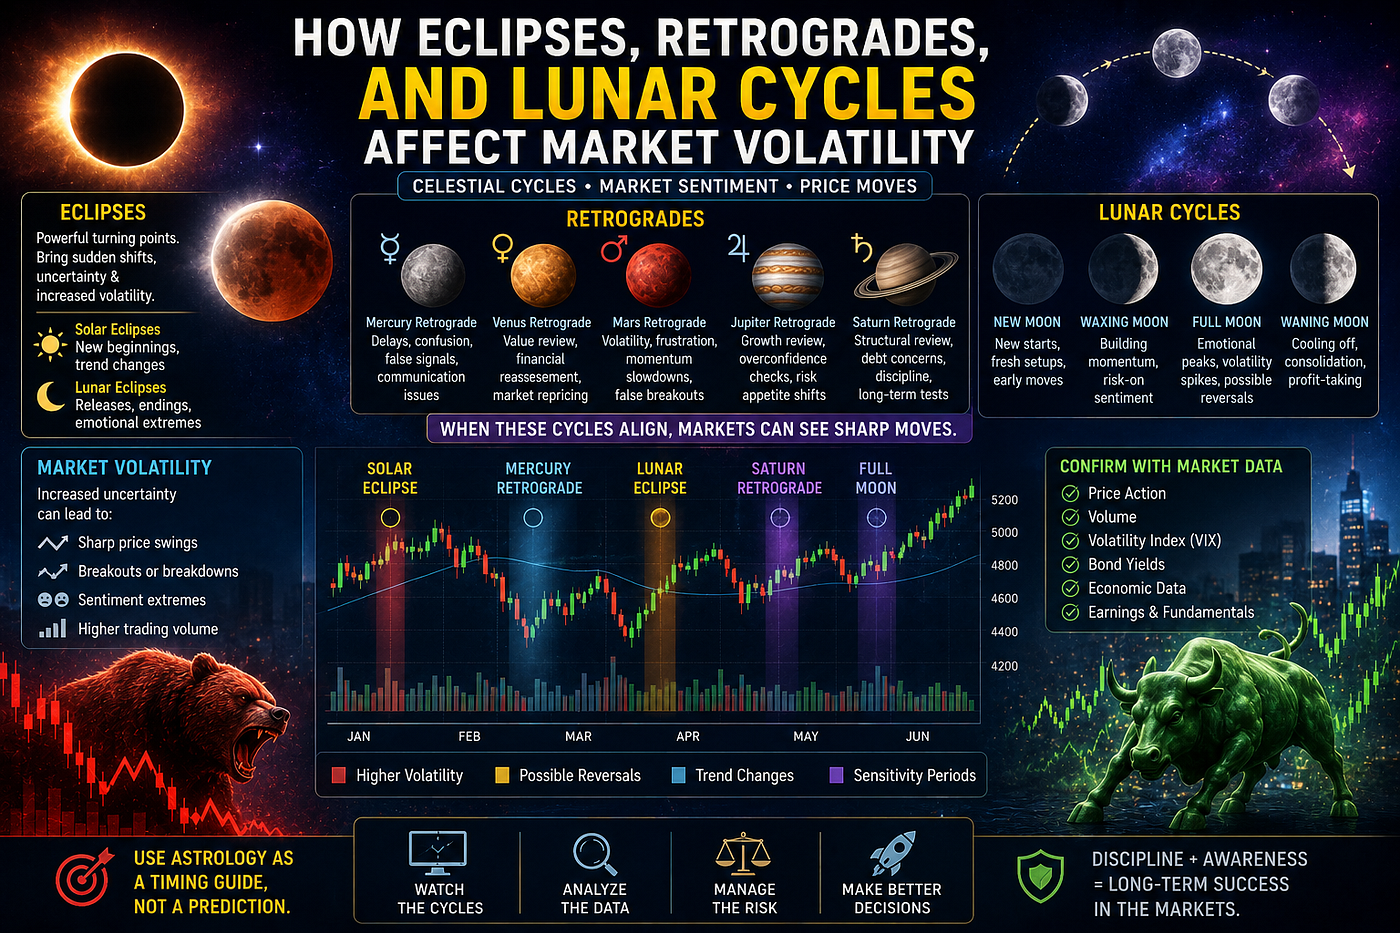
Financial markets move through cycles of optimism, fear, greed, panic, recovery, and speculation. Traders see these cycles through price charts, volume, volatility, bond yields, earnings, liquidity, and macroeconomic data. Financial astrology studies the same emotional rhythm through time, using planetary cycles, eclipses, retrogrades, and lunar phases as timing markers.
The key word is timing.
Eclipses, retrogrades, and lunar cycles do not guarantee that the stock market will rise or fall. They should not be treated as automatic buy or sell signals. However, many financial astrology practitioners use them to identify periods when markets may become more sensitive, emotional, reactive, or volatile.
In today’s market, this topic is relevant because volatility can return quickly. Investors are watching inflation pressure, oil prices, bond yields, artificial intelligence valuations, geopolitical risk, central bank policy, and liquidity conditions. Reuters reported that global shares stumbled while bond yields climbed as inflation worries returned, with the Nasdaq snapping a weekly winning streak and oil prices rising on supply concerns. The IMF’s April 2026 Global Financial Stability Report also warned that financial stability risks remain elevated due to high debt, rollover risks, leverage, and tighter financial conditions.
This is exactly why market timing matters. Financial astrology should not replace market data. Instead, it can help traders and investors ask better questions: when could volatility expand, when could sentiment shift, and when should risk management become more important?
What Market Volatility Really Means
Market volatility measures how sharply and quickly prices move. In calm markets, stocks may trend smoothly with small daily changes. In volatile markets, prices can gap up, reverse suddenly, break support, fail at resistance, or swing aggressively in both directions.
Volatility can be caused by many factors. Inflation surprises, Federal Reserve comments, bond-yield spikes, earnings misses, geopolitical shocks, commodity price movements, currency swings, liquidity stress, and crowded positioning can all increase market instability.
For traders, volatility is both risk and opportunity. Swing traders may use volatility to capture larger price moves. Options traders may watch implied volatility, premiums, and volatility crush. Long-term investors may use volatility to buy quality assets at better prices. However, volatility can also destroy capital when traders use excessive leverage or ignore stop-losses.
Financial astrology studies volatility from a time-cycle perspective. It asks whether certain periods may carry a higher chance of emotional price movement. Eclipses, retrogrades, and lunar cycles are among the most watched timing tools because they connect directly with uncertainty, review, reversal, sentiment, and emotional intensity.
Why Eclipses Matter in Financial Astrology
Eclipses are powerful astrological events because they occur when the Sun, Moon, and Earth align near the lunar nodes. In symbolic terms, eclipses are associated with revelation, acceleration, disruption, endings, beginnings, and turning points.
In financial astrology, eclipse seasons are often studied as volatility windows. This does not mean every eclipse causes a market crash. Many eclipse periods pass without major index damage. However, eclipses may coincide with periods when markets become more reactive to news, sentiment shifts, or hidden risks.
An eclipse can act like a spotlight. It may reveal something the market was ignoring. It may expose weakness in a crowded trade. It may accelerate a trend that was already forming. It may trigger sector rotation, sudden reversals, or emotional price action.
For example, if the market is already overextended, valuations are high, bond yields are rising, and breadth is weakening, an eclipse window may become more important. If the market is healthy, earnings are strong, and liquidity remains supportive, the eclipse may only bring temporary volatility or rotation.
The eclipse itself is not the trade. The market reaction around the eclipse is what matters.
Solar Eclipses and Market Direction
A solar eclipse occurs during a new moon when the Moon passes between the Earth and the Sun. Symbolically, solar eclipses are linked with new beginnings, sudden changes in leadership, and shifts in visibility.
In market terms, solar eclipse periods may coincide with changes in direction, sector leadership, or investor confidence. A trend that looked strong may pause. A weak sector may suddenly attract capital. A major index may break out or fail near a key level. A narrative may change.
For traders, solar eclipses are useful as observation windows. If a stock or index is near resistance during a solar eclipse period, traders may watch whether the breakout confirms or fails. If a market is near support, they may watch whether buyers defend the level or whether selling accelerates.
A solar eclipse can also be relevant for macro themes. If the market is waiting for inflation data, central bank guidance, oil-price developments, or earnings from major technology companies, the eclipse window may increase sensitivity to those events.
Lunar Eclipses and Emotional Extremes
A lunar eclipse occurs during a full moon when the Earth comes between the Sun and Moon. Symbolically, lunar eclipses are associated with emotional intensity, culmination, exposure, and release.
In financial astrology, lunar eclipses are often linked with emotional extremes. A market may reach a short-term high or low. A trend may exhaust itself. Traders may become overly bullish or overly fearful. Volatility may rise as investors react strongly to news or price movement.
Lunar eclipses can be especially relevant for assets driven by emotion and speculation, such as crypto, high-beta technology stocks, meme stocks, small caps, gold, silver, and commodities. These markets often respond sharply when sentiment changes.
Again, a lunar eclipse should not be used alone. A trader should combine it with price action. If a stock rises aggressively into a lunar eclipse while RSI is overbought and volume weakens, it may be time to protect profits. If a stock falls sharply into a lunar eclipse but holds major support with bullish divergence, it may become a reversal candidate.
The eclipse marks timing. The chart confirms the setup.
Why Retrogrades Are Linked With Market Reassessment
Retrograde motion is an apparent backward movement of a planet from Earth’s perspective. In astrology, retrogrades are linked with review, delay, revision, confusion, correction, and unfinished business.
In financial markets, retrogrades are often studied as periods when investors may reassess expectations. A trend may slow down. A breakout may need confirmation. A story may be questioned. Earnings assumptions may be revised. Economic data may be reinterpreted. Central bank expectations may change.
Retrogrades are not automatically bearish. A retrograde period can produce rallies, recoveries, or reversals. The main idea is that retrogrades often bring review. Markets may revisit old support levels, retest resistance, correct overextended moves, or reprice earlier assumptions.
For traders, retrogrades suggest caution around certainty. They encourage confirmation before entering large positions. They also remind investors to review risk, rebalance portfolios, and avoid impulsive decisions.
Mercury Retrograde and Trading Confusion
Mercury retrograde is the most famous retrograde, and it is often associated with communication issues, delays, errors, revisions, and mixed signals. In financial markets, Mercury connects with trading, news flow, data, earnings reports, analyst commentary, technology systems, and central bank communication.
During Mercury retrograde periods, traders may see more confusion around economic data, earnings guidance, policy statements, and market interpretation. A stock may react one way to news and then reverse. A breakout may fail. Rumors may spread quickly. Investors may misunderstand data or overreact to headlines.
This does not mean Mercury retrograde always causes market declines. It means traders should be careful with information. They should confirm news, avoid chasing sudden moves, review order execution, and wait for cleaner price action.
Mercury retrograde can be especially important in today’s market because trading is highly data-driven. Inflation reports, jobs data, Federal Reserve language, earnings calls, AI revenue guidance, semiconductor demand forecasts, and oil-price headlines can all move markets quickly.
When Mercury is retrograde, the best trading rule is simple: verify before reacting.
Venus Retrograde and Valuation Reassessment
Venus is associated with value, money, luxury, comfort, assets, and investor preference. In financial astrology, Venus retrograde can be studied as a period of valuation review.
Markets may reassess what they consider attractive. Expensive sectors may come under pressure. Consumer stocks, luxury brands, retail names, financial assets, currencies, and commodities may experience changing sentiment. Investors may question whether an asset is worth its current price.
For long-term investors, Venus retrograde can be useful for reviewing portfolio valuation. Are you paying too much for growth? Are dividends sustainable? Are consumer trends weakening? Are luxury or discretionary stocks showing signs of pressure? Is the market still rewarding quality, or has it shifted toward speculation?
Venus retrograde does not automatically mean a crash. It may simply indicate that investors are rethinking value.
Mars Retrograde and Volatility Fatigue
Mars represents energy, action, aggression, conflict, speed, and momentum. Mars retrograde can reduce direct momentum or create frustration, false starts, delayed action, and unstable aggression.
In market terms, Mars retrograde may coincide with choppy trading, failed breakouts, sudden reversals, or aggressive moves that do not follow through. Traders may become impatient. Momentum strategies may become harder. Conflict-driven assets, crude oil, defense stocks, metals, and high-beta equities may require extra caution.
During Mars retrograde, traders should avoid forcing trades. If price action becomes choppy, position size should be reduced. If breakouts fail repeatedly, waiting may be better than overtrading.
Mars retrograde can be a reminder that not every market environment rewards aggression. Sometimes the best trade is patience.
Jupiter Retrograde and Risk Appetite
Jupiter represents expansion, optimism, growth, liquidity, and confidence. Jupiter retrograde can be interpreted as a period when markets review growth expectations.
A Jupiter retrograde period may cause investors to question whether optimism has gone too far. Growth stocks, speculative sectors, emerging markets, crypto assets, and high-valuation themes may experience reassessment. However, Jupiter retrograde can also support internal strengthening. Strong companies may continue performing if fundamentals remain solid.
For traders, Jupiter retrograde is a useful time to examine whether a rally is based on real earnings or excessive hope. In today’s market, this is especially relevant for AI stocks, semiconductor companies, and technology themes. A strong long-term trend can still suffer short-term pullbacks if expectations become too stretched.
Saturn Retrograde and Structural Risk
Saturn represents discipline, limits, regulation, debt, responsibility, and long-term structure. Saturn retrograde may bring a review of structural weaknesses.
In financial markets, Saturn retrograde can be relevant for debt, credit spreads, bond yields, fiscal pressure, banking stress, and valuation compression. Investors may reassess balance sheets, leverage, refinancing risk, and regulatory pressure.
This matters in the current environment because global financial stability concerns remain important. The IMF has warned about high debt levels, rollover risks, leverage across nonbank financial intermediaries, and tighter financial conditions. The Federal Reserve’s May 2026 Financial Stability Report also noted that forward equity price-to-earnings ratios remained in the upper ranges of their historical distribution, while corporate bond spreads remained low by historical standards.
Saturn retrograde does not guarantee a downturn, but it can be a time to review hidden pressure in portfolios. Are companies carrying too much debt? Are valuations too high? Are investors underpricing credit risk? Are bond yields moving against growth stocks?
Saturn asks traders to respect risk before the market forces them to.
The Moon and Short-Term Market Sentiment
The Moon moves quickly, so lunar cycles are useful for short-term market timing. The Moon is linked with emotion, public mood, liquidity rhythm, and immediate sentiment.
Many financial astrology traders watch new moons, full moons, waxing phases, waning phases, and lunar aspects. These cycles may help identify short-term emotional extremes, reversal points, or momentum shifts.
The Moon should not be used as a standalone trading system. It works best as a timing filter. If a market is already near support, a lunar shift may help traders watch for reversal. If a market is overextended into a full moon, traders may watch for profit-taking. If a breakout occurs during a supportive lunar phase with strong volume, it may deserve attention.
Lunar cycles are especially useful for swing traders because they often operate on multi-day or multi-week time frames.
New Moon and Market Beginnings
A new moon begins a fresh lunar cycle. Symbolically, it is linked with initiation, reset, and new intention. In financial astrology, new moons may be watched for fresh trends, early reversals, or new market themes.
A new moon does not automatically mean a market bottom. However, if a market has been declining and begins stabilizing near a new moon, traders may watch for early signs of recovery. If a sector begins outperforming around a new moon, it may signal the start of a new rotation.
For example, if AI stocks have corrected into support and then begin showing stronger volume near a new moon, swing traders may watch for a potential rebound. If gold begins rising around a new moon during a period of inflation concern, commodity traders may watch for safe-haven demand.
The new moon is a timing clue, not a guarantee.
Full Moon and Market Culmination
A full moon represents emotional intensity, visibility, and culmination. In market terms, full moons may coincide with short-term extremes. Traders may see profit-taking after a rally, capitulation after a sell-off, or volatility expansion.
A full moon can be useful when combined with momentum indicators. If a stock is overbought, near resistance, and rising into a full moon, traders may consider taking partial profits. If a stock is oversold, near support, and falling into a full moon, traders may watch for reversal signals.
Full moons may be especially relevant for crypto and commodities because these markets often respond strongly to emotion, liquidity, and speculative flows.
Waxing Moon and Risk-On Sentiment
The waxing moon is the period from new moon to full moon. Symbolically, it is linked with growth, building energy, and expansion. Some traders associate waxing phases with improving sentiment or momentum development.
This does not mean markets always rise during the waxing moon. However, if technical and macro conditions are supportive, a waxing moon phase may align with stronger follow-through. Traders may use this period to watch for breakouts, continuation patterns, and rising momentum.
The key is confirmation. If price is below resistance and volume is weak, the waxing moon alone is not enough. If price breaks out with volume, the lunar phase may support the timing.
Waning Moon and Risk Reduction
The waning moon is the period from full moon to new moon. Symbolically, it is linked with release, decline, review, and consolidation. In financial astrology, some traders watch waning phases for profit-taking, correction, or reduced momentum.
This does not mean markets always fall during the waning moon. In strong bull markets, prices can rise through any lunar phase. However, if a market is overextended, a waning phase may coincide with consolidation or pullback.
Swing traders may use waning phases to review exits, tighten stops, reduce leverage, or wait for better entries.
Combining Eclipses, Retrogrades, and Lunar Cycles
The strongest timing signals often occur when several cycles overlap. For example, an eclipse season during Mercury retrograde and a full moon may suggest a more sensitive market period. A Mars-heavy volatility window near a lunar eclipse may be worth watching closely. A Saturn retrograde period during rising bond yields may increase the importance of credit and valuation analysis.
However, more astrological signals do not automatically mean a crash. They mean traders should become more alert. The market must still confirm the move through price action, volume, volatility, breadth, and macro data.
A useful process is to rank timing windows as low, moderate, or high sensitivity. Low-sensitivity periods may allow normal trading. Moderate periods may require tighter discipline. High-sensitivity periods may require smaller positions, hedges, or more patience.
How Market Data Confirms Astrological Volatility Windows
Astrological timing becomes more useful when confirmed by market data. Traders should watch the S&P 500, Nasdaq, Dow Jones, VIX, 10-year Treasury yield, U.S. dollar index, crude oil, gold, credit spreads, market breadth, and sector rotation.
If an eclipse or retrograde window appears and the VIX rises, yields spike, oil jumps, and market breadth weakens, volatility risk becomes more serious. If an eclipse window appears but breadth improves, yields stabilize, earnings remain strong, and price holds support, the market may absorb the pressure.
This is why astrology should be used with evidence. It identifies when to pay attention. Market data tells traders whether action is justified.
How Swing Traders Can Use These Cycles
Swing traders can use eclipses, retrogrades, and lunar cycles to refine entries and exits. A trader may avoid entering a large position right before a high-risk eclipse window unless price confirmation is very strong. They may reduce position size during Mercury retrograde if news flow is confusing. They may take partial profits near a full moon if a stock is extended. They may look for fresh setups near a new moon if momentum begins improving.
For swing traders, the goal is not perfect prediction. The goal is better timing. If astrology helps a trader avoid chasing, reduce overtrading, respect volatility, and wait for confirmation, it has practical value.
How Long-Term Investors Can Use These Cycles
Long-term investors do not need to trade every lunar phase or retrograde. However, they can use major eclipse seasons and longer retrograde cycles as portfolio review periods.
During these windows, investors can review asset allocation, valuation risk, sector concentration, debt exposure, and cash levels. They may rebalance if the portfolio has become too concentrated in one theme, such as AI stocks, crypto, or high-growth technology. They may review whether bond yields or inflation risks are affecting their equity exposure.
Long-term investors should avoid emotional action. The purpose of these cycles is awareness, not panic.
Common Mistakes to Avoid
The first mistake is treating eclipses as automatic crash signals. They are timing windows, not guaranteed events.
The second mistake is assuming Mercury retrograde always means bearish markets. It may mean confusion, revision, or retesting, but price action decides the outcome.
The third mistake is using lunar cycles without technical confirmation. A full moon near resistance is more meaningful than a full moon in the middle of a random price range.
The fourth mistake is ignoring macro data. Inflation, bond yields, oil prices, central banks, earnings, and liquidity can overpower a simple timing signal.
The fifth mistake is overtrading. Astrological calendars contain many events, but not every event deserves a trade.
Conclusion: Astrology Helps Identify Timing, Data Confirms Volatility
Eclipses, retrogrades, and lunar cycles can affect market volatility by highlighting periods when sentiment may become more emotional, uncertain, or reactive. Eclipses may reveal hidden pressure or accelerate turning points. Retrogrades may bring review, revision, delays, and reassessment. Lunar cycles may help traders watch short-term mood, emotional extremes, and momentum shifts.
However, these cycles should never be used alone. Financial markets move through real forces such as earnings, inflation, interest rates, bond yields, liquidity, credit spreads, oil prices, currency flows, and investor positioning. Astrology may help traders identify timing windows, but market data must confirm whether the signal matters.
For traders, this means using eclipses, retrogrades, and lunar phases as part of a broader process. For investors, it means reviewing risk during sensitive periods without making emotional decisions. For young market participants, it means learning discipline in a world full of fast headlines and speculative trends.
The best approach is simple: use astrology to understand time, use market data to confirm direction, and use risk management to protect capital.
To know more about the topic, read this detailed guide on how financial astrology works in stock market forecasting.
메타데이터
- post_id
- dcb3fcd39864
- slug
- how-eclipses-retrogrades-and-lunar-cycles-affect-market-volatility-dcb3fcd39864
- url
- https://medium.com/@astroindia123/how-eclipses-retrogrades-and-lunar-cycles-affect-market-volatility-dcb3fcd39864
- canonical_url
- https://medium.com/@astroindia123/how-eclipses-retrogrades-and-lunar-cycles-affect-market-volatility-dcb3fcd39864
- author_url
- https://medium.com/@astroindia123
- status
- ok
- fetched_at
- 2026-07-30 21:24:34