Simulating Brush Strokes with R
Add a flourish to ggplot generated visualizations
Simulating Brush Strokes with R
Add a flourish to ggplot generated visualizations
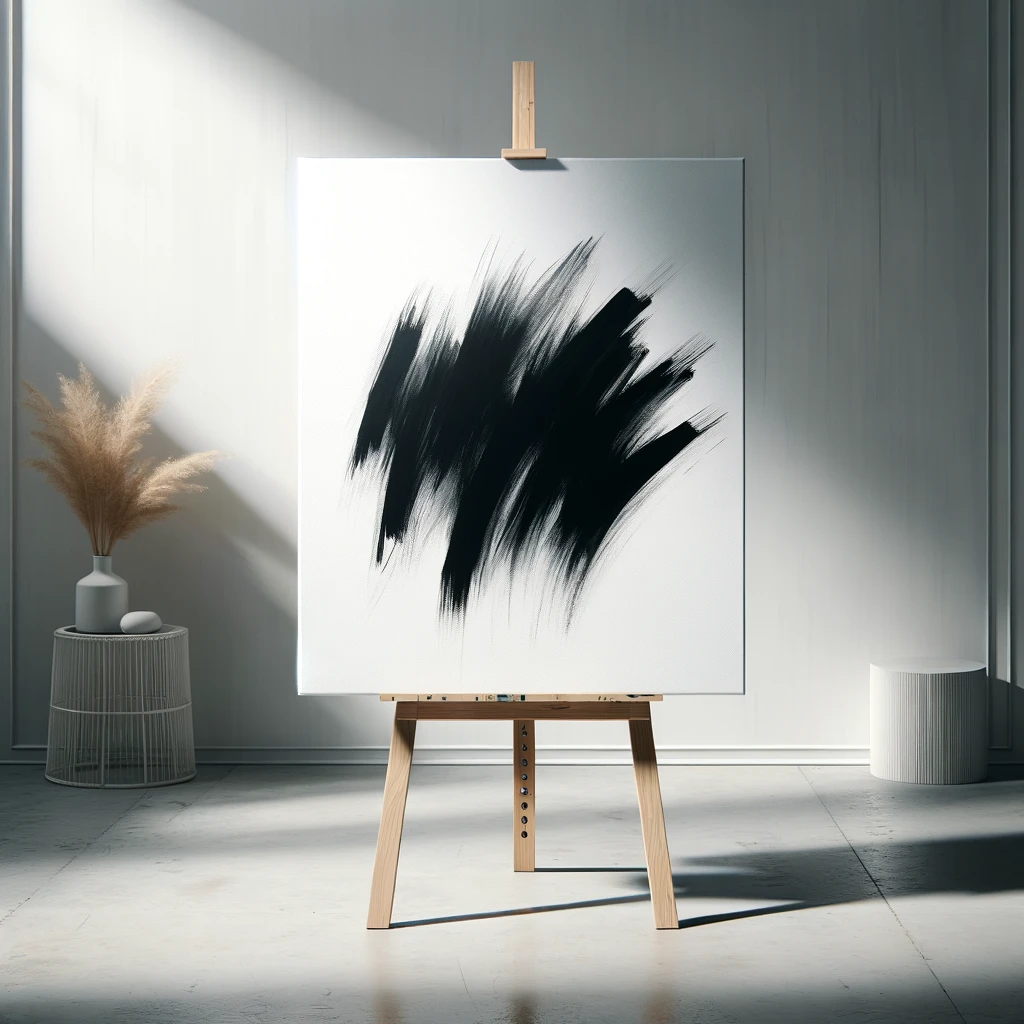
Generated by DALL-E 3
To hone my data visualization skills I like to try to reproduce/recreate data visualizations. This becomes more of a challenge when the visualization was created using a program other than R (ggplot), my preferred platform for playing with data. This leads me to searching for packages or techniques or having to figure out a way to do it.
Last year I participated in the ***DuBois Challenge ([@DuboisChallenge](https://twitter.com/DuboisChallenge)***) which gave me the opportunity to recreate some of the visualizations presented by W.E.B. DuBois at the 1900 Paris Exposition. One of the challenges (Week 5) was the following:

Plate 57
As with all visualizations I attempted for the challenge, this one had details that I needed to figure out to create a visualization as close to the original as possible, namely the sizes and positions of the boxes. However, one thing I also wanted to try to do with this was to recreate the ‘brush strokes’ on each of the boxes.
Creating Brush Strokes
Once I had the layout for the recreation done with solid colored boxes, it was time to figure out how to do the brush strokes with ggplot in R. After browsing the web, I didn’t see anything that fit what I wanted to do, so I was on my own.
After looking closely at the boxes in the original, the lighter parts somewhat resembled straight lines on top of a solid background. Thinking about this led me to create a box with a solid fill and then added horizontal white lines on top of the box.
library(tidyverse)
library(ggfx)

## create box
p <- ggplot()+
  geom_polygon(data=data.frame(
    x=c(0,0,1,1),y=c(0,1,1,0)),
    aes(x,y),fill="#03045E"
  ) +
  theme_void()

## Add white lines
p + geom_line(data=data.frame(
    x=rep(c(.05,.95),60),
    y=rep(seq(.05,.95,length.out=30),each=2),
    group=rep(1:30,each=2)
  ),aes(x,y,group=group),color="white",linewidth=.25)

Starting block (left) and after adding white lines (right)
It wasn’t quite what I was looking for, so I tried 1000 random lines of random lengths and slopes and experimented with the line width and transparency. I also divided the vertical axis into four sections for more overlap.
## random lines
p + geom_line(data=data.frame(
    x=runif(1000,-.1,1.1),
    y=c(runif(250,-.01,.35),runif(250,.25,.55),runif(250,.5,.85),runif(250,.75,1.1)),
    group=rep(1:500,each=2)
  ) %>%
    mutate(x=ifelse(x<0,0,ifelse(x>1,1,x)),
           y=ifelse(y<0,0,ifelse(y>1,1,y))),
  aes(x,y,group=group),col="white",size=3,alpha=.05)
Randomizing the length and slopes of lines.
This was closer, but I felt like I needed to smudge the lines a little bit. I did a quick search and found a function in the ggfx package: with_blur. I experimented with this function and also with lighter shades of the of the box color for the lines.
## blur lines
p +   with_blur(geom_line(data=data.frame(
    x=runif(1000,-.1,1.1),
    y=c(runif(250,-.01,.35),runif(250,.25,.55),runif(250,.5,.85),runif(250,.75,1.1)),
    group=rep(1:500,each=2)
  ) %>%
    mutate(x=ifelse(x<0,0,ifelse(x>1,1,x)),
           y=ifelse(y<0,0,ifelse(y>1,1,y))),
  aes(x,y,group=group),col="#ADD8E6",size=3,alpha=.05),sigma=unit(2,'mm'))
Blurring the lines
Almost what I wanted — it captured the lighter parts, but it was missing the brush strokes. To create the brush strokes, I added random length horizontal lines the same color as the box with some blurring and transparency.
## add final layer
p +   with_blur(geom_line(data=data.frame(
    x=runif(1000,-.1,1.1),
    y=c(runif(250,-.01,.35),runif(250,.25,.55),runif(250,.5,.85),runif(250,.75,1.1)),
    group=rep(1:500,each=2)
  ) %>%
    mutate(x=ifelse(x<0,0.05,ifelse(x>1,.95,x)),
           y=ifelse(y<0,0.05,ifelse(y>1,.95,y))),
  aes(x,y,group=group),col="#ADD8E6",size=3,alpha=.05),sigma=unit(2,'mm'))+
  with_blur(geom_line(data=data.frame(
    x=runif(444,0,1),
    y=seq(0.102,.988,.002),
    group=rep(1:222,each=2)
  ),
  aes(x,y,group=group),col="#03045E",alpha=.25,size=2.5),
  sigma=unit(.25,'mm'))
Final brush strokes
It wasn’t exactly the same, but did give the feel of brush strokes.
Using this technique on all the boxes, here is the recreation on the left next to the original on the right:

Recreation on left and original on right
Following Up
This year I also worked on the Week 6 challenge, and tried something different for the brush stroke effect. I used a lighter color on the box, and added blurred horizontal lines to get a different effect (recreation on the left, original on the right):


Recreation on left, original (Plate 54) on right
I also played around with using different colors and parameters to see what patterns could be generated. Here are two examples using red and black:
## left image
ggplot()+
  geom_polygon(data=data.frame(
    x=c(0,0,1,1),y=c(0,1,1,0)),
    aes(x,y),fill="black" #"#023EBA"
  )+
  with_blur(geom_line(data=data.frame(
    x=runif(10000,-.25,1.25),
    y=seq(0,.9999,.0001),
    group=rep(1:5000,each=2)
  ) %>%
    mutate(x=ifelse(x<0,0,ifelse(x>1,1,x))),
  aes(x,y,group=group),col="red",alpha=.15,size=.25),sigma=unit(1.5,"mm"))+
  theme_void()

## right image
ggplot()+
  geom_polygon(data=data.frame(
    x=c(0,0,1,1),y=c(0,1,1,0)),
    aes(x,y),fill="black"
  )+
  with_blur(geom_line(data=data.frame(
    x=runif(1000,-.1,1.1),
    y=c(runif(250,-.01,.35),runif(250,.25,.55),runif(250,.5,.85),runif(250,.75,1.1)),
    group=rep(1:500,each=2)
  ) %>%
    mutate(x=ifelse(x<0,0.05,ifelse(x>1,.95,x)),
           y=ifelse(y<0,0.05,ifelse(y>1,.95,y))),
  aes(x,y,group=group),col="red",size=2,alpha=.05),sigma=unit(2,'mm'))+
  theme_void()

Using red and black to generate different patterns
Final Thoughts
This was an interesting challenge. While I wasn’t able to match the brush/marker strokes in the DuBois visualization, I was able to generate something similar. I liked trying this technique since it gave the visualization a little more of human/artistic touch.
While I had fun generating different patterns, it’s also important to note it makes use of randomly selecting values so it may take a few iterations before a useful pattern is generated. Also, don’t forget to set a seed (a lesson I learned the hard way).
(The code I used to generate visualizations for the DuBois Challenge can be found **here )**
메타데이터
- post_id
- dcc7131b05e4
- slug
- simulating-brush-strokes-with-r-dcc7131b05e4
- url
- https://medium.com/@j3follis/simulating-brush-strokes-with-r-dcc7131b05e4
- canonical_url
- https://medium.com/@j3follis/simulating-brush-strokes-with-r-dcc7131b05e4
- author_url
- https://medium.com/@j3follis
- status
- ok
- fetched_at
- 2026-07-24 03:50:31