GMX perpetual Markets report
1. Executive Summary:
GMX perpetual Markets report
1. Executive Summary:
GMX is a multi-chain perpetual DEX which offers on-chain crypto trading. With DEFI and on-chain perp trading gaining more and more attention, we take a look into the performance of contracts in two of GMXs markets (Arbitrum and Avalanche).
Findings
For simplicity sake, “markets” here refers to the blockchain that hosts the trading pairs. As we already know GMX has a multi-chain market , however we will be focusing solely on the arbitrum and avalanche markets.
Between these two markets alone, GMX has processed a trading volume of over $146,223,127,238 with $124,258,155,729 from arbitrum markets and $21,964,971,509 from Avalanche. We could easily notice the large disparity in the total trading volume between the two. This disparity in volume could be easily explained when we understand that there are 129 pairs (contracts) for arbitrum and only 16 pairs (contracts) for avalanche. With this in mind, the disparity in the number of trading pairs will be seen to affect other metrics like total liquidations, total transactions count, etc
A quick look at the general trading performance and we will find out that ETH is the overall dominating pair with a total transaction count of 1,390,969 and a total volume of $77,934,980,323. With a total open long position sitting at over $23,986,407,786 and a total open short position sitting at over $14,981,014,846.
Arbitrum has a total long position of over $145,319,939,470 and a total short position of $184,966,303,249 while Avalanche is at over $4,797,990,834 for longs and over $6,480,704,128 for open shorts. For current rolling funding rate, arbitrum is currently around 3.14 while avalanches is around 0.3. Arbitrum is currently experiencing large funding rate spikes due to market imbalance of some of its pairs while funding rates are climbing steadily for avalanche markets suggesting a more liquid market.
Arbitrums total liquidations (long & short) is currently over $349,488,428 and avalanches’ is over $81,124,046.
Both markets are experiencing steady growth for trading volume and open interest despite being slightly imbalanced markets.
2. Context
2.1 Analytical questions
- Which market dominates trading?
- Which market is most leveraged?
- Which market is most imbalanced?
- Which market is most risky?
3. Key Findings
3.1 Funding rate

Context
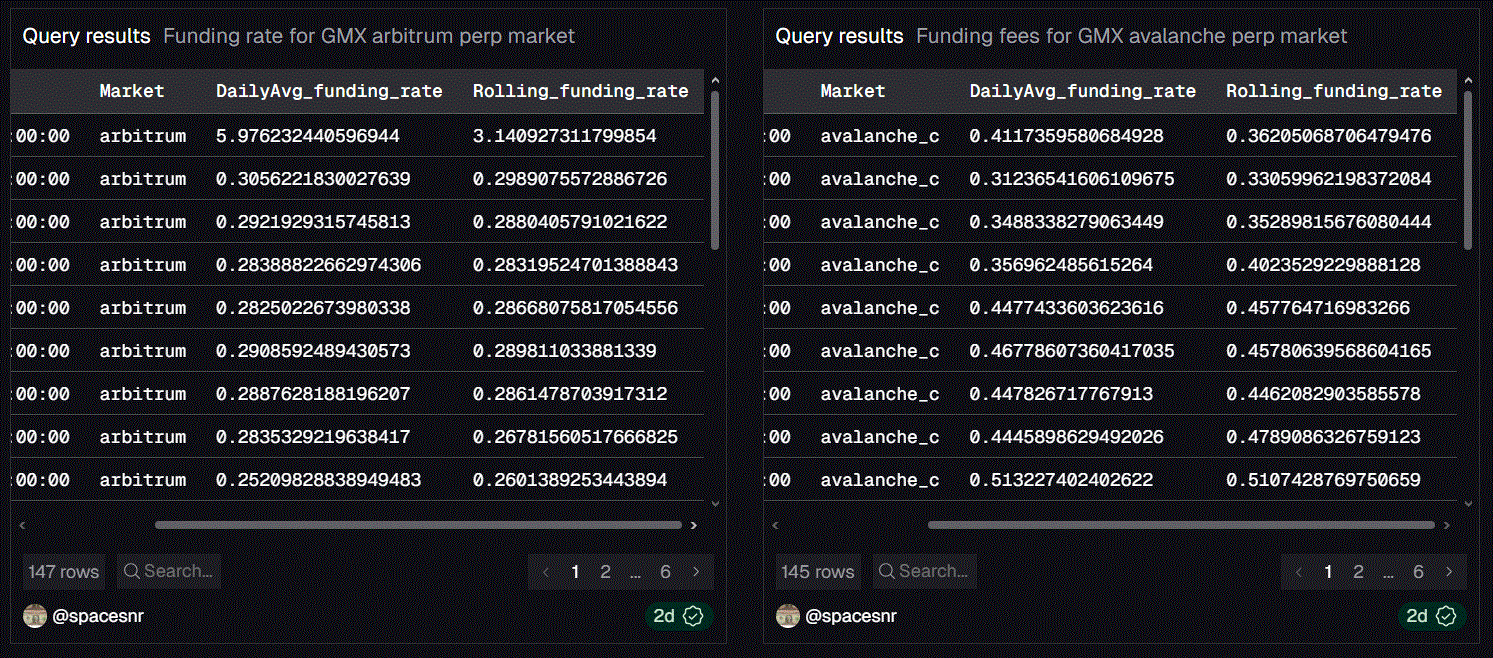
Funding rate shows the percentage of “tax” traders on the dominant side of the trade has to pay the opposite side. This is to maintain balance and incentivise counter trades. High funding rates suggest increased market participation and in most cases market imbalance.
Findings
Funding rates for markets on Arbitrum have been constantly spiking with the current rolling rate at 3.1. The Arbitrum market consists of around 129 pairs which includes major coins, RWA and memecoins. The rolling funding rate spike is attributed to constant index premiums on some pairs in this market. Avalanche on the other hand has been experiencing a more subtle climb in its funding rate with the current rolling rate at 0.31. Avalanche market consists of about 16 pairs which are mainly high and mid-cap coins/tokens.
So what?
With the high funding rate spike for the arbitrum market, we can tell that there is a high market imbalance (between longs and shorts). This imbalance is as a result of some pairs having low liquidity while experiencing large one-sided trades. For avalanche, a steady growth in rolling funding rate will mean a continuous increase in trading activities and more liquid pairs.
3.2 Open Interest

Context
Open Interest (OI) is the number of unsettled contracts currently in a market, while Notional value is the dollar value of these unsettled contracts. OI helps us to gauge how attractive or liquid the current market is and can also suggest trader interest or bias in such a market.
Findings
Arbitrum markets have experienced a continuous increase in OI with its current peak at over $135b. Earlier in February this year OI for Arbitrum market dropped from $124b to $114b due to some political and regulatory issues. Avalanche has also experienced a continuous growth with its current peak at $3.6b. However, around July last year, OI for avalanche market fell from $2.6b to $2.4b which was also as a result of political tensions in the middle east at the time.
So what?
This constant increase in OI across both markets tells us that there is a continuous growing interest in the market with new traders entering the market and old ones still remaining in the market. Declining OI because of negative political, regulatory or geographical news tells us that market interests are often influenced by local and global news.
3.3. Market share Dominance

Context
On the GMX platform which pair dominates trading on both arbitrum and avalanche markets.
Finding
The GMX platform allows multiple collateral (pools) for some pairs, making it possible for traders to use the quote or base as collateral and also take profit in either of the pairs(base or quote). WETH-WETH has a total transaction count of over 840,000 and total volume of $47.9B while WETH-USDC has a total transaction count of 542,000 and total volume of $29.9B. This generally puts the ETH pair as the dominant trading pair with a combined transaction count of over 1.3m and volume of over $77.9B
So what?
ETH pair is dominating trading across the GMX platform on different chains. Upon critical examination of the top 10 pairs by transaction count and volume, we will notice that they are pairs with multiple pools. I will conclude by saying pairs with multiple pools dominate trading across the GMX platform.
3.4 Overcrowded longs vs shorts

Context
The balance between longs and shorts is essential. This keeps the market balanced, reduces funding rate spikes and market squeezes (long or short squeeze).
Finding
Both markets are slightly imbalanced. Avalanche market has a total liquidation of over $11.2b with longs at $4.79b and shorts at $6.8b. This puts the ratio of longs/shorts at 42.5%/57.4%. Arbitrum on the other hand has a total liquidation of over $330.28b with longs at $145.3b and shorts at over $184.96b. This puts the ratio of longs/shorts for the arbitrum market at 43.9%/56%. The ideal long/short ratio 1:1 or in realistic cases 45%/55%.
So what?
Imbalanced markets experience variations in funding rates and the more imbalanced the market is, the more the spikes in rate and the risk of market squeezes (long/short squeeze). As we’ve discussed earlier, the spiking rates of the avalanche market cannot solely be caused by a slight market imbalance. Those spikes are caused by premium index prices due to illiquid pair(s).
3.5 Risk concentration per market

Context
Markets with higher risks of liquidations, rate spikes, market squeezes and illiquid pairs should be approached with extreme caution.
Finding
Both the arbitrum and avalanche markets are slightly imbalanced markets with shorts dominating. Arbitrum has a total of 129 pairs, a total liquidation of over $834m with long liquidation at over $591m and short liquidation at over $242m. Avalanche has a total of 16 pairs, a total liquidation of over $186m, with long liquidation at over $138m and short liquidation at over $57m.
So what?
Both markets are relatively safe with slight market imbalance. This on its own isn’t enough to cause massive liquidations or rate spikes. However it has been observed that certain pairs on arbitrum markets might experience illiquidity, price rising above spot price creating a premium index price and causing rate spike for those pairs.
4. Conclusion
The GMX platform with its multi-chain markets offers a robust perpetual derivative trading experience from trading RWA to memecoins, etc. The multi-chain markets; which we focused mainly on the arbitrum and avalanche markets, offer a variety of pairs with both single and multi-pools.
Avalanche market with its 16 trading pairs offers trading for major high cap coins/tokens, making it a place for traders that just want to trade the major crypto pairs with little distractions. Open interest for this market has been on a steady climb since its inception showing a strong interest from traders. Even though the current market is slightly imbalanced with short dominating, funding fees have been relatively steady.
Meanwhile, Arbitrums’ market has more variety in trading pairs offering about 128 pairs which includes the major coins/tokens, RWA like oil, memecoins, etc. Interest in this market has grown and continues to grow as its Open Interest is steadily on the increase. With trading pair variety in this market, we face some illiquidity on certain pairs which could contribute to market imbalance, rolling funding rate spikes, market squeezes and liquidations.
These two markets offer good trading experience with multiple pools, collaterals and assets for profit taking.
Queries Avax FR | Arb FR | Top Markets | Total vol. Traded | liquidations
Dashboard GMX market dashboard
메타데이터
- post_id
- de2aa2928ab8
- slug
- gmx-perpetual-markets-report-de2aa2928ab8
- url
- https://medium.com/@ochommaspace/gmx-perpetual-markets-report-de2aa2928ab8
- canonical_url
- https://medium.com/@ochommaspace/gmx-perpetual-markets-report-de2aa2928ab8
- author_url
- https://medium.com/@ochommaspace
- status
- ok
- fetched_at
- 2026-06-22 05:41:33