European Market Regime Analysis: When the Volatility Model Disagrees With Itself
European market regime analysis rarely turns on a single weekly return. The week of June 5, 2026 is a case in point: every European country…
European Market Regime Analysis: When the Volatility Model Disagrees With Itself

European market regime analysis rarely turns on a single weekly return. The week of June 5, 2026 is a case in point: every European country ETF closed lower, but the signal worth extracting is structural, not directional. The in-sample regime classifier read a calm, low-volatility trend, while the out-of-sample walk-forward validator pointed toward high-volatility mean reversion — and disagreed with it.
This breakdown covers the week’s performance, the volatility regime, central-bank policy divergence, and the tail-risk math — grounded in the EEMRA systematic methodology (a hybrid deterministic/LLM engine for European equity analysis).

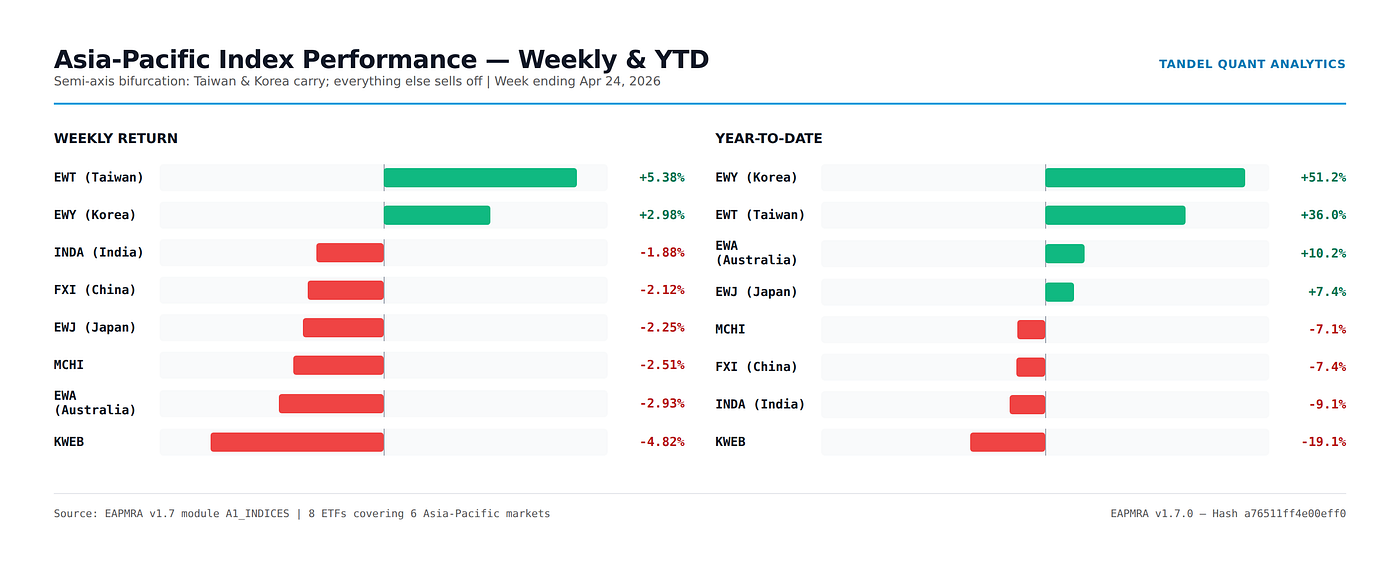
Weekly performance across six European country ETFs. Germany is the only major negative year-to-date.
Broad Weakness, German Underperformance
The decline was orderly and broad. Eurozone exposure (EZU) fell 1.76% to $67.63, holding a 5.51% year-to-date gain. The UK (−0.66%) and France (−1.00%) gave back the least; Germany (−3.15%) did the damage and slipped to −0.92% on the year, the only major in negative territory. Italy remains the YTD leader at +6.83% despite a 2.08% weekly drop — the periphery has carried the regional bid in 2026, and this week did nothing to break that. Peripheral stress stayed absent: the BTP–Bund spread held tight at 91 basis points, the 10-year Bund sat at 3.04%, and EUR/USD edged up to 1.1600.
A Calm Volatility Surface — With a Catch
VSTOXX fell 1.57 points to 18.56, classified NORMAL and carrying a roughly 3.2-point premium to VIX. Combined with a positive options skew of +0.30 (call demand), the surface looks constructive. The regime internals tell a different story.
The forward-looking validator does not endorse the in-sample calm-trend read.
The Regime Disagreement Is the Signal
The in-sample Hidden Markov Model classifies the environment as LOW_VOL_TRENDING with a stability score of 0.77, which degrades to 0.64 under Cornish-Fisher stress. Shift probability is 35.9% — a weak-tier transition risk in isolation. The decisive detail is the out-of-sample walk-forward call: HIGH_VOL_MEAN_REVERT at 0.40 confidence (LOW), in disagreement with the in-sample classification. The transition matrix flags RAPID_SHIFT and cuts regime-based sizing to 0.80×. The environment looks like a quiet trend, but the model’s forward-looking machinery is leaning toward a more volatile, mean-reverting state it cannot yet confirm.

Central-Bank Policy Divergence
Both central banks remain hawkish, but the Fed sits 162 basis points above the ECB (3.62% vs 2.00%). That gap scores −1 on the combined divergence measure — moderate dovish divergence from the European side — and pulls the positioning multiplier to 0.75×.

A 162bp gap, with a 1.15× policy-uncertainty factor folded into the tail multiplier.
The practical implication: two independent governors both argue for smaller size — the regime transition flag (0.80×) and the policy-divergence multiplier (0.75×). Stacked, they describe a week to size down and respect the tail rather than press the trend.
What the Tail Says
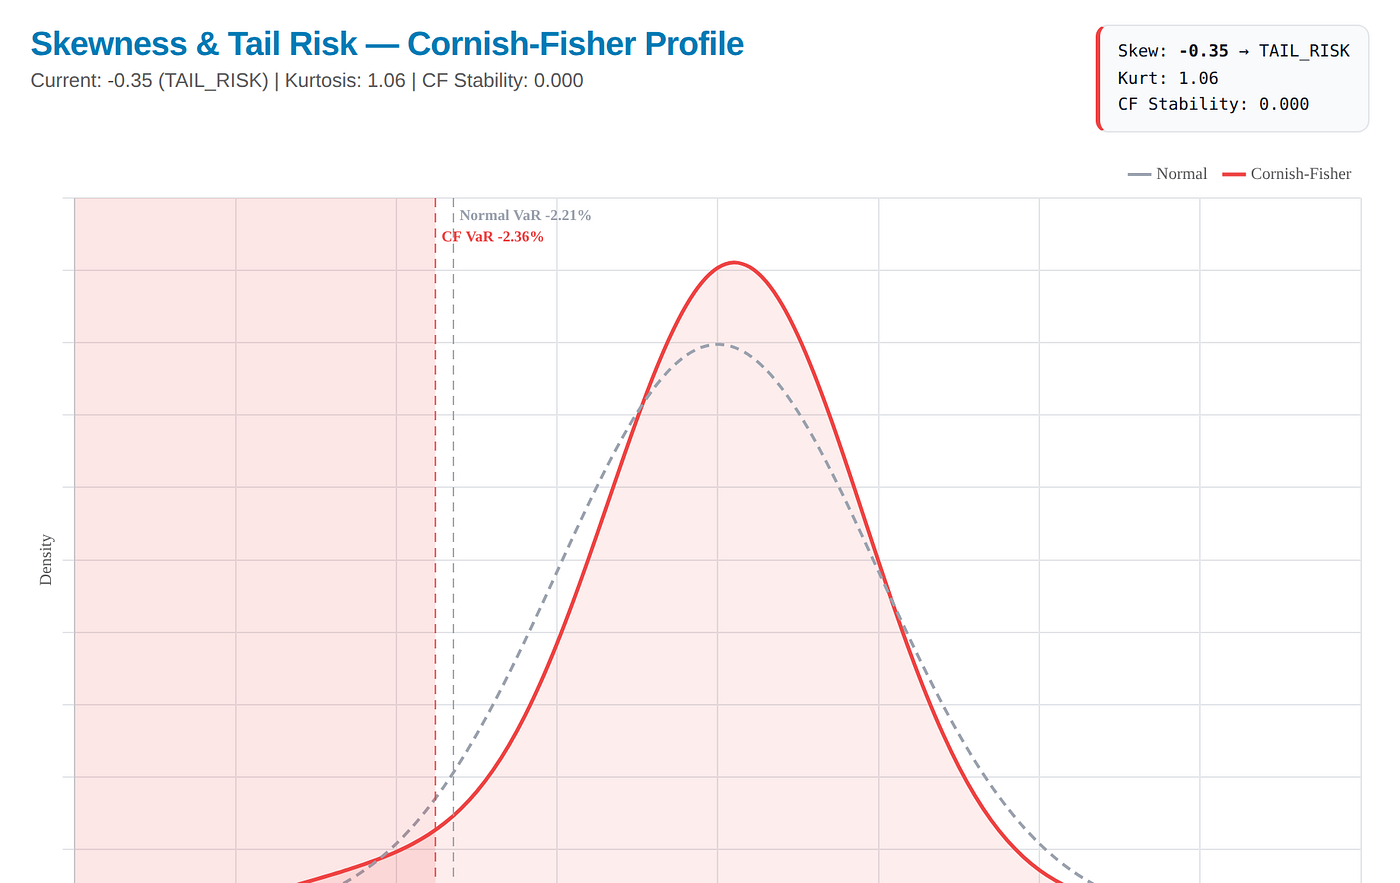
Cornish-Fisher adjustment carries a tail multiplier of 1.210× — inclusive of the 1.15× policy-uncertainty factor — and deepens the 95% VaR from −5.32% to −6.44%. Applied to the scenario set, the base 52% dovish-relief / 48% hawkish-selloff split reweights to 42.9% / 57.1%.

A roughly 9-point swing toward the hawkish selloff once the fat tail is applied.
Skew shows traders paying up for calls, but the kurtosis and the policy overlay place the heavier tail on the downside. Sector breadth corroborated the cautious read: of the STOXX sub-indices tracked, only two closed positive on the week, with the two weakest selected for deeper review.

Key Takeaways
- European equities fell broadly (EZU −1.76%); Germany (−3.15%) is the only major down year-to-date.
- Volatility looks calm (VSTOXX 18.56, NORMAL) but the in-sample and out-of-sample regime calls disagree.
- The Cornish-Fisher tail (1.21×) reweighted scenarios ~9 points toward a hawkish selloff (57.1%).
- Two sizing governors — regime (0.80×) and policy divergence (0.75×) — independently argue for smaller size.
The week’s lesson is that a quiet tape is not a safe one. The most important thing to watch is whether the out-of-sample high-vol-mean-revert signal gains confidence and converges with the in-sample classifier; if it firms, the calm-trend read flips and the early sizing cut proves correct.

For weekly systematic analysis delivered to your inbox, subscribe on Substack. Analysis, not financial advice.
About the Author
Tandel Quant Analytics publishes systematic market analysis using quantitative frameworks including EMRA, EEMRA, GMRO, and U-VCT. Subscribe on Substack for weekly reports.
메타데이터
- post_id
- deb8cd9bcdef
- slug
- european-market-regime-analysis-when-the-volatility-model-disagrees-with-itself-deb8cd9bcdef
- url
- https://medium.com/@tandel/european-market-regime-analysis-when-the-volatility-model-disagrees-with-itself-deb8cd9bcdef
- canonical_url
- https://medium.com/@tandel/european-market-regime-analysis-when-the-volatility-model-disagrees-with-itself-deb8cd9bcdef
- author_url
- https://medium.com/@tandel
- status
- ok
- fetched_at
- 2026-06-10 12:26:30