Are in-zone misses a check engine light for your swing?
Most Major League Baseball players operate in one of two in-zone miss rate states, but missing strikes does not always foretell a slump.
Are in-zone misses a check engine light for your swing?
Most Major League Baseball players operate in one of two in-zone miss rate states, but missing strikes does not always foretell a slump.
By Adam Maloof and Tyler Krieger
Front offices, coaches, players, commentators, and fans all spend an inordinate amount of time trying to determine (1) whether a player is in a slump, and (2) what adjustments they need to make to get out of a slump. How much would the Yankees have paid to fix whatever was going wrong with Aaron Judge during the 2024 postseason?
Understanding the role that chance plays in any Bernoulli process (e.g., a coin flip), and comparing expected statistics (e.g., how many bases does a typical batter get for a particular triplet of {exit_speed, launch_speed, spray_direction}) to actual stats, gets you one step toward understanding whether a player is slumping, or just running into some bad luck (sensu McCracken, 2001). But how can you tell what is causing the slump, and how can you make an adjustment to get out of the slump?
Coaches often mention In-Zone Miss Rate (IZMR) as one indicator that might suggest a batter’s timing is off, and/or that they have a glitch in their swing. IZMR also has been used as a component of measuring a player’s hit tool (Zeidman, 2024). IZMR is the number of swings and misses at pitches in the strike zone, divided by the total number of swings at pitches in the strike zone.

Figure 1. From 2022–2025, 78 Major League hitters had at least 400 PA each year. Rather than using Baseball Savant ‘pitch zones’ (Nestico, 2023), our strike zone is defined by unique RHB and LHB polygons, within which 95% of all called-pitches are called strikes from 2022–2025 in MLB (Maloof, 2025). Measured one month at a time (small dots depict months with ≥75 PA), in-zone miss rate (IZMR) varied from Devers’ high of 0.34, to Arraez’s low of 0.01. On average, year-to-year changes in IZMR are 3.4x smaller than month-to-month changes. Players with lower mean annual IZMR also had less variability in their month-to-month IZMR.
Figure 1 surveys the IZMR landscape since 2022. Qualified hitters have relatively small year-to-year changes in IZMR, which has led many to describe IZMR as a fairly career-stable statistic. However, most batters show changes of 100–200% on the month-to-month time scale, suggesting that IZMR may be linked to other performance-related changes in a player’s swing over the course of a season.
Correlations between Monthly Averages of IZMR and Baseball Savant Swing Metrics
Advanced swing metrics now are available from Baseball Savant for the full 2024 and 2025 seasons, so we focus on that time frame from here on out. Figure 2 shows how IZMR correlates with twelve swing-related metrics. Lambert (2024) used standard k-means clustering to characterize different swing types in these same swing-related metrics. We build on Lambert’s approach by searching for patterns in the correlations between these swing metrics and IZMR using fuzzy k-means clustering (Bezdek, 1981), because players don’t always fit neatly into one behavioral category. In fuzzy clustering, each player receives a membership probability for each cluster. Brice Turang, for example, has a 68% probability of belonging to C2 and 32% probability of belonging to C1 or C3. This probabilistic assignment better captures the continuous nature of hitting styles. To determine that three clusters (rather than two or four) best explain the data, we use a variant of the gap statistic, which compares within-cluster variance to what would be expected from randomly distributed data (Figure 2A; Tibshirani et al., 2001).
Here are brief descriptions of each cluster that also highlight some of the relationships between swing metrics and performance described by Cunningham (2024): — Cluster 1 (C1), exemplified by players like Hoerner, Bregman, Doyle, Díaz, and Larnach: When miss rate ↑, Attack Direction ↑, Launch Angle ↓, xAVG ↓, and xSLG ↓. In plain English, these hitters start pulling more ground balls, and their AVG and SLG suffer. — Cluster 2 (C2), exemplified by players like Ortiz, Carroll, Neto, Turang, McNeil: When miss rate ↑, Attack Angle ↑, Bat Speed ↑, Swing Length ↑, xAVG ↓, but xSLG does not change much. In plain English, these hitters start taking longer, faster uppercuts, reducing their xAVG a little, but having a varied, sometimes positive impact on xSLG. — Cluster 3 (C3), exemplified by players like Judge, García Jr., Machado, Schwarber, Torres: When miss rate ↑, Attack Angle ↑, xAVG ↓, and xSLG ↓↓. In plain English, these hitters take bigger uppercuts (but otherwise don’t reveal their IZMR struggles in most swing metrics), and see big declines in xAVG and xSLG.

Figure 2. First, we find all the non-switch hitters with at least 400 plate appearances (PA) in each of 2024 and 2025, and with at least 6 months with more than 75 PA/month in that time span. Next, for each player-month, we calculate the slope and R² of the correlation between in-zone miss rate (IZMR) and each of the following metrics: (B) Chase Rate (swings on pitches outside the strike zone / pitches outside the strike zone; Slowinski (2010)), (C) Squander Rate (non-swings on pitches in the strike zone / pitches in the strike zone), (D) Launch Speed, (E) Launch Angle, (G) Spray Direction (modified to be consistent with Attack Direction, so that positive numbers are pull, and negative numbers are opposite field), (H) Bat Speed, (I) Swing Length, (J) Attack Angle, (L) Attack Direction, (M) Swing Path Tilt (to learn more about H, I, J, L, M, see Petriello, 2025), (N) xAVG, and (O) xSLG. xAVG and xSLG are computed by simulating 500 seasons of batted ball outcomes based on each player’s launch speed, launch angle, and spray direction distributions (Maloof, 2024). You can see that for each metric, there are players with strong negative slopes (i.e., when IZMR goes up, that metric goes down), strong positive slopes, and no relationship at all. Then we ask if there are natural groups (clusters) of players that behave a certain way. (A) shows that using fuzzy k-means to group players into 3 clusters (but no more) significantly improves the variance explained compared to random clustering (i.e., a version of the gap statistic). (B) indicates that Attack Angle, Attack Direction, and Swing Length are the most important variables for defining these clusters. (C) summarizes the behaviors of the three clusters, C1, C2, and C3.
From Monthly Averages to Real-Time State Detection
Aggregating IZMR and swing data by month is an arbitrary and coarse way of slicing the apple. Also, monthly aggregation forces us to wait 75+ plate appearances before detecting a state change, by which point the slump may already be over. What if we could detect when players are in a high or low IZMR state, and then evaluate swing data in each of those states? Do players even have high and low IZMR states, or is it more of a continuum of variable IZMR? Let’s leverage the power of a Hidden Markov Model (HMM; Rabiner, 1989) to answer these questions.
Imagine someone is flipping a coin: “Heads, Heads, Tails, Heads,…” As you write down the results, you start to wonder if they are flipping a fair coin (or, for example, is their coin weighted to land on Heads 70% of the time). How many coin flips do you need to see before you can tell whether they are flipping the fair (p=0.5) coin, or the loaded (p=0.7) coin? Now imagine they occasionally swap coins without telling you — sometimes fair, sometimes loaded. You only see the sequence of flips, not which coin they’re holding. An HMM infers the hidden coin from the pattern of outcomes.
An HMM defines hidden states (e.g., fair or weighted coin | high or low IZMR), observations (e.g., coin flips or swings at pitches in the strike zone), transition probabilities (how likely the coin changes, or a batter switches from their high to low IZMR state), and emission probabilities (the likelihood of an observation — e.g., a sequence of coin flips or swing outcomes — given the state) to predict the most probable sequence of hidden states from the sequence of observations.
Markov chains have a rich history in baseball analytics (Bukiet et al., 1997; Calestini, 2018). Perhaps the most common use of HMMs in baseball has been to detect streaks and test the hot hand fallacy (Albert, 1993; Marx et al., 2013; Arthur and Matthews, 2017; Albert, 2017) — In other words, do some players alternate between a hot state and a cold state?
For our question about IZMR, our first instinct was to feed the HMM a sequence of individual pitch outcomes (zone miss or zone contact) and try to detect high and low IZMR states. But zone misses are rare (~12% of all zone swings by qualified hitters), so this binary sequence is mostly zeros with occasional ones. The model couldn’t distinguish “two states with different miss rates” from “one state with random noise.”
Instead of single pitches, we compute a rolling average of IZMR over 30 zone swings. We chose 30 zone swings as our rolling window because it provides enough observations for stable IZMR estimates (~3–4 misses per window at league-average rates) while still allowing detection of state changes within a week of play. This step transforms sparse binary data into a continuous signal, letting us fit a Gaussian HMM, where each state has a characteristic mean IZMR and variance. For example, Brice Turang (Table 1) has a low state centered at 6.4% and a high state centered at 17.2% (Figure 3). The tradeoff is temporal resolution — we can’t pinpoint state changes to individual pitches, only to windows of 15-30 zone swings (this window could be narrowed with access to more data). The HMM also estimates transition probabilities — on average, hitters have a 97.6% chance of remaining in their current state from one zone swing to the next, meaning state changes are relatively rare, but persistent once they occur.
Let’s illustrate the power of the tool with two examples. Brice Turang amassed 4.7 WAR in 2024 while playing gold glove defense, stealing a lot of bases (Table 1), and having a very low IZMR = 0.077 (Figure 1). In 2025, Turang took a leap offensively, compiling 5.6 WAR and a +0.129 jump in OPS (Table 1), but also suffered a doubling in his IZMR = 0.141 (Figure 1).

Table 1. Brice Turang stats from Baseball Reference.
Our HMM reveals two discrete states for Turang, one with low IZMR (0.064) and one with high IZMR (0.172) (Figure 3). Turang spent most of 2024 in the low IZMR state, and most of 2025 in the high IZMR state (Figure 3), suggesting an offseason change in his approach.

Figure 3. A Gaussian Hidden Markov Model identifies two IZMR states for Brice Turang (Table 1). “C2(0.68)” means that, in the fuzzy k-means clustering from Figure 2, Turang has a 68% chance of being a member of C2, and a total of 32% chance of being a member of either C1 or C3. The left panel shows rolling IZMR (computed over a centered 30-swing window) across 2024–2025, with each zone swing colored by its HMM-assigned state. Dashed horizontal lines mark the mean IZMR for each state. The thin bar along the bottom indicates state assignment over time. The right panel shows the distribution of rolling IZMR values in each state. Turang spent most of 2024 in his low IZMR state (6.4%) and most of 2025 in his high IZMR state (17.2%).
Now we can use the HMM state output for each plate appearance, and create a more refined individual assessment of Turang’s swing in each state. Figure 4 shows that Turang’s Bat Speed (+0.61 mph), Swing Length (+0.45 ft), Attack Angle (+0.71°), and Exit Speed (+1.72 mph) all go up in his high IZMR state, and this swing change leads to increases in xAVG and xSLG of +0.029 and +0.098 points, respectively (Figure 4). Basically, Turang is taking harder, longer, more uppercut swings, resulting in less, but higher quality contact, which is a common feature in C2 hitters. Interestingly, his two IZMR states have virtually identical Chase and Squander Rates (measures of plate discipline), and no obvious difference in the distribution of pitch types seen (Figure 4). For C2 hitters like Turang, elevated IZMR is not a warning sign — it’s a feature of a successful more power-oriented approach.

Figure 4. Comparing swing metrics between Turang’s two IZMR states. Top two rows: kernel density estimates for Exit Velocity, Launch Angle, Spray Direction, Bat Speed, Swing Length, Attack Angle, Attack Direction, and Swing Path Tilt, with two-sample Kolmogorov-Smirnov p-values thattest whether two distributions are statistically different (p<0.05 means 95% confidence they differ). Swing metrics are calculated only on balls in play in the zone, not swings and misses — Baseball Savant reports bat tracking data at the point of closest approach to the ball, making measurements on misses difficult to interpret. In his high IZMR state, Turang swings faster (+0.61 mph bat speed), longer (+0.45 ft), and with more uppercut (+0.71° attack angle), generating higher exit velocity (+1.72 mph). Bottom row: Chase Rate and Squander Rate remain nearly identical between states, and pitch type distributions are similar, suggesting the state change reflects swing mechanics, not pitcher approach or plate discipline.
Let’s contrast Turang with an exemplar C3 hitter, Aaron Judge. Judge won AL MVP in both 2024 and 2025, amassing two spectacular, and very similar seasons (Table 2).

Table 2. Aaron Judge stats from Baseball Reference.
Judge also has two discrete IZMR states, differing in IZMR by 12.5 percentage points (Figure 5). However, unlike Turang, Judge’s high IZMR state comes and goes throughout 2024–2025 (Figure 5). Particularly frustrating to Yankees fans, Judge got stuck in a high IZMR state during the 2024 postseason (Pappas, 2024; Figure 5). Our HMM detected this transition on September 25, 9 days before the playoffs began. Had the Yankees’ coaching staff been monitoring Judge’s rolling IZMR, this warning might have prompted earlier intervention, potentially preventing the catastrophic rise in Judge’s IZMR from 19.7% during the regular season to 31.6% in the postseason — including a brutal 34.5% in the ALCS.

Figure 5. HMM state identification for Aaron Judge. C3(0.67)” means that, in the fuzzy k-means clustering from Figure 2, Judge has a 67% chance of being a member of C3, and a total of 33% chance of being a member of either C1 or C2. Unlike Turang (Figure 3), Judge oscillates between states throughout both seasons rather than settling into one mode per year. Note the extended high-IZMR stretch during the 2024 postseason (October–November). Judge’s two states differ by 12.5 percentage points in IZMR — when he’s struggling, he misses roughly 1 in 4 zone pitches; when locked in, roughly 1 in 7.
Also unlike Turang, in his high IZMR state, Judge’s swing metrics all stay about the same, but his xAVG and xSLG plummet by -0.029 and -0.209 points, respectively (Figure 6). While in his high IZMR state, Judge shows slightly elevated Chase Rate, and faces more sliders and fewer sinkers (but overall a similar battery of pitch types). Do we conclude that the only thing changing in Judge’s swing is his timing?

Figure 6. Comparing swing metrics between Judge’s two IZMR states. Unlike Turang, Judge shows no significant differences in any swing metrics between states. Yet Judge’s contact results deteriorate: xAVG drops from .510 to .481, and xSLG from 1.304 to 1.095, characteristic of C3 hitters (Figure 2). His high IZMR state is associated with slightly elevated Chase Rate and a different pitch mix (more sliders, fewer sinkers), but the absence of obvious swing changes suggests timing, rather than mechanics, may be the culprit.
We validate each player’s two-state model using the Bayesian Information Criterion (BIC), which penalizes model complexity (Figure 7). Positive BIC differences indicate the two-state model is justified despite having more parameters. Of the 74 non-switch hitters with ≥400 PA in each of 2024 and 2025, 60 (81%) of them show discrete low and high IZMR states that are easy to detect with our HMM (Figure 7). That means that for most batters with enough data, our HMM can work like a check engine light, identifying when the hitter is transitioning to a high IZMR state, which for C1 and C3 hitters usually means they are entering slump (Figure 2). Because the rolling window spans 30 zone swings, the warning light comes on approximately 15 zone swings (with an average of 1.18 zone swings per PA, that means about 13 plate appearances) after the transition begins — hopefully enough time to get to the mechanic before the slump gets too bad.
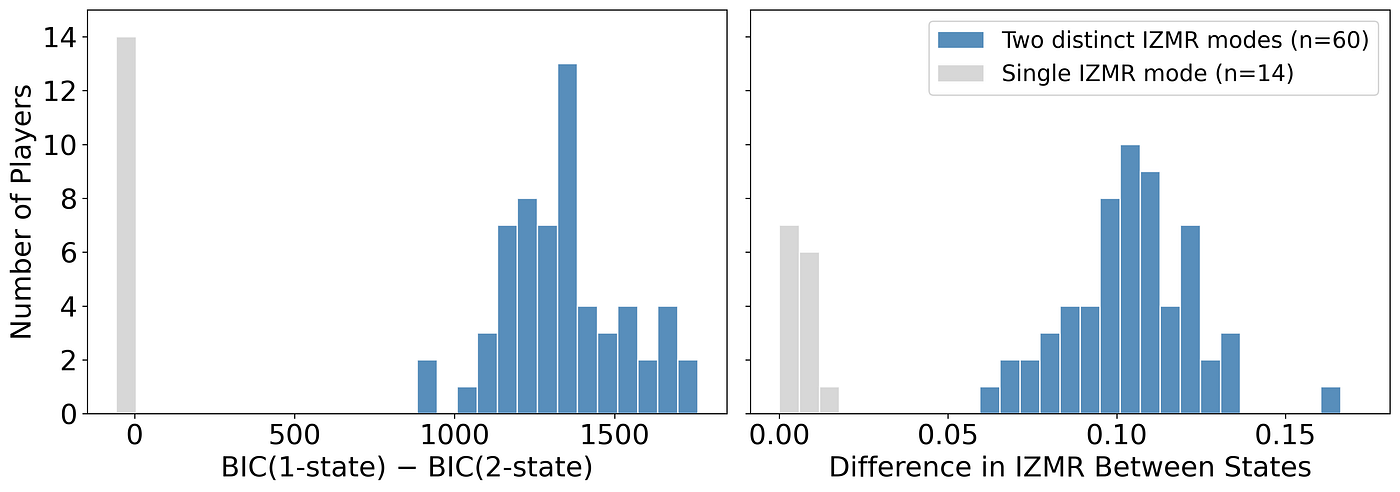
Figure 7. Validation of two-state Gaussian HMM fits across 74 qualified hitters (For the HMM analysis, we apply stricter filters, requiring 400+ PA in both 2024 and 2025, reducing our sample from 124 (Figure 2) to 74 players). Left panel: Distribution of BIC differences (1-state minus 2-state). BIC (Bayesian Information Criterion) helps us decide whether a complex model is worth the added complexity. It balances two competing goals: (1) fitting the data well (captured by the “likelihood” — how probable the observed data are under the model), and (2) keeping the model simple (penalized by the number of parameters, k, and the amount of data, n). A model with more parameters can always fit better, but BIC asks: is that improvement real, or just overfitting noise? The 1-state model has 2 parameters (mean and variance); the 2-state model has 7 (2 means, 2 variances, 2 transition probabilities, 1 initial state probability). When the 1-state BIC exceeds the 2-state BIC (positive difference), the data genuinely support two distinct IZMR modes (the extra complexity is justified). Right panel: Distribution of IZMR separation between states for players with valid 2-state fits. Of 74 players, 60 (81%) show distinct modes with meaningful separation (median: 10.1 percentage points (pp); range: 2.1–16.2 pp). The remaining 14 either operate in a single stable mode or have too much noise to detect structure. Interestingly, several elite hitters appear in this single-mode group, including Ohtani and Tatis Jr. Are these players so consistent that they never truly slump? Or are their variations too gradual for our HMM to detect? Further investigation with longer time windows might reveal slower-frequency oscillations in these elite hitters.
Limitations
One major limiting step in this analysis is the interpretation of MLB swing data. Baseball Savant reports Bat Speed, Swing Length, Attack Angle, Attack Direction, and Swing Path Tilt at the point in the swing when the bat is closest to the ball (Andrews, 2025). That means it is almost impossible to make use of swing data on swings and misses, because, depending on how the batter missed the pitch (ahead, behind, under, over, etc…), the swing measurements are made at different locations for each swing. Even for batted balls, the Baseball Savant data are challenging to use because simply contacting the ball at different locations will lead to different swing metrics, and the public data do not contain enough information on whole swings to know how to design contact-location-based adjustments. So for now, we don’t put a lot of stock in the swing data presented in Figures 2, 4, and 6, which might be masking larger differences in swings between IZMR states.
The true test of the hypothesis that elevated IZMR is linked to slumps would be to compare angles and distances between biomechanical landmarks during a hitter’s swing when they are in high IZMR versus low IZMR states. In other words, we need to replace Baseball Savant swing metrics with more nuanced and interpretable biomechanical data that allow us to see whether batters have different swings during their two IZMR states. Eventually, we can re-engineer the problem, and instead of relying on IZMR at all, train our HMM on the biomechanical data to know when a hitter is just unlucky, and when they need to make a specific adjustment.
Conclusions
Is IZMR a check engine light for your swing? The answer depends on the type of hitter you are. For C1 hitters (who pull more ground balls when struggling) and C3 hitters (who see their timing slip without obvious mechanical tells), a spike in IZMR is indeed a warning sign — expect declining xAVG and xSLG to follow. But for C2 hitters like Turang, elevated IZMR can accompany improved production, as longer, faster swings trade contact for power. An engine light is on, but it might just mean you’ve switched gears.
What’s clear is that most Major League hitters don’t operate on a smooth continuum of contact ability — they toggle between discrete states, and our HMM can detect those transitions roughly 13 plate appearances after they begin. That level of detection is early enough to be actionable: a hitting coach who sees a C3 hitter enter a high-IZMR state might review video for timing cues, while a C2 hitter in the same situation might simply be told to keep swinging. This check engine light means different things for different engines.
The next frontier is understanding why these state changes occur. With richer biomechanical data (e.g., hip-shoulder separation, bat path through the entire swing, timing of weight transfer), we could train HMMs to detect not just that a hitter has changed states, but what specific adjustment might help them return to form. Until then, IZMR offers a simple, publicly available signal that something has shifted in a hitter’s swing. Whether that shift is a problem or a feature depends on knowing who’s behind the wheel.
메타데이터
- post_id
- df110cf4cc79
- slug
- are-in-zone-misses-a-check-engine-light-for-your-swing-df110cf4cc79
- url
- https://medium.com/sabr-tooth-tigers/are-in-zone-misses-a-check-engine-light-for-your-swing-df110cf4cc79
- canonical_url
- https://medium.com/sabr-tooth-tigers/are-in-zone-misses-a-check-engine-light-for-your-swing-df110cf4cc79
- author_url
- https://medium.com/@maloofa
- status
- ok
- fetched_at
- 2026-06-14 11:28:49