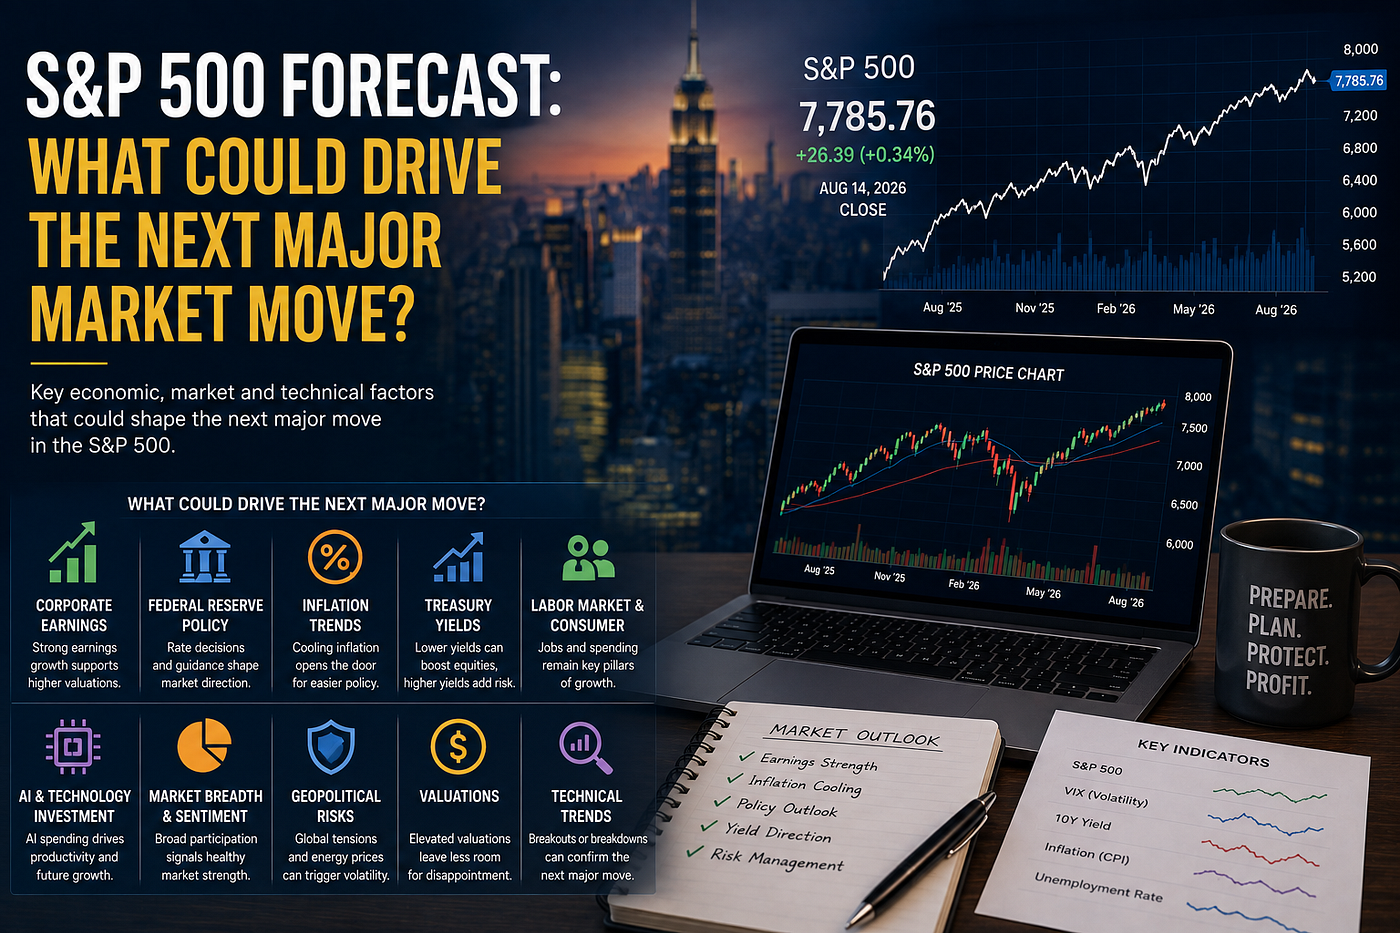
Stock Market Prediction: How Investors Forecast the Next Major Move
Predicting the stock market has fascinated investors for generations. Every major rally, correction, crash, and recovery creates the same…
Stock Market Prediction: How Investors Forecast the Next Major Move
Predicting the stock market has fascinated investors for generations. Every major rally, correction, crash, and recovery creates the same question: what will the market do next?
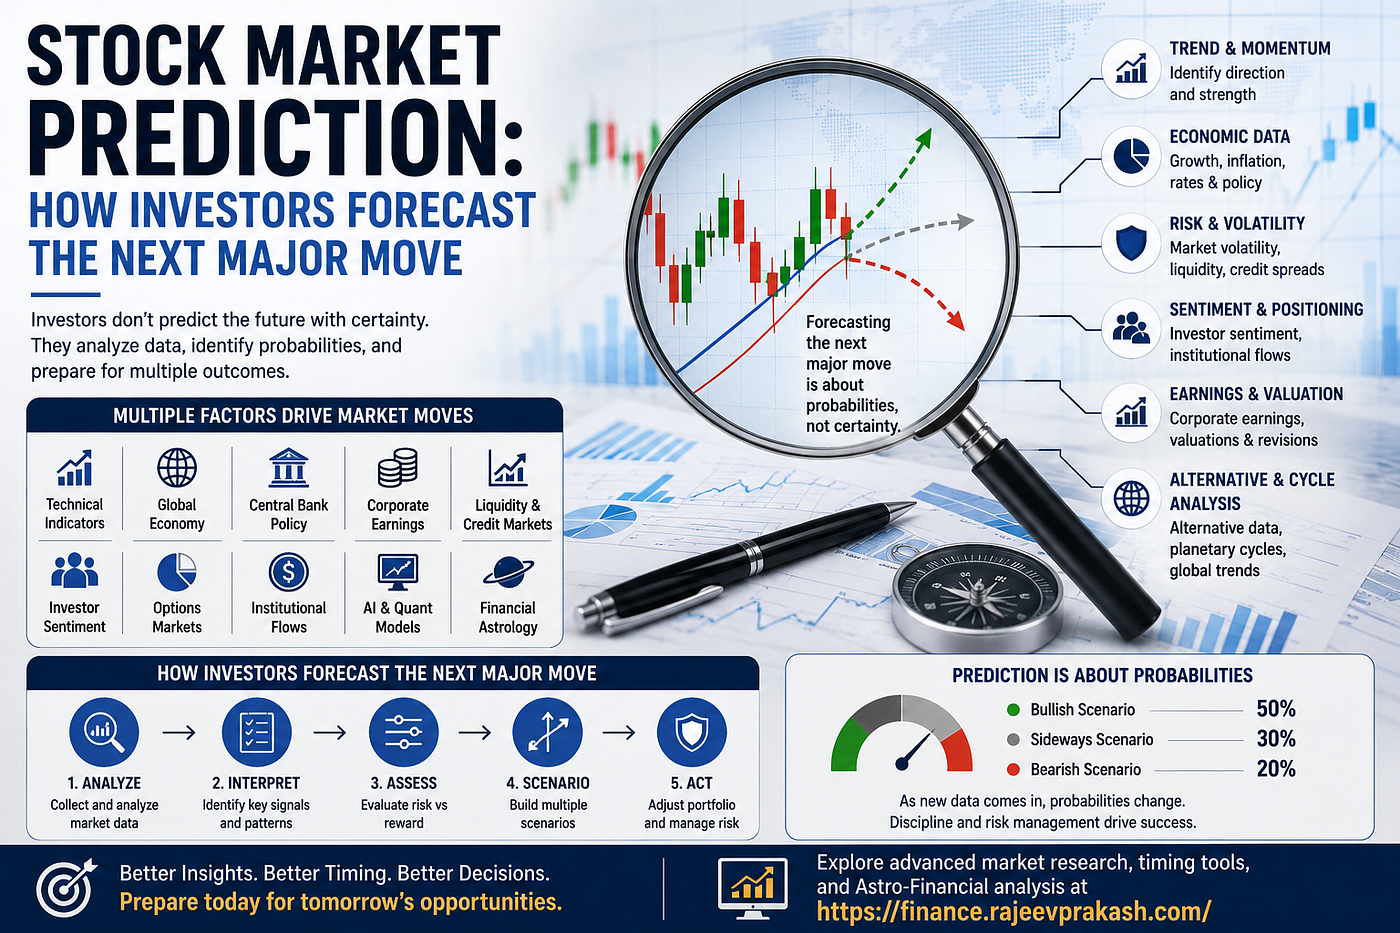
Modern stock market prediction is far more sophisticated than simply looking at a price chart and guessing whether stocks will rise or fall. Professional investors combine technical indicators, economic data, corporate earnings, liquidity conditions, market breadth, volatility, options positioning, investor sentiment, institutional flows, alternative data, and quantitative models to evaluate the probability of the next major move.
The key word is probability.
No indicator, artificial-intelligence model, economist, technical analyst, or market strategist can consistently predict every turning point. Markets respond to millions of decisions made by investors around the world, and unexpected developments can immediately change expectations.
The objective of professional forecasting is therefore not perfect prediction. It is to determine whether the balance between potential return and potential risk is changing.
When several independent indicators begin pointing in the same direction, investors may gain greater confidence that an important market transition is developing.
What Is Stock Market Prediction?
Stock market prediction is the process of estimating the future direction, volatility, or risk environment of financial markets using available information.
A prediction does not always need to specify an exact price target.
Professional investors may instead forecast that:
Market volatility is likely to increase.
A bullish trend remains intact.
Downside risk is becoming elevated.
A correction is becoming more probable.
The market is moving from accumulation to expansion.
Economic conditions are becoming less supportive for equities.
A major decline may be approaching a potential exhaustion phase.
This broader definition is important because forecasting an exact S&P 500 or NIFTY level on a particular date is much more difficult than identifying a changing market regime.
For institutional investors, understanding that change in regime can be more valuable than forecasting the exact closing price.
Why Predicting the Stock Market Is Difficult
Financial markets constantly discount expectations about the future.
A company may report excellent earnings and still decline because investors expected even better results.
Economic data may appear weak while stocks rise because the weakness increases expectations of easier monetary policy.
A technically bearish market may suddenly reverse after a policy announcement.
This makes markets complex adaptive systems.
Prices reflect:
Corporate fundamentals.
Interest rates.
Economic growth.
Inflation.
Liquidity.
Government policy.
Investor expectations.
Institutional positioning.
Leverage.
Sentiment.
Geopolitical developments.
Technological changes.
Millions of individual investment decisions.
Successful stock market prediction therefore requires understanding interactions rather than depending on one variable.
Start With the Primary Market Trend
Trend analysis remains one of the foundations of market forecasting.
Investors first want to determine whether prices are generally rising, falling, or moving sideways.
An uptrend normally consists of higher highs and higher lows.
A downtrend typically produces lower highs and lower lows.
Technical analysts may also use moving averages to identify broader market direction.
The 50-day and 200-day moving averages are commonly monitored, although professional models may evaluate numerous timeframes.
A market trading above rising long-term averages generally displays a different risk profile from one trading below declining averages.
Trend does not tell investors exactly when the next reversal will occur.
Its purpose is to define the existing market structure.
Forecasting becomes more useful when analysts identify evidence that the prevailing structure is beginning to change.
Momentum Can Reveal Changes Before Trend Reverses
Momentum measures the strength behind price movements.
A market can continue rising while momentum gradually weakens.
This divergence can sometimes indicate that buying pressure is losing strength.
Investors may analyse:
Rate of change.
Relative Strength Index.
MACD.
Price acceleration.
Relative strength.
Short- and medium-term momentum factors.
Suppose an index reaches a new high, but several momentum indicators fail to confirm that high.
This does not guarantee a correction.
However, if weakening momentum appears alongside deteriorating breadth, rising volatility, and worsening credit conditions, the combination becomes more meaningful.
The strongest forecasting frameworks seek confirmation between several different categories of signals.
Market Breadth Can Reveal What the Index Hides
One of the most valuable tools in stock market prediction is market breadth.
Headline indices can sometimes produce a misleading impression of market strength.
A capitalization-weighted index may continue rising because a small number of extremely large companies are performing strongly.
Meanwhile, hundreds of other stocks may already be declining.
Breadth measures participation.
Useful indicators include:
Advance-decline lines.
New highs versus new lows.
The percentage of stocks above their 50-day moving average.
The percentage above their 200-day moving average.
Equal-weighted index performance.
Sector participation.
Small-cap versus large-cap performance.
A rally supported by broad participation tends to look healthier than one driven by a shrinking number of companies.
Narrowing breadth is not a perfect top indicator, but it can identify structural weakness before a headline index begins falling.
Volume and Institutional Participation
Price tells investors where the market moved.
Volume can provide information about the level of participation behind that move.
A breakout occurring with expanding volume may carry different implications from one occurring during unusually light trading.
Institutions also analyse volume distribution.
Are investors accumulating shares during declines?
Is selling volume increasing?
Are large transactions appearing around particular price levels?
Is volume concentrated around options expiration or major news?
Volume should not be interpreted mechanically.
But when major price moves are accompanied by changing participation, analysts can gain additional insight into the conviction behind the trend.
Volatility Can Signal a Changing Market Environment
Volatility is central to forecasting major market moves.
Financial markets often move between periods of calm and turbulence.
Low volatility can persist during strong trends.
Rising volatility can indicate increasing uncertainty.
Investors may monitor both realized volatility and implied volatility.
Realized volatility measures how much prices have actually moved.
Implied volatility reflects expectations embedded in options prices.
A particularly interesting signal occurs when volatility begins rising even while an equity index remains close to its highs.
This divergence can suggest that investors are purchasing increasing amounts of protection before price weakness becomes obvious.
However, high volatility does not automatically mean additional declines.
Extremely high volatility frequently accompanies periods of panic and can sometimes occur near important market bottoms.
The direction and context of volatility matter more than a single reading.
Options Markets Provide Forward-Looking Information
Options markets can reveal how investors are positioning for future uncertainty.
Professional analysts may examine:
Put-call ratios.
Implied volatility.
Volatility skew.
Open interest.
Expiration concentrations.
Dealer positioning.
Unusual options activity.
Demand for downside protection.
Suppose investors aggressively purchase put options while the market remains near record highs.
This could indicate growing hedging demand.
Alternatively, extremely heavy put activity after a major decline could signal excessive pessimism.
The same indicator can have different interpretations depending on market conditions.
This is why options data works best when combined with price, volatility, sentiment, breadth, and liquidity.
Liquidity Can Drive Major Market Cycles
Liquidity is one of the most powerful forces affecting asset prices.
When money and credit are readily available, investors may become more willing to hold equities, speculative assets, and higher valuations.
When liquidity tightens, market behaviour can change significantly.
Investors may monitor:
Central-bank policy.
Financial conditions.
Short-term funding markets.
Interest rates.
Bank credit.
Money-market conditions.
Global dollar liquidity.
Credit availability.
Liquidity is not a direct buy-or-sell signal.
Markets can continue rising during tightening periods and decline during periods of monetary support.
However, liquidity helps define the environment in which other signals operate.
A strong price trend accompanied by supportive liquidity can be more durable than an extended market rally developing while liquidity conditions deteriorate sharply.
Interest Rates and Bond Markets Matter for Stocks
Stock investors cannot ignore the bond market.
Interest rates influence corporate borrowing, mortgage costs, economic demand, asset valuations, and capital allocation.
Real yields can be particularly important for growth stocks because many of their expected cash flows lie far in the future.
As discount rates rise, investors may assign lower present values to those future profits.
Bond markets can also reveal expectations about inflation and economic growth.
Professional market forecasters therefore watch:
Short-term yields.
Long-term yields.
Real yields.
Yield-curve relationships.
Inflation expectations.
Policy-rate expectations.
A significant shift in bond markets can eventually alter equity-market leadership and valuation.
Credit Spreads Can Warn of Financial Stress
Credit spreads measure the additional return investors demand for lending to companies rather than comparatively safer governments.
Narrow spreads often accompany confidence and easy financial conditions.
Rapidly widening spreads can indicate increasing concern about corporate finances or economic growth.
Credit sometimes deteriorates before major equity indices respond.
Imagine stocks reaching new highs while high-yield credit spreads begin widening materially.
The disagreement does not guarantee an immediate market decline.
But professional investors may interpret it as evidence that risk is increasing beneath the surface.
Credit conditions become particularly important when combined with weak breadth, tightening liquidity, and rising volatility.
Economic Growth and the Business Cycle
Long-term stock performance is closely connected with corporate profitability and economic activity.
Investors therefore analyse the business cycle.
Important indicators may include:
GDP growth.
Employment.
Consumer spending.
Manufacturing activity.
Services activity.
Housing.
Industrial production.
Business investment.
Economic growth can influence corporate revenues and earnings.
However, markets are forward-looking.
Stocks frequently begin declining before a recession becomes officially recognized and can begin recovering while economic data remains poor.
Forecasting therefore requires identifying changes in economic momentum rather than waiting for confirmation from backward-looking statistics.
Leading Economic Indicators
Leading indicators attempt to identify economic changes before they fully appear in headline data.
Examples can include:
New orders.
Building permits.
Consumer expectations.
Credit conditions.
Yield curves.
Employment trends.
Manufacturing expectations.
Business surveys.
When several leading indicators weaken together, investors may become more cautious about future corporate earnings.
When they begin improving after a downturn, the probability of economic stabilization may increase.
The relationship is not exact.
Nevertheless, combining leading indicators with market-based information can strengthen forecasting models.
Inflation and Monetary Policy
Inflation has enormous influence on stock-market expectations because it affects central-bank policy and interest rates.
When inflation rises sharply, central banks may tighten financial conditions.
Higher interest rates can slow borrowing and reduce economic demand.
They can also pressure equity valuations.
When inflation declines, monetary policy may eventually become more supportive.
However, the relationship is complicated.
Falling inflation caused by a severe recession is not necessarily bullish.
Investors therefore need to evaluate inflation together with economic growth.
A healthy disinflationary environment differs greatly from one in which inflation is falling because demand is collapsing.
Earnings Forecasts and Revisions
Corporate earnings are among the most important fundamental inputs in equity valuation.
Professional investors pay particular attention to revisions in future earnings expectations.
If analysts steadily increase earnings forecasts across many companies, the fundamental environment may be improving.
If estimates are repeatedly being reduced, future returns may face greater pressure.
The relationship between market prices and earnings expectations can also reveal important divergences.
Suppose the market continues rising while earnings expectations decline.
If valuations are already elevated, the rally may increasingly depend on multiple expansion rather than improving fundamentals.
That can make the market more vulnerable to disappointment.
Valuation Helps Measure Risk, Not Exact Timing
Valuation is frequently misunderstood as a short-term prediction tool.
An expensive market can remain expensive for years.
A cheap market can become even cheaper during a crisis.
Valuation therefore rarely tells investors exactly when the next major move will begin.
But it can provide important information about potential reward and vulnerability.
When valuations are extremely high, investors may require exceptional earnings growth, low interest rates, or abundant liquidity to justify additional upside.
If those supporting conditions deteriorate, downside risk can rise.
Conversely, unusually low valuations following a major decline may improve long-term return potential once economic and financial conditions stabilize.
Investor Sentiment Can Identify Extremes
Markets are influenced by psychology as much as economics.
Fear can create panic selling.
Greed can produce speculative bubbles.
Sentiment indicators attempt to measure these emotional extremes.
Investors may examine:
Bullish and bearish surveys.
Fund-manager positioning.
Retail trading activity.
Option activity.
News sentiment.
Social-media sentiment.
Fund flows.
Extremely optimistic markets can become vulnerable because many investors may already be fully positioned.
Extreme pessimism can create the opposite condition.
When almost everyone expects further declines, even moderately positive news can trigger a powerful recovery.
Sentiment is therefore frequently most useful as a contrarian signal at extremes.
Institutional Positioning Can Amplify Market Moves
Professional investors also study how capital is positioned.
A market does not move only because fundamentals change.
It also moves because investors must adjust positions.
Suppose hedge funds, systematic strategies, and retail traders are all heavily bullish.
A relatively small negative surprise can cause simultaneous selling.
Conversely, a heavily shorted market may rally aggressively if news improves.
Positioning analysis can include:
Futures exposure.
Hedge-fund leverage.
Options positioning.
Short interest.
ETF flows.
Systematic strategy exposure.
Mutual-fund allocations.
Forecasting becomes more sophisticated when analysts consider not simply what should happen, but what investors are already positioned for.
Cross-Asset Analysis Can Confirm the Next Move
One market rarely tells the entire story.
Professional investors analyse relationships between equities, bonds, credit, commodities, currencies, and volatility.
A healthy equity rally might occur alongside:
Stable credit spreads.
Improving industrial commodities.
Controlled volatility.
Supportive bond-market conditions.
Broad participation.
A more concerning rally might occur while:
Credit spreads widen.
Volatility rises.
Defensive assets strengthen.
Industrial commodities weaken.
Market breadth contracts.
These cross-asset divergences can provide early evidence that the market environment is changing.
Alternative Data for Stock Market Prediction
Modern investors have access to information far beyond conventional financial reports.
Alternative data can include:
Credit-card spending trends.
Web traffic.
App usage.
Shipping activity.
Satellite imagery.
Employment advertisements.
Search-engine activity.
Online pricing.
Consumer sentiment.
Geolocation trends.
The advantage of alternative data is timeliness.
Quarterly earnings can reveal what happened several months ago.
Real-time consumer or digital activity can sometimes provide clues about what is happening now.
However, data quality remains critical.
A dataset that is incomplete, biased, or poorly constructed can create misleading predictions.
Alternative data should therefore complement conventional analysis rather than automatically replace it.
Artificial Intelligence and Stock Market Prediction
Artificial intelligence is transforming financial forecasting.
Machine-learning systems can process enormous numbers of variables simultaneously.
A model might analyse:
Prices.
Volume.
Volatility.
Interest rates.
Corporate earnings.
News.
Alternative data.
Economic statistics.
Options activity.
Sentiment.
Liquidity.
AI can identify relationships that would be difficult for a human analyst to detect manually.
However, artificial intelligence does not eliminate uncertainty.
A major danger is overfitting.
If a model tests enough variables against historical data, it can discover patterns that occurred purely by chance.
Such a system may perform perfectly in historical simulations and fail immediately when exposed to real markets.
Professional quantitative research therefore requires out-of-sample testing and continuous validation.
Quantitative Models and Probability Scores
Instead of predicting simply “up” or “down,” sophisticated models may assign probabilities to different market regimes.
For example:
Bullish trend: 65% probability.
Sideways regime: 20%.
Bearish transition: 15%.
As new data appears, those probabilities can change.
This framework is more realistic than absolute prediction.
Portfolio exposure can then respond proportionally.
If risk increases moderately, exposure might be reduced modestly.
If multiple indicators deteriorate sharply, the portfolio can become substantially more defensive.
The goal is adapting faster than the market environment changes.
Financial Astrology as an Independent Timing Layer
Some market researchers also study financial astrology as a specialized timing framework.
Financial astrology examines whether astronomical and planetary cycles show repeatable relationships with market volatility, sentiment, or turning points.
Researchers may study:
Planetary conjunctions.
Oppositions and squares.
Jupiter-Saturn cycles.
Retrograde periods.
Lunar phases.
Solar and lunar eclipses.
Planetary ingress.
Long-term planetary relationships.
Unlike price-derived indicators, astronomical events can be calculated far in advance.
This creates predefined timing windows that can be compared with financial-market behaviour.
However, planetary cycles should not be treated as guaranteed directional predictions.
A more rigorous approach is to combine predefined astrological windows with conventional market indicators.
If an important cycle occurs while volatility rises, liquidity tightens, breadth deteriorates, credit weakens, and sentiment becomes extreme, researchers may assign greater significance to the period.
Historical testing and probability-based interpretation are essential.
How Investors Identify a Potential Market Top
Major market tops rarely depend on one indicator.
Instead, several vulnerabilities may gradually develop.
Potential warning conditions can include:
Extremely high valuations.
Narrowing market breadth.
Weakening momentum.
Rising implied volatility.
Tightening liquidity.
Increasing credit spreads.
Declining earnings expectations.
Extreme investor optimism.
Crowded positioning.
Technical breakdowns may eventually confirm the change.
None of these indicators guarantees a top.
But when several independent warning signs converge, investors may reduce exposure or increase hedging.
How Investors Identify a Potential Market Bottom
Market bottoms can be equally difficult to predict.
The environment is often dominated by fear.
Economic headlines may remain terrible.
Earnings expectations may still be declining.
Investors can nevertheless watch for signs of stabilization.
Potential bottoming signals include:
Extremely pessimistic sentiment.
Capitulation-level selling.
Very high volatility followed by contraction.
Improving market breadth.
Credit spreads stabilizing.
Liquidity becoming more supportive.
Positive price momentum divergences.
Major indices reclaiming important technical levels.
The market frequently improves before the economy does.
This is why waiting for universally positive economic news can result in missing a significant portion of the recovery.
Confirmation Matters More Than One Signal
Perhaps the most important lesson in stock market prediction is the value of confirmation.
Imagine an index reaching new highs.
That fact alone is bullish.
Now suppose breadth is improving, credit remains healthy, volatility is falling, earnings forecasts are rising, liquidity is supportive, and economic momentum is stable.
The bullish case becomes stronger.
Now consider the same new high while breadth weakens, credit spreads widen, implied volatility rises, liquidity tightens, and earnings revisions deteriorate.
The price looks identical.
The underlying environment does not.
Multi-signal analysis provides the context required to distinguish between these two situations.
Build a Multi-Layer Stock Market Prediction Framework
Investors can organize market forecasting into several layers.
The first layer measures trend.
The second evaluates momentum.
The third examines market breadth.
The fourth tracks volatility.
The fifth measures liquidity and financial conditions.
The sixth evaluates credit.
The seventh examines earnings and macroeconomic fundamentals.
The eighth measures sentiment and positioning.
The ninth uses cross-asset confirmation.
The tenth can incorporate alternative datasets or independent cyclical timing models.
Each layer asks a different question.
The objective is to determine whether these independent sources of information are beginning to converge.
Why Risk Management Is More Important Than Being Right
A forecast is only useful if it improves decision-making.
An investor can correctly predict a market decline and still lose money through poor implementation.
Likewise, an investor can be wrong frequently and remain successful if losses are small and gains are allowed to compound.
Professional investors therefore focus heavily on:
Position sizing.
Diversification.
Portfolio beta.
Liquidity.
Hedging.
Stop policies where appropriate.
Scenario analysis.
Exposure limits.
Market prediction should guide risk management rather than replace it.
The important question is not simply, “Will stocks fall?”
It is, “How much capital should I risk if my forecast is wrong?”
Avoiding the Search for the Perfect Indicator
There is no perfect market indicator.
Moving averages fail.
Sentiment fails.
Economic models fail.
Earnings forecasts fail.
Volatility indicators fail.
Artificial-intelligence models fail.
Even combinations of signals will sometimes produce incorrect predictions.
The objective should therefore be resilience.
Instead of searching endlessly for a forecasting system with a 100% success rate, investors can build frameworks that survive inevitable mistakes.
This is the difference between prediction and professional risk management.
The Future of Stock Market Prediction
The future of stock market prediction will likely involve increasingly integrated systems.
Artificial intelligence may continuously analyse:
Equity prices.
Bond markets.
Options.
Corporate filings.
Economic releases.
Central-bank communication.
Consumer transactions.
Alternative data.
News sentiment.
Institutional positioning.
Global liquidity.
Independent market cycles.
The challenge will no longer be obtaining information.
The challenge will be identifying which information genuinely has predictive value.
Human judgment will remain important because market relationships change.
A strategy that worked during one monetary regime may become ineffective in another.
Forecasting models therefore need continuous testing and adaptation.
Final Thoughts on Stock Market Prediction: How Investors Forecast the Next Major Move
Stock Market Prediction: How Investors Forecast the Next Major Move is ultimately about combining information rather than searching for one magical indicator.
Trend shows what price is doing.
Momentum measures the strength of that movement.
Market breadth reveals participation.
Volatility measures uncertainty.
Options show how investors are pricing future risk.
Liquidity defines the financial environment.
Bond and credit markets provide cross-asset confirmation.
Economic data reveals changes in growth and inflation.
Earnings revisions measure the direction of corporate fundamentals.
Sentiment and positioning indicate whether investor expectations have become extreme.
Alternative data can provide additional real-time evidence.
Quantitative and artificial-intelligence models can process these signals at scale.
Independent cyclical methods can add another timing dimension when they are tested objectively.
None of these tools can guarantee the next major move.
Their value lies in identifying when probabilities are changing.
A professional forecasting framework therefore does not ask only whether the market is bullish or bearish.
It asks whether risk is increasing or decreasing, whether the current trend is broadly supported, whether market expectations are becoming vulnerable, and how portfolio exposure should change if the evidence becomes stronger.
That approach transforms stock market prediction from speculation into structured market research.
For investors, traders, family offices, hedge funds, asset managers, and market researchers seeking advanced tools for stock market prediction, market timing, volatility analysis, quantitative signals, financial astrology, planetary cycles, alternative data, and multi-layer financial-market research, explore : https://finance.rajeevprakash.com/
메타데이터
- post_id
- df738aa276b5
- slug
- stock-market-prediction-how-investors-forecast-the-next-major-move-df738aa276b5
- url
- https://medium.com/@astrohulk/stock-market-prediction-how-investors-forecast-the-next-major-move-df738aa276b5
- canonical_url
- https://medium.com/@astrohulk/stock-market-prediction-how-investors-forecast-the-next-major-move-df738aa276b5
- author_url
- https://medium.com/@astrohulk
- status
- ok
- fetched_at
- 2026-08-18 09:49:05