Export 3D Plots in Python with Plotly
Related video:
Wiki topics:
🌐 · Web Development
Export 3D Plots in Python with Plotly
Related video:
If you want to make a plot in python, your number one choice is probably matplotlib.
If you want to export a 2D plot, you can use matplotlib to save it as a svg in a lossless manner.
plt.savefig('filename.svg')What if you want to make a 3D plot?
Sure, you can use matplotlib to plot, but it’s nearly impossible to export it in an easily accessible and viewable manner.
import numpy as np
import matplotlib.pyplot as plt

data = {
    'x': [],
    'y': [],
    'z': [],
    'size': [],
    'color': [],
    }

side = 3

for x in range(1, side+1):
    for y in range(1, side+1):
        for z in range(1, side+1):
            size = (x * y * z / side**3) * 100
            color = np.log10((side**3)/(x * y * z))
            data['x'].append(x)
            data['y'].append(y)
            data['z'].append(z)
            data['size'].append(size)
            data['color'].append(color)

fig = plt.figure()
ax = fig.add_subplot(projection='3d')

graph = ax.scatter(data['x'],
                   data['y'],
                   data['z'],
                   s=data['size'],
                   c=data['color'],
                   cmap='viridis',
                   alpha=1,
                   linewidths=0,
                   edgecolors=None)

ax.set_title('matplotlib')
ax.set_xlabel('x')
ax.set_ylabel('y')
ax.set_zlabel('z')
ax.set_xticks(np.unique(data['x']))
ax.set_yticks(np.unique(data['y']))
ax.set_zticks(np.unique(data['z']))

fig.colorbar(graph, location='left')

plt.show()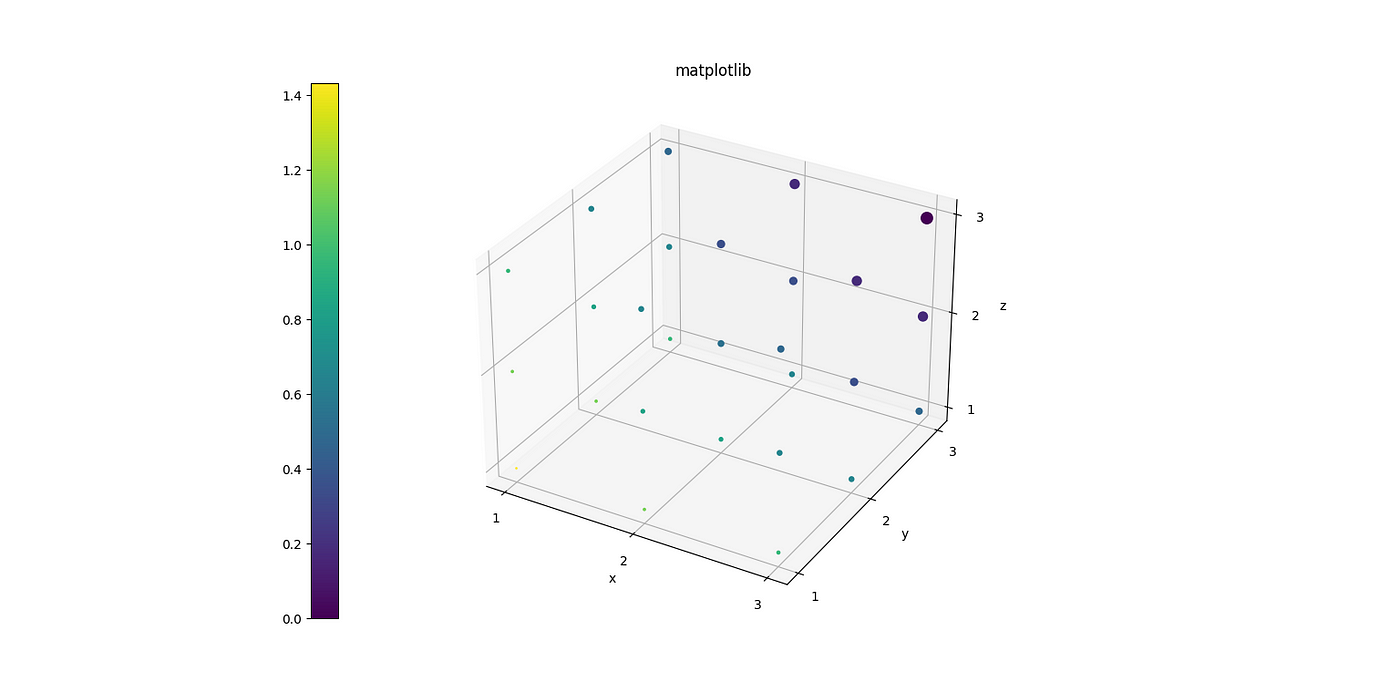
This is where plotly comes in
[embed]Plotly Plotly'splotly.com
You can export 3D plots as html files in a lossless manner using plotly.
import numpy as np
import pandas as pd
import plotly.express as px

data = {
    'x': [],
    'y': [],
    'z': [],
    'size': [],
    'color': [],
    }

side = 3

for x in range(1, side+1):
    for y in range(1, side+1):
        for z in range(1, side+1):
            size = (x * y * z / side**3) * 100
            color = np.log10((side**3)/(x * y * z))
            data['x'].append(x)
            data['y'].append(y)
            data['z'].append(z)
            data['size'].append(size)
            data['color'].append(color)

df = pd.DataFrame(data)

fig = px.scatter_3d(df,
                    x='x',
                    y='y',
                    z='z',
                    color='color',
                    size='size',
                    size_max=df['size'].max(),
                    title='plotly',
                    opacity=0.8,
                    color_continuous_scale='viridis',
                    )

fig.update_layout(margin=dict(l=0, r=0, b=0, t=50))

fig.write_html('filename.html')

fig.show()
Then anyone can open them with a web browser and interact with the 3D plots.

Example Plotly HTML file
- Google Drive link
- Download it and open with your web browser.
메타데이터
- post_id
- dfa0cbff671c
- slug
- export-3d-plots-in-python-with-plotly-dfa0cbff671c
- url
- https://medium.com/@hdpoorna/export-3d-plots-in-python-with-plotly-dfa0cbff671c
- canonical_url
- https://medium.com/@hdpoorna/export-3d-plots-in-python-with-plotly-dfa0cbff671c
- author_url
- https://medium.com/@hdpoorna
- status
- ok
- fetched_at
- 2026-07-24 17:05:14