Information gain , Entropy , Sigmoid and SoftMax , Cross Entropy
Expected Value
Information gain , Entropy , Sigmoid and SoftMax , Cross Entropy
Expected Value
It is the long-term average outcome of a random event if it were to be repeated many times. It is probability weighted average of all possible values.
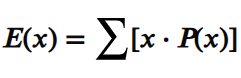
- E(X) is the expected value.
- x is each possible outcome
- P(X=x) is probability of each outcome
Lottery Ticket Example
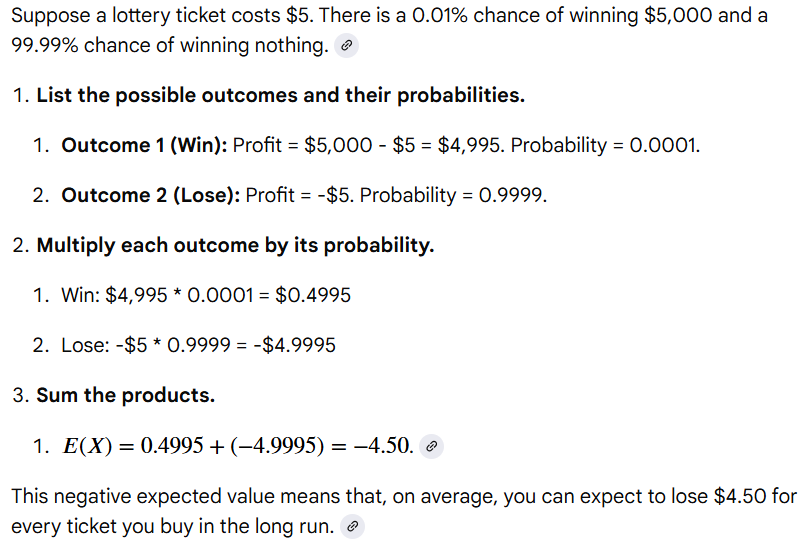
Fair Die (Equally Likely Example that leads to fractional outcome)
When rolling a fair six-sided die, the possible outcomes are 1, 2, 3, 4, 5, and 6. Each has an equal probability of 1/6 which is equally likely. The expected value is 3.5 is the average of all the outcomes. You can never roll a 3.5, but over many rolls, the average result will approach this value.
Law of Large Numbers
The average will stabilize: When number of trials/repetitions of an experiment increases, the average of the results will get closer to the expected value.
Infinite trials, exact value: When number of trials approaches infinity will the sample average be guaranteed to equal the expected value.
Example of Coin Toss
- Theoretical expected value: If you toss a fair coin, the theoretical expected value for getting “heads” is 0.5.
- 5 trials: You might get 4 heads and 1 tail, for an average of 0.8. This is far from 0.5.
- 1,000 trials: You might get 510 heads and 490 tails, for an average of 0.51. This is much closer to the expected value.
- Infinite trials: If you could toss the coin an infinite number of times, the proportion of heads would be exactly 0.5.
Long-term average: Expected value is not the outcome of a single trial, but the average value you would get after performing the experiment countless times
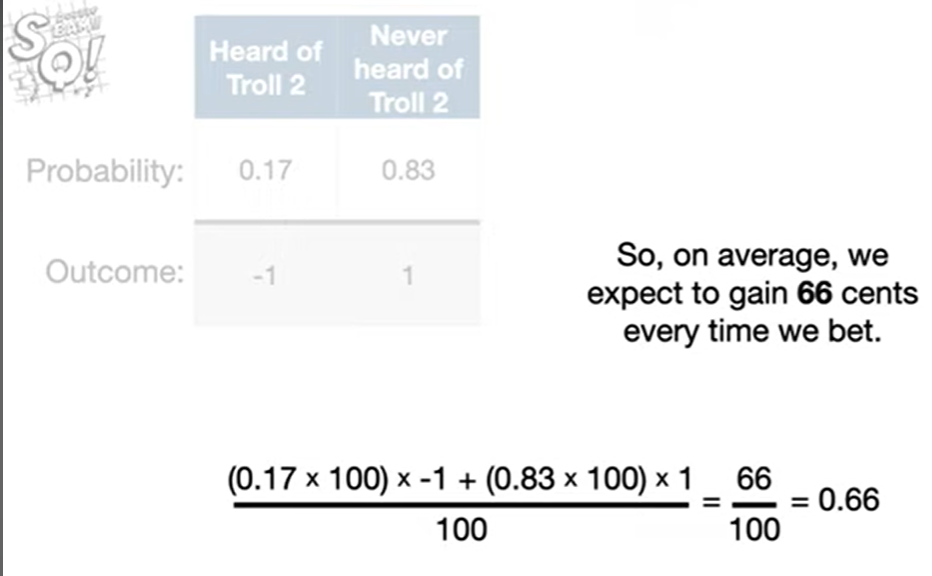
Note: We will win or loss 1 dollar each time , however each time we expect to gain 0.66 cents.
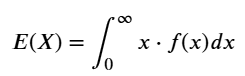
Expected Value of Continues Variable
If we have discrete outcome we have discrete variable else if we have we have continuous outcomes we have continuous variable.
Surprise / Information gained
Information: In information theory , Information is reduction of uncertainty and it is quantifiable measure of surprise.
- An certain event (100% probability) which you knew will happen as 0 information.
- Unlikely event are more informative as highly improbable outcome is more surprising.
- Information from independent events is additive.
Note: The surprise is relative to your existing knowledge. The same message can contain different amounts of information for two different people depending on their existing knowledge.
Examples
- I said Sun rises in east has 0 information as outcome was certain.
- I said Tomorrow there is 30% chance of rain . When you receive message stating “it rained”. That message has a quantifiable amount of information because outcome was uncertain. Before the event you are in state of uncertainty (30% chance of rain) of outcome. After event occurs with confirmation it rained your uncertainty resolved to 0. Shannon’s formula quantifies how much uncertainty was removed.
- When is information gained : When outcome is revealed only then you gain information. How much you gain it is -log(0.3)
One Bit : One bit is the amount of information gained when your uncertainty is reduced by half . Other way of saying when your set of possibilities is reduced by half.
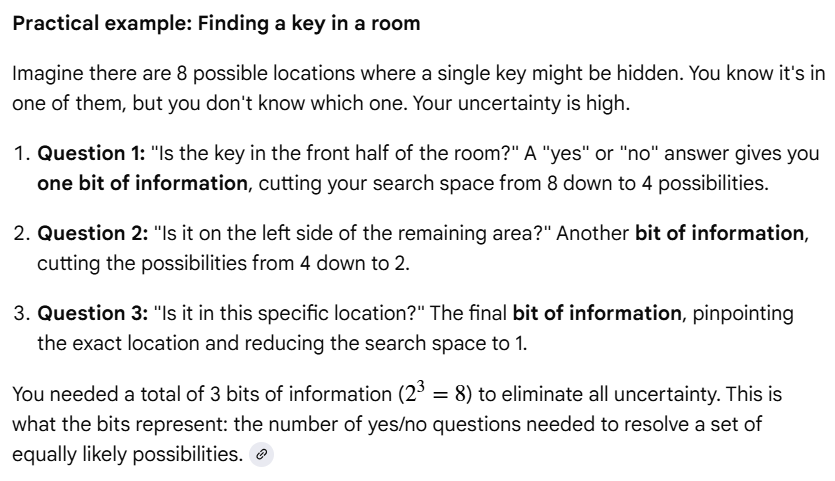
Practical Example : Huffman Coding for Compression
Most frequent character (less information) encoded with (1 bit)less bits and infrequent or rare characters (more information) ( 2 or 3 bit) are encoded with more bits. This variable encoding scheme leads to File Reduction.
Surprise / Information gain (Mathematically)
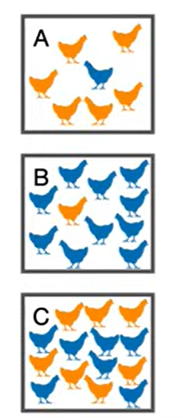
Pick Chickens
Scenario A: if you pick a blue chicken that would surprise because probability of picking blue chicken is low , if you pick orange chicken one that will not be that surprising because probability of picking orange chicken is high.
Scenario B: if you pick a orange chicken that would surprise because probability of picking orange chicken is low, if you pick blue one that will not be surprising because probability of picking blue chicken is high.
Scenario C: if you pick a blue chicken or orange chicken that would equally surprising. because probability of picking either is equally likely. This has higher entropy.
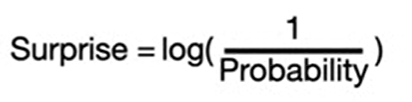
Hence Surprise is inversely proportional to probability. The logarithm ensures that events with a probability of 1 have a surprise of 0
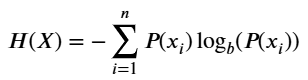
Entropy : Entropy is the expected value of the surprise over all possible outcomes.
Sigmoid (S-Curve)
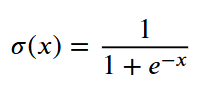
A sigmoid function is a mathematical function that takes any real-valued number and maps it into a value between 0 and 1. It is shaped like the letter “S” and is most commonly used for binary classification tasks.
Graph
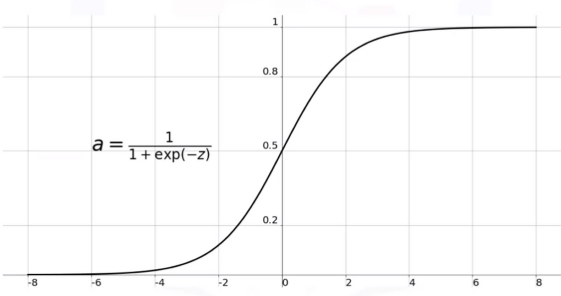
- X- axis represent input values which can be real number from -infinity to + infinity
- Y-axis represent output values which are between 0 and 1.
- It is centered at origin (0,0.5)
- It approaches the horizontal asymptotes at y = 0 and y = 1 as x approaches — infinity and + infinity respectively.
Rate of Change
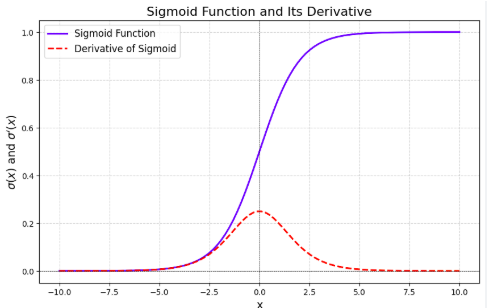
From derivative graph we can observe that
- The rate of change/derivate is highest when x = 0.
- Region around the inflection point x =0 , a small change in the input value results in the largest change in the output value i.e. rate of change/derivative is high.
- Vanishing gradient Problem: As x approaches extreme positive and negative values , the rate of change/ derivate becomes very small causing vanishing gradient problem in Neural Networks due to which learning stops for some parameters.
- There is rapid change around the center and slow change at extremes.
SoftMax
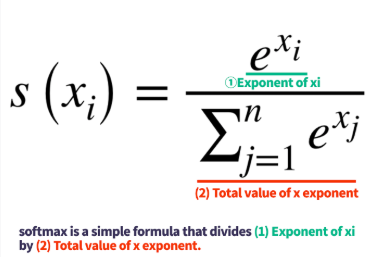
A softmax function is a mathematical function that takes a vector of raw scores (called logits) and converts them into a probability distribution, where all the probabilities add up to 1. It is designed for multi-class classification problems where there are more than two possible outcomes.
- Linear difference , consider y=2x , for every unit increase in the input x , output increases by constant amount 2.
- The absolute difference between outputs stays constant, so any initial difference between input values is preserved proportionally in the output
Amplification
- Exponential difference y=e^x, for every unit increase in input x out dose not increase by constant amount.
- The rate of change is not constant; it increases as the function’s value increases. The difference between outputs grows much more quickly as the input values get larger
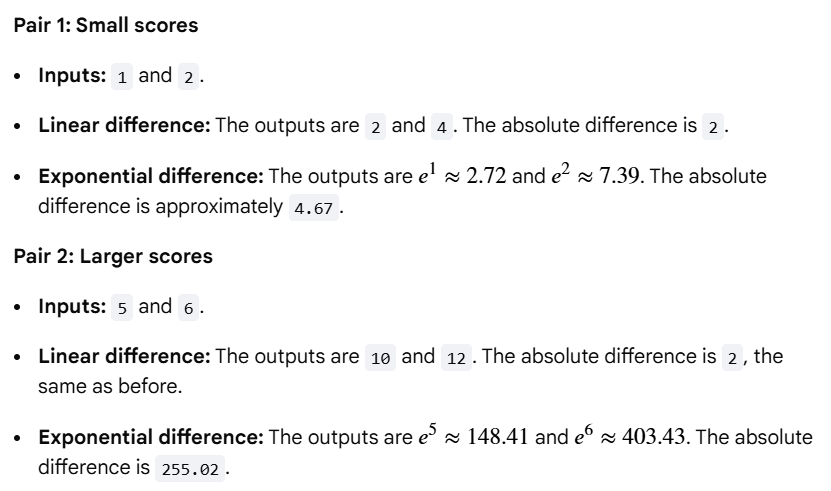
This amplification property of e ^ x is important for the following reasons
Degree of certainty : Model express a high degree of certainty. When one score is even slightly higher than the others, SoftMax will push its probability much closer to 1, while simultaneously pushing the probabilities of the other classes much closer to 0.
Help in training : A large, correct logit for a class results in a very high probability, leading to a low loss value. A large, incorrect logit, however, results in a very high loss, forcing the model to make significant corrections
Note: Logit is the raw, unnormalized predictions generated by a model before applying any activation function.
메타데이터
- post_id
- dfc19f6efd19
- slug
- information-gain-entropy-sigmoid-and-softmax-cross-entropy-dfc19f6efd19
- url
- https://medium.com/@siddharthsamber94/information-gain-entropy-sigmoid-and-softmax-cross-entropy-dfc19f6efd19
- canonical_url
- https://medium.com/@siddharthsamber94/information-gain-entropy-sigmoid-and-softmax-cross-entropy-dfc19f6efd19
- author_url
- https://medium.com/@siddharthsamber94
- status
- ok
- fetched_at
- 2026-06-13 12:55:53


