Resampling Financial Data for Algorithmic Trading: A Beginner’s Guide
In the world of algorithmic trading, financial market data comes in various timeframes, from high-frequency tick data (every trade) to…
Resampling Financial Data for Algorithmic Trading: A Beginner’s Guide
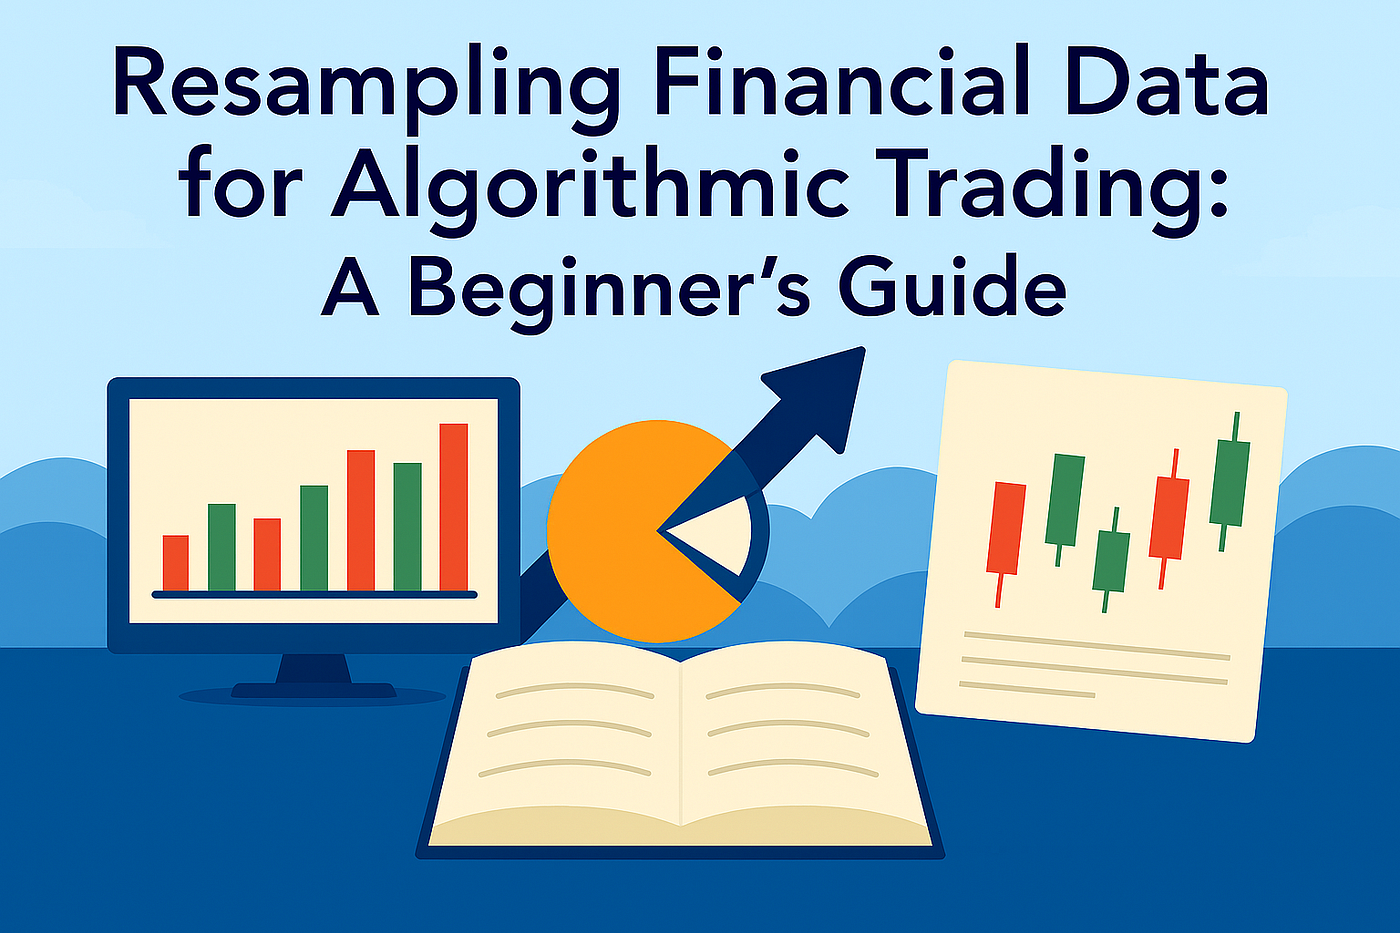
In the world of algorithmic trading, financial market data comes in various timeframes, from high-frequency tick data (every trade) to daily, weekly, or even monthly bars. While many strategies require granular, minute-by-minute data to capture short-term movements, others are based on longer-term trends. This is where resampling comes in.
Resampling is the process of converting your data from one frequency to another. For an algorithmic trader, this typically means taking granular data (like 1-minute bars) and aggregating it into larger, less frequent timeframes (such as 15-minute, 30-minute, or 1-hour bars). This is a foundational skill that allows you to simplify data, reduce noise, and develop strategies that operate on different timescales.
Note: — It is possible to resample Lower Frequency Data into Higher Frequency Data but vice-versa is not possible.
Why Resample?
- Reduce Noise: Short-term fluctuations, or “noise,” can often obscure the underlying trend. Aggregating data into longer timeframes can help smooth out these movements, making the true trend easier to identify.
- Align with Strategy: Your trading strategy may be designed to work on a specific timeframe. For example, a mean-reversion strategy might be most effective on a 30-minute chart, while a trend-following strategy might use 1-hour bars. Resampling allows you to create the data you need for your specific approach.
- Improve Performance: Working with 1-minute data for a long period can be computationally expensive. Resampling to a larger timeframe reduces the number of data points you need to process, which can significantly speed up your backtesting and analysis.
How to Resample: The Resample() Method
Resampling is a crucial technique for algorithmic trading, as it allows you to create custom-frequency data from more granular data. Instead of purchasing data for different timeframes (like 15-minute, 1-hour, or monthly), you can easily generate them yourself from minute-level data using the pandas.resample() method. The process involves defining a dictionary that specifies how each column should be aggregated. For example, you would map the Open value to the first value in the new time frame, High to the maximum value, Low to the minimum, Close to the last value, and Volume to the sum of values. It is important that the keys in this dictionary match the column names in your DataFrame. Here is a sample code snippet provided as an example:
# Aggregate function
ohlcv_dict = {'Open': 'first',
              'High': 'max',
              'Low': 'min',
              'Close': 'last',
              'Volume': 'sum'
             }
The resample() method can be used now to resample the data to the desired frequency.
Method syntax:
DataFrame.resample(interval).agg(aggregate)Method parameters:
- interval: Resampling interval -15T for 15 minutes, (H is for hour, D is for days, M is for months)
- aggregate: Dictionary with aggregating values to be used while resampling
Method returns: Resampled dataframe
Here is an example of a code snippet resampling the granualar data to 15 min time frame
apple_minute_data_15M = apple_minute_data.resample('15T').agg(ohlcv_dict)

# Drop the missing values
apple_minute_data_15M.dropna(inplace=True)

# Display the first 5 rows
apple_minute_data_15M.head()
The following Python code, using the powerful pandas library, demonstrates resampling for different time frames. The script generates a sample of 3days of 1-minute OHLCV data and then resamples it into 15-minute, 30-minute, and 1-hour timeframes, printing the results for each.
import pandas as pd
import yfinance as yf
import time

# --- 1. Download 1-Minute Data for Apple (AAPL) ---

print("--- Original 1-Minute Data for AAPL ---")

ticker = "AAPL"
start_date = "2025-07-28"
end_date = "2025-07-31"

# Download the 1-minute data using yfinance
# A try-except block to handle potential rate-limiting errors.
try:
    df_1min = yf.download(ticker, start=start_date, end=end_date, interval="1m")

    # Handle the potential MultiIndex error by explicitly renaming columns
    # and converting them to lowercase if they are not already.
    # This makes the code more robust.
    if isinstance(df_1min.columns, pd.MultiIndex):
        df_1min.columns = ['_'.join(col).strip() for col in df_1min.columns.values]
    df_1min.columns = [col.lower().replace(' ', '_') for col in df_1min.columns]

except Exception as e:
    print(f"Error downloading data: {e}. The yfinance API might be rate-limiting requests. Please try again later.")
    df_1min = pd.DataFrame() # Create an empty DataFrame to prevent errors later

# Check for a valid DataFrame
if df_1min.empty:
    print(f"No data found for {ticker} between {start_date} and {end_date}. Please check the dates or try again later.")
else:
    print("Downloaded 1-minute data:")
    print(df_1min.head())
    print("\n" + "-"*50 + "\n")

    # --- 2. Resample to 15-Minute Bars ---
    # The resample() method is used to group data by a new frequency.
    # We use an aggregation dictionary to specify how each column should be
    # transformed within the new timeframe.
    # - 'open': first value
    # - 'high': highest value
    # - 'low': lowest value
    # - 'close': last value
    # - 'volume': sum of values

    print("--- 15-Minute Resampled Data ---")
    df_15min = df_1min.resample('15min').agg({
        'open_aapl': 'first',
        'high_aapl': 'max',
        'low_aapl': 'min',
        'close_aapl': 'last',
        'volume_aapl': 'sum'
    })

    # Drop any rows that are entirely NaN (e.g., non-trading periods)
    df_15min = df_15min.dropna()

    print(df_15min.head())
    print("\n" + "-"*50 + "\n")

    # --- 3. Resample to 30-Minute Bars ---
    print("--- 30-Minute Resampled Data ---")
    df_30min = df_1min.resample('30min').agg({
        'open_aapl': 'first',
        'high_aapl': 'max',
        'low_aapl': 'min',
        'close_aapl': 'last',
        'volume_aapl': 'sum'
    })

    df_30min = df_30min.dropna()

    print(df_30min.head())
    print("\n" + "-"*50 + "\n")

    # --- 4. Resample to 1-Hour Bars ---
    print("--- 1-Hour Resampled Data ---")
    df_1H = df_1min.resample('h').agg({
        'open_aapl': 'first',
        'high_aapl': 'max',
        'low_aapl': 'min',
        'close_aapl': 'last',
        'volume_aapl': 'sum'
    })

    df_1H = df_1H.dropna()

    print(df_1H.head())
    print("\n" + "-"*50 + "\n")

    # --- 5. Conclusion ---
    # As you can see from the printed outputs, the original 1-minute data has been
    # successfully transformed into new, larger timeframes. This technique is vital
    # for simplifying data and is the first step in building many different
    # types of trading strategies.
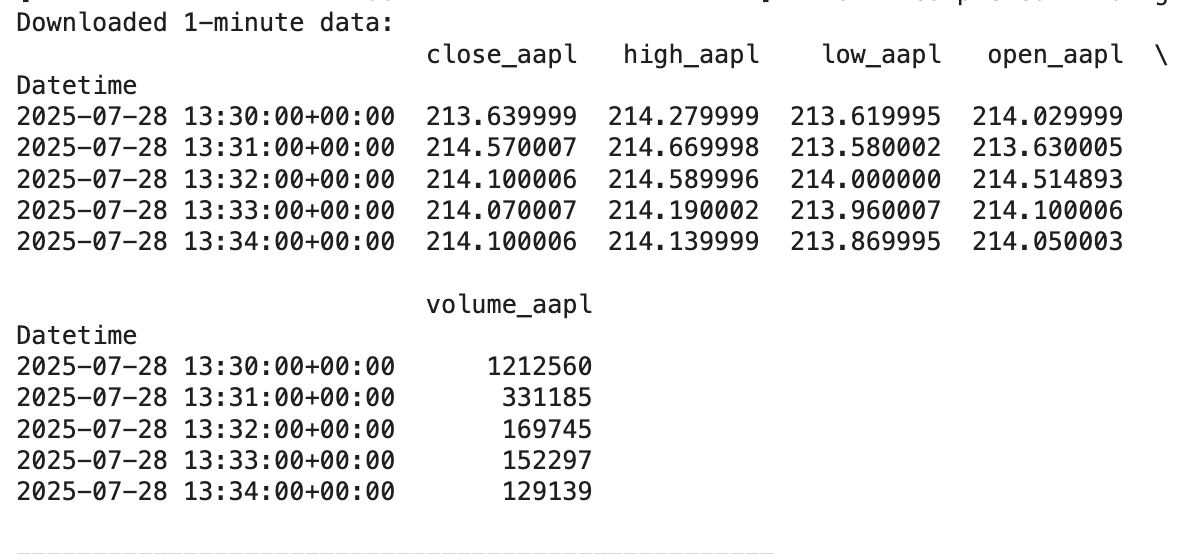
Below is the download 1 min data for apple stock for the three day time.
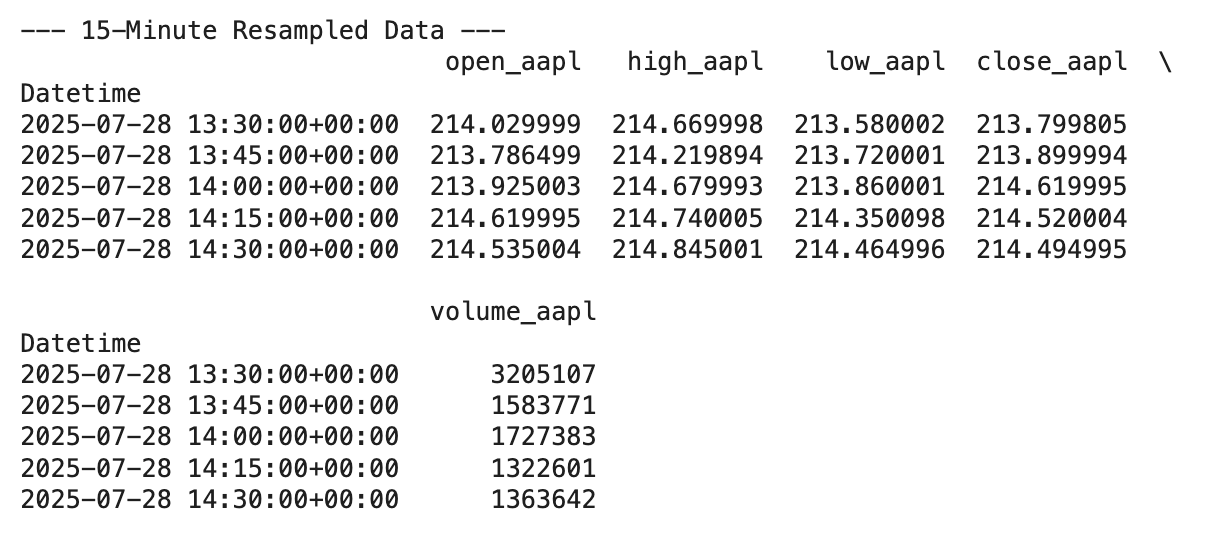
1min data is resampled to 15 min time frame data
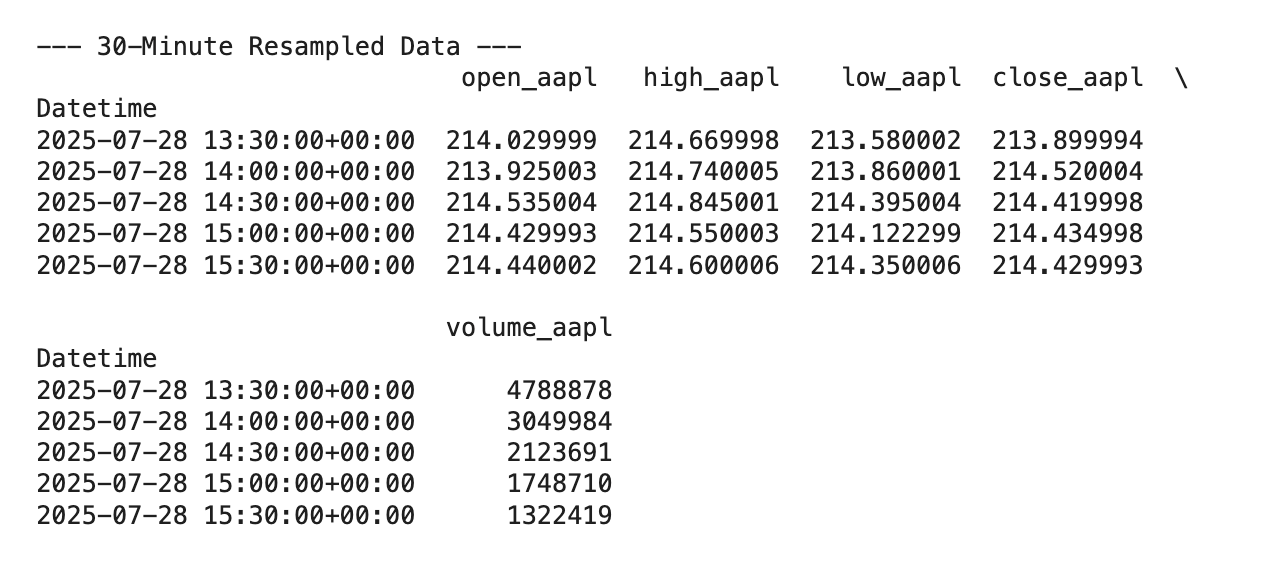
Resampled 30 Min time frame data
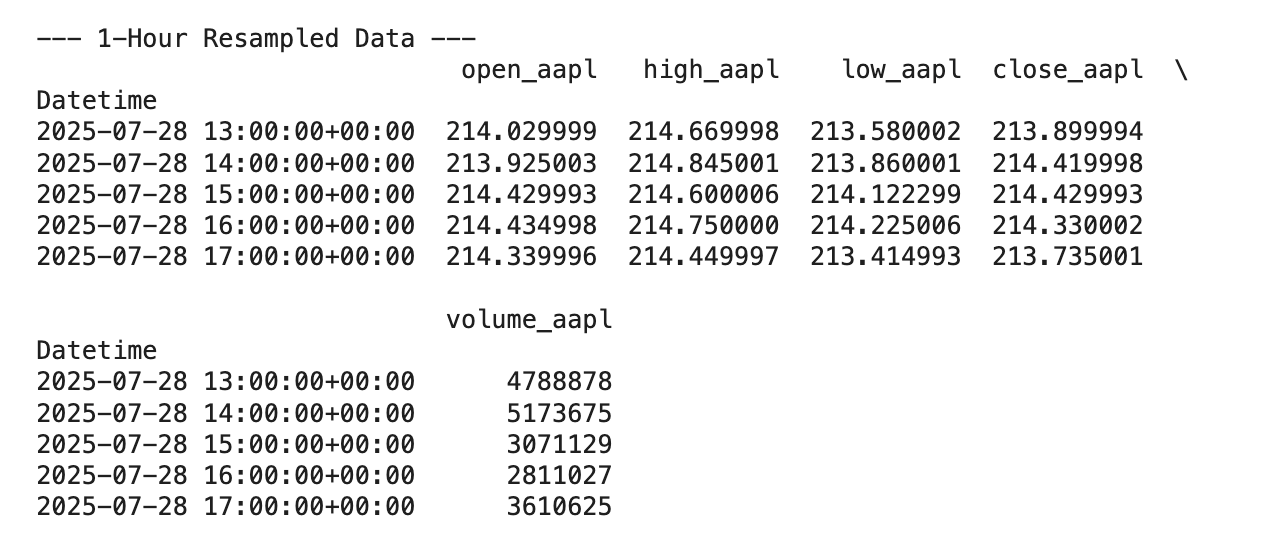
Finally resampling done to 1H timeframe
Resampling is a fundamental and powerful technique for any aspiring algorithmic trader. It allows you to transform raw, granular data into the specific timeframes required by your trading strategies. By mastering this process, you can effectively reduce market noise, improve the performance of your backtesting scripts, and align your data with the logic of your trading system. The example provided using Python’s pandas library, demonstrates just how straightforward this process can be.
Now that you know how to resample, you can begin to explore how different timeframes affect your trading signals. You can also experiment with other aggregation methods to see how they impact your strategy.
메타데이터
- post_id
- dfd7a9723f45
- slug
- resampling-financial-data-for-algorithmic-trading-a-beginners-guide-dfd7a9723f45
- url
- https://medium.com/algorithmic-and-quantitative-trading/resampling-financial-data-for-algorithmic-trading-a-beginners-guide-dfd7a9723f45
- canonical_url
- https://medium.com/algorithmic-and-quantitative-trading/resampling-financial-data-for-algorithmic-trading-a-beginners-guide-dfd7a9723f45
- author_url
- https://medium.com/@bhaskarndas
- status
- ok
- fetched_at
- 2026-07-09 17:12:49