Komoot Heatmap: Combining Cycling and Programming
Visualizing you Cycling Adventures.
Komoot Heatmap: Combining Cycling and Programming
Visualizing you Cycling Adventures.
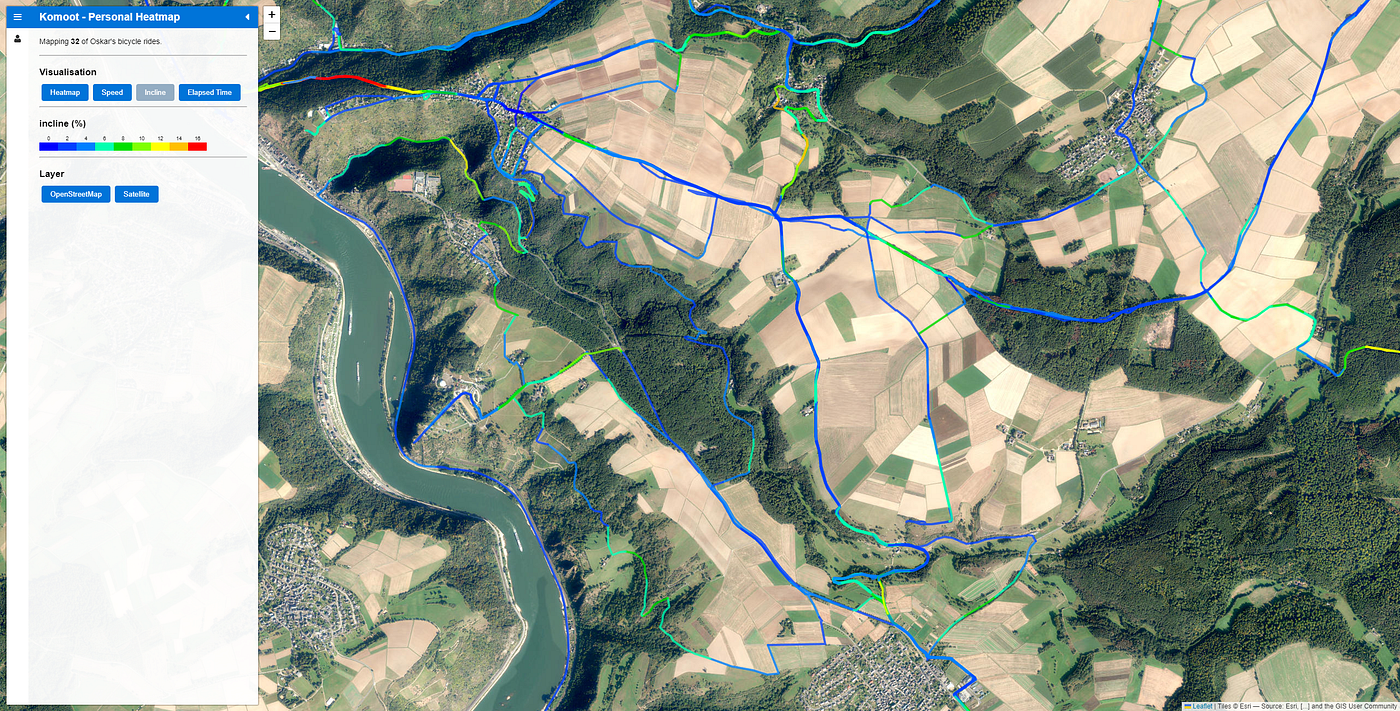
Try it out for yourself! https://komoot.oskarkraemer.me/
Introduction
With Strava’s ecosystem being one of the largest in the cycling community with Tools like StatsHunters or their Global Heatmap that allow riders to visualize and gamify their rides in unique and interesting ways, I noticed that Komoot on the other hand, is seriously underwhelming when it comes to third party tools.
However, switching to Strava was no option for me since I very much preferred Komoot’s route planner and map but still desperately wanted to have a heatmap.
The result? The Komoot Personal Heatmap — an interactive tool that allows cyclists to visualize their riding adventures in ways they never thought possible.

StatsHunters Squares
The Beginning
Starting 2023, I started development on the project not knowing it will be harder that I thought it would be.
I mostly worked on it in my free-time after school.
My plan was the following:
- pull the GPX route data from my Komoot profile
- setup a Leaflet map with Open Street Map
- plot every route on that map
In theory, very simple!
API Hell
In order to even get the route data in the first place, I needed some sort of API to pull the data from Komoot.
Luckily (I thought), the actually is an official Komoot API. And it even supports OAuth2 and is somewhat documented, great! (I thought). At this point I was not even surprised that had an API, I mean Strava does too, right?

Documentation of the official Komoot API
However, after taking a closer look, I noticed you need an API key to use it. And where do you get that API key? Correct, requesting it from the Komoot-Partner team. After sending an E-Mail, I quickly (after about 1 1/2 week) got a response stating that:
“it is only available to a few selected partners”
This was very disappointing.
Third-party libraries came to rescue!
Luckily, I found out that there is somewhat of a public Komoot API; namely the one that the Frontend uses to talk to the Backend. What was even better was that there were Python libraries in GitHub that provided easy access to those (thanks to Nishad Mandlik for *komPYoot*).
However one huge drawback of these third-party implementations was that they did not support OAuth2 (Login with Komoot). This made publishing / hosting the app very difficult, since the user has to enter their Komoot credentials, requiring a lot of trust into the admin. This also convinced me to make the source code publicly available, allowing everyone to host / check the code.

Login Screen
Red lines do be lining
I began with the standard Heatmap visualization (more followed later). This turned out to be rather simple.
// Initialize the map
var map = L.map('map').setView([50.161, 7.749], 13);
L.tileLayer('https://{s}.tile.openstreetmap.org/{z}/{x}/{y}.png', {
  attribution: 'OpenStreetMap contributors',
  maxZoom: 18,
}).addTo(map);

//Query the tours data from the Python backend
var tours = {};

var request = new XMLHttpRequest();
request.open('GET', './tours_data', false);
request.send(null);

if (request.status === 200) {
    tours = JSON.parse(request.responseText);
}

//For every route, load gpx file and add route to the map
for (var i = 0; i < tours.length; i++) {
  var gpx = tours[i];
  new L.GPX(gpx, {
      polyline_options: {
        color: 'red',
        weight: 3,
        opacity: 0.5
      },
      async: true,
      gpx_options: {
          parseElements: ['track', 'route']
      }
  }).on('loaded', function(e) {
      map.fitBounds(e.target.getBounds());
  }).addTo(map);
}- When loading the page, JavaScript sends a GET request to the Python Flask-server, to retrieve all Komoot tours. (using the API above)
- JavaScript than plots every route onto a Leaflet map with a bit of transparency (leading to the Heatmap effect)

First version of the Heatmap
The Pause
After finishing my first concept, I sometimes looked into but ultimately called it a day. Initially, I did not really think of publishing or even advertising it but after showing it to friends and family, I noticed there was actually great interest in such tool.
So after about 4 months of pause, I continued development on the project.
Adding Visualizations
Just a red line is kind of boring, so I added 3 new unique ways to visualize the tours.
- Speed
- Incline
- Elapsed Time (showing how much time you spent on a particular point on a route)
To make everything more user-friendly, I put on a side-menu and a legend with labels for the metrics.
Lastly, I also implemented satellite imagery support and a donation button (P.S. This costed me quite some time and effort so if you like the project, I would seriously appreciate a little donation to cover the server costs :) Thanks.)

Publishing / Advertising
As I more and more approached the final version, I rented a domain (komoot.oskarkraemer.me), polished the Login screen and Menu and added Google Analytics to track performance just out of curiosity.
Unfortunately, I had no idea of marketing or getting the word out in general but this was a good opportunity to learn how to do so.
Since I had no budget and would not earn anything anyway, I settled on posting in cycling-forums and in cycling / Komoot related Subreddits. The latter of which worked out quite nicely.

Bugs, Bugs, Criticism
Seeing my posts get upvotes and nice comments was exciting! I loved seeing that people seriously enjoyed something that I made. And since this was my first time ever publishing software, I was ever happier!
But not everything worked as planned. Some users were complaining that the app crashes / times out or straight up lags. This was very awkward. The problem was: I did not test the site with many tours. 20 or even 50 routes worked fine but when people have more than 200–300 routes, things start to get problematic. Although I managed to fix the major issues, it was still very stressful and even somewhat unpleasant. Especially when users write about how other sites are better or that this or that feature is missing, it is quite frustrating. But to be fair, this was only a rare occurrence.
Wrapping up
Ultimately, I can only say that this was a valuable experience to have and I very much enjoyed the process of making it and getting feedback from other people.
So what can you learn from this? To anyone who develops in secret just for themselves: Publish it! Get the word out! You never know if someone might find it useful too.
If you enjoyed the article and like the project, I would seriously appreciate a little donation to cover the server costs :) Thanks.

메타데이터
- post_id
- e0a64f6438eb
- slug
- komoot-heatmap-combining-cycling-and-programming-e0a64f6438eb
- url
- https://medium.com/@oskarkraemer/komoot-heatmap-combining-cycling-and-programming-e0a64f6438eb
- canonical_url
- https://medium.com/@oskarkraemer/komoot-heatmap-combining-cycling-and-programming-e0a64f6438eb
- author_url
- https://medium.com/@oskarkraemer
- status
- ok
- fetched_at
- 2026-07-25 07:36:07



