From Target to Molecular Series: Introducing the Target-Driven Bioactivity and Molecular Series…
Discover an open source KNIME workflow that retrieves ChEMBL bioactivity data and organise compounds into molecular series for SAR analysis
Knime I Drug Discovery I Chemical Biology
From Target to Molecular Series: Introducing the Target-Driven Bioactivity and Molecular Series Explorer
Discover an open source KNIME workflow that retrieves ChEMBL bioactivity data and organises compounds into molecular series for SAR analysis
Co-authors: Bill Tatsis, Nathan Brown

Image generated by Gemini
In a nutshell
- The *Target-Driven Bioactivity and Molecular Series Explorer* is an open source KNIME workflow that retrieves compounds and their biological activities for a given target from ChEMBL
- The workflow is particularly useful for users who want a reproducible starting point for target-centric SAR review, QSAR dataset preparation, or chemical series analysis from ChEMBL
- It supports a broad range of target types, from single proteins to protein complexes and cell lines
- It includes a series of data processing steps to maximise the quality and value of the retrieved data
- It allows compounds to be grouped into molecular series, enabling a structured exploration of structure-activity relationships
- It can be run as a DataApp on a KNIME Hub instance or locally via KNIME Analytics Platform
In this post
· Introduction · Workflow description ∘ Target and activity set definition ∘ Data processing ∘ Molecular series definition and analysis · How to run the workflow · Conclusions · Acknowledgements
Introduction
At a glance: This workflow helps users move from a target of interest to a curated, analysable set of compounds, activities and molecular series, using reproducible open-source KNIME components.
At the core of drug discovery and chemical biology lies a deceptively simple question: which compounds are active against a given biological target, and by how much? Answering this question is one of the most fundamental tasks in cheminformatics and the starting point for a remarkably wide range of scientific activities. These can be broadly grouped into three areas:
- Understanding structure-activity relationships: how changes in the chemical structure of a compound affect its biological activity. This encompasses techniques such as Structure-Activity Relationship (SAR) analysis, scaffold analysis, Matched Molecular Pair Analysis (MMPA) and activity cliffs analysis.
- Building predictive computational models: using known activity data to build models capable of predicting the behaviour of new compounds. Key approaches include Quantitative Structure-Activity Relationship (QSAR) modelling, pharmacophore modelling and the creation of benchmarking datasets for Virtual Screening (VS) methods.
- Supporting drug discovery decisions: applying activity data to guide both strategic and experimental choices, including target-focused chemical library design, target selectivity analysis, competitive intelligence, chemical probe identification and the validation of protocols for molecular modelling techniques such as molecular docking.
The activity of a compound against a target can be broadly classified into two main categories: binding affinity, which measures how well the compound physically associates with the target, and functional activity, which measures the biological consequence of that interaction (i.e., whether the compound activates or inhibits the protein’s function).
In this context, a biological target most commonly refers to a single protein. However, the concept can be extended to include multi-molecular targets such as protein complexes, and even non-molecular targets such as cell lines. Whenever such targets are relevant in a specific disease or biomedical context, it may be worthwhile to identify sets of compounds that elicit activity against them, along with the activity magnitude and direction (inhibition or activation), where available. This means that, beyond the most common case of single protein targets, the workflow can also be used to retrieve activities measured against cell lines, such as anti-proliferative activities and cell toxicity data, which are of great relevance in cancer research and drug safety assessment.
Whilst retrieving the active compounds for a given biological target is extremely useful, the ability to organise those compounds into molecular series is even more valuable. In medicinal chemistry, a molecular series is loosely defined as a group of structurally related compounds that share a common chemical framework and have been synthesised and tested against the same biological target to explore SAR. This enables the analysis of intra- and inter-series target activity, potentially highlighting important patterns of activity variation in relation to structural changes. Depending on the approach used to define them, molecular series may reflect a shared scaffold, a shared framework or a broader structural similarity cluster.
To address this need, at Healx we developed *Target-Driven Bioactivity and Molecular Series Explorer*, a KNIME workflow that allows users to select a biological target and, by leveraging ChEMBL data, retrieve the associated compounds and molecular series together with their activities. The workflow incorporates a series of data processing steps to maximise the value of the available data. In the following sections, we describe the workflow in detail, walking through each of its components and explaining the rationale behind the key design decisions.
Workflow description
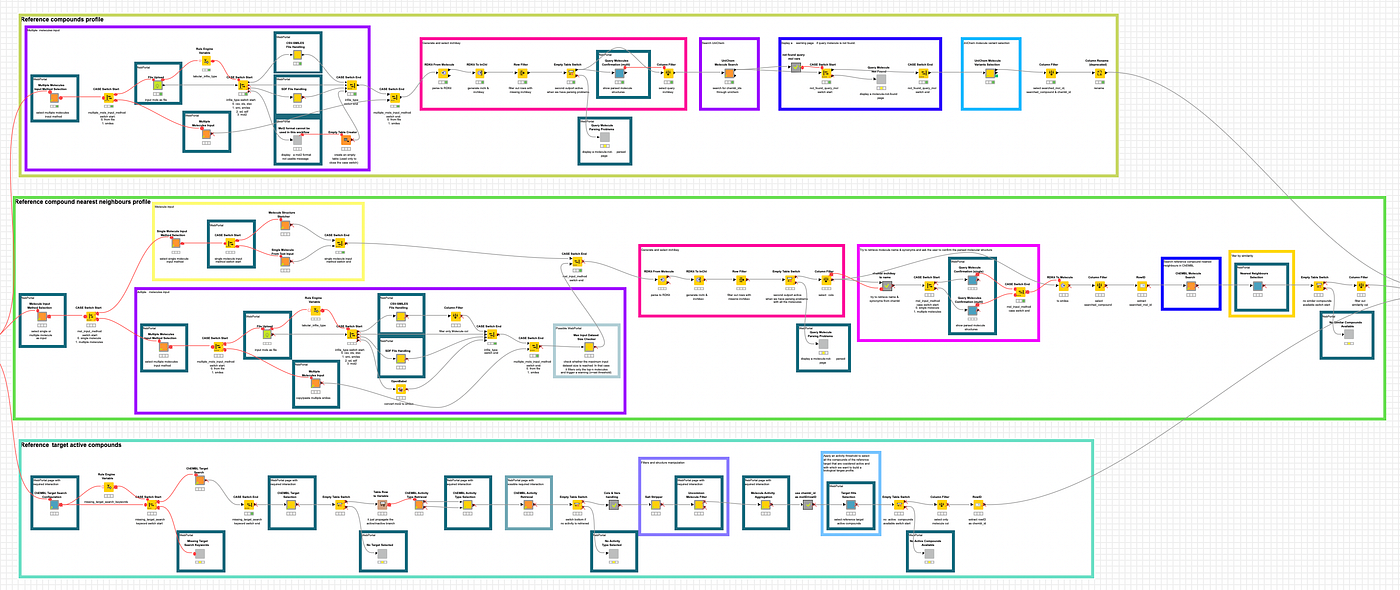
The *Target-Driven Bioactivity and Molecular Series Explorer* workflow is organised into three main parts:
In the following sections, each part is described in detail.
Throughout this post, the interactive components of the workflow are referred to as WebPortal pages. This is the form they take when the workflow is deployed as a DataApp (i.e. a web application) on a KNIME Hub instance. When running the workflow locally via KNIME Analytics Platform, the same components are accessed through their Interactive Views.
Target and activity set definition
The first step in the workflow is to define a target and an activity set, which together determine which compounds and biological activities are retrieved. The search and selection of a target is handled by three KNIME components: *ChEMBL Target Search Configuration, [ChEMBL Target Search](https://hub.knime.com/gcincilla/spaces/component_templates/ChEMBL%20Target%20Search~nZF_fGmRTDIlmOqE/most-recent) and [ChEMBL Target Selection](https://hub.knime.com/gcincilla/spaces/component_templates/ChEMBL%20Target%20Selection~efsa01u2J64Y_JKF/most-recent)*.

Figure 1: Portion of the workflow dealing with the target search and selection, including the three KNIME components involved.
In the Biological Target Search page provided by the *ChEMBL Target Search Configuration* component, the user can type the name, synonym or keyword of the target of interest. As the user types, the text field will suggest names of common targets, although users are free to enter names that differ from the suggested ones. Whilst users are most typically interested in single protein targets, the workflow adopts a broader target definition consistent with ChEMBL, supporting the following target types: single proteins, protein complexes, protein-protein interactions, protein families and cell lines.
The following page displays a list of targets related to the entered search term, each characterised by type, organism, name and, for single proteins, mutation status. For each target, the number of associated assays, compounds and activities is also reported. To further assist in the identification of protein targets, the UniProt Accession is provided as a hyperlink leading directly to the corresponding UniProt webpage.

Figure 2: Target selection as it appears in the WebPortal page.
One advantage of this workflow over the ChEMBL target webpage is that protein targets are distinguished by the presence of one or more mutations, allowing the user to select activity data specific to a particular protein variant. To reduce noise from non-wild-type proteins in cases where mutation information is not explicitly captured by ChEMBL, the workflow assigns an ‘UNDEFINED MUTATION’ label to data from any assay whose description contains words such as “mutation”, “mutated” or “variant”, following an approach similar to that of Landrum and co-workers.
Technical note: The mutation-aware target selection is achieved by leveraging data from the ChEMBL variant_sequences table, which from version 22 onwards systematically captures such information.

Figure 3: Portion of the workflow dealing with the activity set selection and retrieval, including the three KNIME components involved.
Using the *ChEMBL Activity Type Retrieval and [ChEMBL Activity Type Selection](https://hub.knime.com/s/gYTdaUusP4kVOyxx/most-recent)* components, the workflow retrieves and displays all the activity sets associated with the previously selected target (only sets related to 18 of the most common activity types are retrieved). Strictly speaking, an activity set can be considered homogeneous if it originates from a single assay, where the same technology, protocol and laboratory conditions have been used to determine compound activities. Whilst this level of homogeneity is achievable using ChEMBL, it results in a highly fragmented landscape, with many small activity sets linked to a given target, each containing a limited number of compounds. To maximise the number of compounds in each activity set whilst keeping the data sufficiently homogeneous, we opted to group activities from different assays that share the following features. Users should therefore treat each activity set as a pragmatic analysis set rather than a perfectly homogeneous assay dataset.
- assay type (e.g. binding, functional)
- assay format, based on Bioassay Ontology terms (e.g. cell-based, single protein, protein complex, cell-free)
- activity type (e.g. IC50, EC50, Ki, GI50, CC50)
- activity relation (e.g. “=”, “<”)
- activity units (e.g. nM, “%”)
- target confidence (a score indicating how accurately the assigned target represents the actual assay target)
It should be noted that the activity type, relation and units reported in this workflow always refer to the ChEMBL standard versions of these entities, even when they are not labelled as such in the original source.

Figure 4: Activity set data as reported in the WebPortal page.
Each activity set, characterised by the features listed above, is displayed together with the number of distinct compounds associated with it, allowing users to select the most appropriate set for their purposes. Once an activity set has been selected, the *ChEMBL Activity Retrieval* component retrieves all compounds whose activities, associated with the selected target, match the chosen activity set criteria. Additionally, the component converts the activity values to their negative base-10 logarithm (e.g. pIC50, pEC50), for those activity types for which this transformation is meaningful, namely: IC50, EC50, XC50, AC50, Ki, Kd, GI50, CC50, LC50, ED50 and MIC.
Beyond retrieving the activity data, the component checks for potential data validity issues through the data_validity_comment field of the ChEMBL activities table, and excludes flagged activities by default. Where one or more such activities are present in the selected activity set, they are listed in the WebPortal page of the component together with associated metadata, including source reference details (paper title, authors and DOI), so that the user can manually assess their validity by consulting the original source directly. The user may then optionally choose to re-include any of the flagged activities from the same WebPortal page. Please note that this WebPortal page will not appear if none of the activities in the selected set have an associated data validity comment. The most common data validity comments typically relate to activity values that fall outside the expected range for the selected activity type; for this reason, the typical activity range for the currently selected activity type is displayed at the bottom of the page.

Figure 5: Example of activities with non-null data validity comments.
Data processing
After the compound structures and valid activities connected to the selected target and activity set have been retrieved, the workflow proceeds with a series of data processing steps handled by three KNIME components: *Salt Stripper, [Uncommon Molecule Filter](https://hub.knime.com/gcincilla/spaces/component_templates/Uncommon%20Molecule%20Filter~QK2seGF34fuhrr6w/most-recent) and [Molecule Activity Aggregation](https://hub.knime.com/gcincilla/spaces/component_templates/Molecule%20Activity%20Aggregation~0s-Tn7rX_KM8MiWU/most-recent)*.

Figure 6: Portion of the workflow dealing with the data processing, including the three KNIME components involved.
The *Salt Stripper component is a simple wrapper of the [RDKit Salt Stripper](https://hub.knime.com/manuelschwarze/extensions/org.rdkit.knime.feature/latest/org.rdkit.knime.nodes.saltstripper.RDKitSaltStripperNodeFactory)* node. It is used to remove salts from each molecule (using the default salt definitions) and retain only the largest fragment after salt stripping, producing a dataset of single-component molecules. The rationale behind this step is that, for most small-molecule SAR applications, scientists are generally interested in the activity of the active component within a multi-component compound, rather than that of the salt counter-ion or any crystal-related items. If the workflow is intended for an application where multi-component molecules are relevant, the user can uncheck the option labelled “Keep only largest fragment after salts stripping” in the component configuration dialog. Alternatively, if the salt counter-ion should be retained entirely, the KNIME component can simply be removed from the workflow, as the input and output table columns are identical.
After salt stripping, the *Uncommon Molecule Filter* component performs an optional filter designed to remove molecules that would be considered uncommon for most of the applications mentioned in the introduction. Three filter criteria are applied:
- Compounds containing uncommon elements, defined as any element other than: H, C, N, O, P, S, F, Cl, Br and I
- Compounds containing macrocycles, defined as rings with eight or more heavy atoms
- Large molecules, defined as compounds with a molecular weight greater than 900 Da (this threshold is adjustable by the user from the WebPortal page)
By default, all compounds meeting one or more of these criteria are excluded from the dataset. However, the user can disable any of the three filters individually, thereby retaining the corresponding compounds.

Figure 7: Example of the WebPortal page for the optional drug-like molecular filter.
Having reduced the dataset to single-component molecules and removed uncommon compounds, the next step is to produce a final list of unique compounds, each associated with a single activity value for the selected target. This is handled by the *Molecule Activity Aggregation* component, which identifies molecules by computing their standard InChIKey and groups them by structural identity, aggregating multiple activity values into a single representative value. For each compound, a set of summary statistics is reported for the aggregated activities, including the mean, median, geometric mean, minimum, maximum, standard deviation, range, and 0.25 and 0.75 quantiles. String-formatted columns in the input table are also aggregated in a meaningful way: for example, the concatenation of unique molecule_id values can serve as the molecule identifier. The final output is a list of unique molecules, each associated with a single activity value, which in this workflow is the median of all available activities for that compound. The median provides a robust representative value, but users should be aware that aggregation can hide differences in assay context. We therefore encourage users to inspect the underlying individual activity records where outliers or assay-specific factors may affect the interpretation of the data.
Please note that the resulting molecule identifier is the ChEMBL ID for most molecules. However, for different ChEMBL entries that resolve to the same parent structure (i.e. the same single-component molecule after salt removal), the identifier will consist of the corresponding ChEMBL IDs joined by hyphens.
Molecular series definition and analysis
Having obtained a final list of unique compounds with their associated activities, the workflow offers two options for downstream analysis: the compounds can be analysed individually, or they can be grouped into molecular series, enabling a more structured exploration of the chemical space and associated activities.
For users interested in analysing the compounds individually, the workflow provides two WebPortal pages presenting activity data at progressively finer levels of detail.
The first page presents the activity data at the compound level. For each compound, the aggregated activity (median of all available activities for the selected target-compound pair) is reported together with the molecular structure, the number of activities contributing to the aggregation and the molecule identifier. A histogram of the activity distribution across all compounds is also shown. Two sliders allow the user to interactively filter the data by activity range and by the number of associated activities. The data can be exported in CSV format.

Figure 8: Example of the WebPortal page showing the compound-level activity data, including the activity distribution histogram, the compound table and the filtering sliders.
The second page provides a more detailed view at the individual activity level, where each activity entry is reported separately together with its source details: the reference, assay description and, in the case of scientific literature, the publication title, authors and DOI (provided as a direct hyperlink). As for the first page, the data can be exported in CSV format.

Figure 9: Example of the WebPortal page showing the individual activity records with their source details.
Alternatively, the workflow can proceed with the identification and analysis of molecular series through four KNIME components:
- *Molecular Series Configuration*
- *Molecular Series Identification*
- *Molecular Series Tuning*
- *Molecular Series Analysis & Selection*
It is worth noting that these four components are independent of the data source and can therefore be used in any workflow where molecular series identification is needed, regardless of whether the data originates from ChEMBL or any other source. In the workflow described here, the molecular series analysis is followed by a fifth component, *ChEMBL Molecular Series Details*, which leverages ChEMBL data to perform a more in-depth analysis at the molecular and individual activity level for the selected series.

Figure 10: Portion of the workflow dealing with the molecular series identification and analysis, including the five KNIME components involved.
The first component, Molecular Series Configuration, sets up the entire molecular series analysis. From its WebPortal page, the user can select the method to be used for molecular series identification. Four methods are currently available:
- Murcko’s scaffold: compounds sharing the same scaffold are grouped together
- Murcko’s framework: compounds sharing the same framework (a scaffold stripped of atom types and bond orders, retaining only topology) are grouped together
- Murcko’s scaffold cluster: compounds with similar Murcko’s scaffolds are grouped into clusters
- Molecular cluster: compounds with similar molecular structures are grouped into clusters
The first two methods are based on exact matching and are therefore deterministic and computationally inexpensive. The last two are based on hierarchical clustering and are therefore more flexible but also more computationally demanding, especially for large datasets. For this reason, these two options are disabled by default for large datasets; the threshold for what is considered a large dataset can be defined by the user in the component configuration dialog.

Figure 11: Example of the WebPortal page of the Molecular Series Configuration component.
Once the method has been selected, the *Molecular Series Identification* component groups the compounds into molecular series accordingly. When a clustering-based method is selected, hierarchical clustering is performed using the Cosine distance computed from Morgan count-based radius-2 1024-bit hashed molecular fingerprints, in combination with a Complete Linkage strategy. The optimal number of clusters is automatically determined using the Silhouette method and used as the default. The distance matrix and the resulting clustering model are provided as additional outputs for use by the next component.
The *Molecular Series Tuning component allows the user to review and optionally adjust the clustering solution produced by the Molecular Series Identification* component. It is only relevant when a clustering-based method has been selected; when a non-clustering method is used, the Interactive View of the component will be empty and the WebPortal page will not appear when the workflow is deployed as a DataApp. The evaluation of the clustering solution is facilitated by the display of three structural reference points for each cluster: the series representative (i.e. the cluster centroid) and the two furthest objects, namely the most distant and therefore least similar scaffolds or compounds within the cluster. Together, these provide an intuitive measure of both cluster identity and cohesion. If the user finds the default clustering solution satisfactory, no adjustment is needed and the workflow can proceed as is.

Figure 12: Example of the WebPortal page of the Molecular Series Tuning component.
The *Molecular Series Analysis & Selection* component provides a WebPortal page where the identified series can be reviewed, explored and selected for downstream analysis. Each series is displayed with its representative structure, series identifier, number of compounds, median activity value and a colour tag ranging from cool to warm tones representing the maximum activity reached in the series, with warmer colours indicating higher activity. A summary statistics table of the activity distribution is also reported for each series. The series can be interactively filtered using sliders for the number of compounds and the activity median, minimum and maximum. The position of each series representative in a 2D chemical space (i.e. Principal Components Analysis PCA of molecular fingerprints) is also shown, with selected series highlighted. The page also provides two downloadable files: series_overview.csv, containing a summary of each identified series, and compounds_by_series.csv, listing all compounds with their series assignment.

Figure 13: Example of the WebPortal page of the Molecular Series Analysis and Selection component.
Once one or more series have been selected, the *ChEMBL Molecular Series Details* component retrieves the full activity data from ChEMBL for the selected series and provides the Molecular Series Analysis WebPortal page for their in-depth exploration. The page is organised into three sections, presenting the activity data at progressively finer levels of detail:
- Activity by series: activity data and statistics aggregated at the series level
- Activity by molecule: activity data aggregated at the individual molecule level
- Individual activity records: individual activity entries with their source details
Each section provides a download area for exporting the data in CSV format. A 2D chemical space visualisation showing the distribution of molecules within the selected series, projected onto the first two principal components of a PCA computed from molecular fingerprints, is also provided.

Figure 14: Example of the WebPortal page of the ChEMBL Molecular Series Details component.
Having described all the sections of the workflow, we now provide practical guidance on how to set it up and run it.
How to run the workflow
The workflow is available here and is almost ready to use. The only step required before running it is to configure the *ChEMBL DB Connection* component and make sure it points to a running ChEMBL database. For detailed instructions on configuring this component, as well as guidance on setting up ChEMBL itself if needed, please refer to this blog post.
The workflow has been tested with ChEMBL version 37, the most recent at the time of writing. We aim to keep it up to date as new ChEMBL versions are released.
The workflow can be run on a KNIME Hub instance as a DataApp or locally via KNIME Analytics Platform. When deployed as a DataApp, the WebPortal pages are automatically presented to the user in sequence. When running locally, the user must interact with the components manually and sequentially, one at a time, by right-clicking on each component and selecting ‘Interactive View’. In our workflows, the components that provide user interaction are identifiable by a cyan workflow annotation tagged with ‘WebPortal’.

Figure 15: Example of a component with a cyan workflow annotation tagged with ‘WebPortal’, indicating that it always provides user interaction.
Some of these components are marked with a lighter cyan colour, indicating that their WebPortal page is only triggered conditionally, depending on the data available at runtime.

Figure 16: Example of a component with a lighter cyan workflow annotation, indicating that its WebPortal page may or may not appear depending on the data available at runtime.
Please note that the workflow can be run offline, as long as it can access a running instance of the ChEMBL database.
Conclusions
The *Target-Driven Bioactivity and Molecular Series Explorer* workflow provides an integrated and interactive solution for retrieving, processing and exploring bioactivity data from ChEMBL, from the selection of a biological target all the way to the identification and analysis of molecular series. Throughout its design, we faced a fundamental trade-off between data homogeneity and dataset size, and the current grouping criteria represent our best attempt at balancing these two competing needs. We are aware, however, that different use cases may call for different trade-offs.
Looking ahead, one of the main directions we are planning to explore is making this balance more flexible and user-controlled. For example, future versions of the workflow could allow users to restrict the activity set to assays run in a specific cell line or biological context, or even to assays performed under specific experimental conditions, as captured in the ChEMBL assay_parameters table. This would give users finer control over data homogeneity without sacrificing too much dataset size.
We hope the workflow will be useful to the cheminformatics and drug discovery community and we are curious to hear how you put it to use. If there are features you would like to see added or improved, we would love to hear your suggestions!
Acknowledgements
We would like to thank the open data and open source community for providing the data and tools that made this workflow possible. More specifically, we would like to thank the ChEMBL team, the RDKit developers and community, as well as the KNIME staff and community.
메타데이터
- post_id
- e147a4f57e89
- slug
- target-to-molecular-series-knime-workflow-e147a4f57e89
- url
- https://medium.com/low-code-for-advanced-data-science/target-to-molecular-series-knime-workflow-e147a4f57e89
- canonical_url
- https://medium.com/low-code-for-advanced-data-science/target-to-molecular-series-knime-workflow-e147a4f57e89
- author_url
- https://medium.com/@giovanni_72624
- status
- ok
- fetched_at
- 2026-07-09 10:10:35