C++ Memory: Fundamentals, Hierarchy, Pointers, Caches, and Debugging with GDB
Efficient and safe memory management is one of the most important skills in modern C++ development. Unlike higher-level languages, C++…
C++ Memory: Fundamentals, Hierarchy, Pointers, Caches, and Debugging with GDB
Efficient and safe memory management is one of the most important skills in modern C++ development. Unlike higher-level languages, C++ gives you direct control over how your program uses and manipulates memory. This power enables high-performance software — but it also means you must understand how memory is structured, how your CPU interacts with it, and how to debug issues when things go wrong.
This post walks through the essential components of memory management, from how memory is organized to how debuggers let you inspect low-level behavior. By the end, you’ll have an end-to-end picture of how a C++ program uses memory.
The Structure of Program Memory
Every running C++ program is given a virtual address space by the operating system. Instead of interacting with real physical memory directly, your program works with this virtual representation. This abstraction provides two major benefits:
- You can “use” more memory than physically available, thanks to disk-backed virtual memory
- Your program runs in isolation — other applications cannot overwrite your data.
Within the virtual address space, the program’s memory is divided into several key regions:
Stac Memory (created at program load)
- Text / Code Segment: The compiled machine instructions. Usually read-only.
- Initialized Data (.data): Global/static variables with explicit initial values.
- Uninitialized Data (.bss): Global/static variables initialized to zero or left uninitialized.
Stack (automatic storage)
- Stores function call frames
- Holds parameters, return addresses, local variables
- Allocated and freed automatically
- Extremely fast (LIFO pattern)
Heap (dynamic storage)
- Used for objects created with
new,malloc, or custom allocators - Flexible size and lifetime
- Requires manual deallocation
- Incorrect management -> memory leaks or dangling pointers
int main() {
   int a = 10;   // Stored on the stack
   int* p = new int(5);   // Allocated on the heap
   delete p;   // Must be freed manually
}
Why Memory Addresses Use Hexadecimal
Memory addresses are simply numbers that refer to byte locations. On a 64-bit machine, addresses are 64 bits long. Hexadecimal solves this problem. Each hex digit equals to 4 bits, so a 64-bit address only needs 16 hex digits. Converting between hex and binary is fast and exact.
0x7ffee4a3b8c0This clarity is crucial when inspecting memory using debuggers or diagnosing pointer bugs.
Pointers: The Bridge to Raw Memory
Pointers are variables that store memory addresses. Their type is essential because the type tells the compiler:
- How to interpret the data at that address
- How far to move during pointer arithmetic
int a = 42;
int* p = &a;

std::cout << p << std::endl;   // prints the address
std::cout << *p << std::endl;  // prints 42
Pointer arithmetic depends on type. For example, p + 1 moves by sizeof(int) bytes. This is why raw pointer manipulation can be powerful — but dangerous if misused.
The Memory Hierarchy: Why Caches Matter
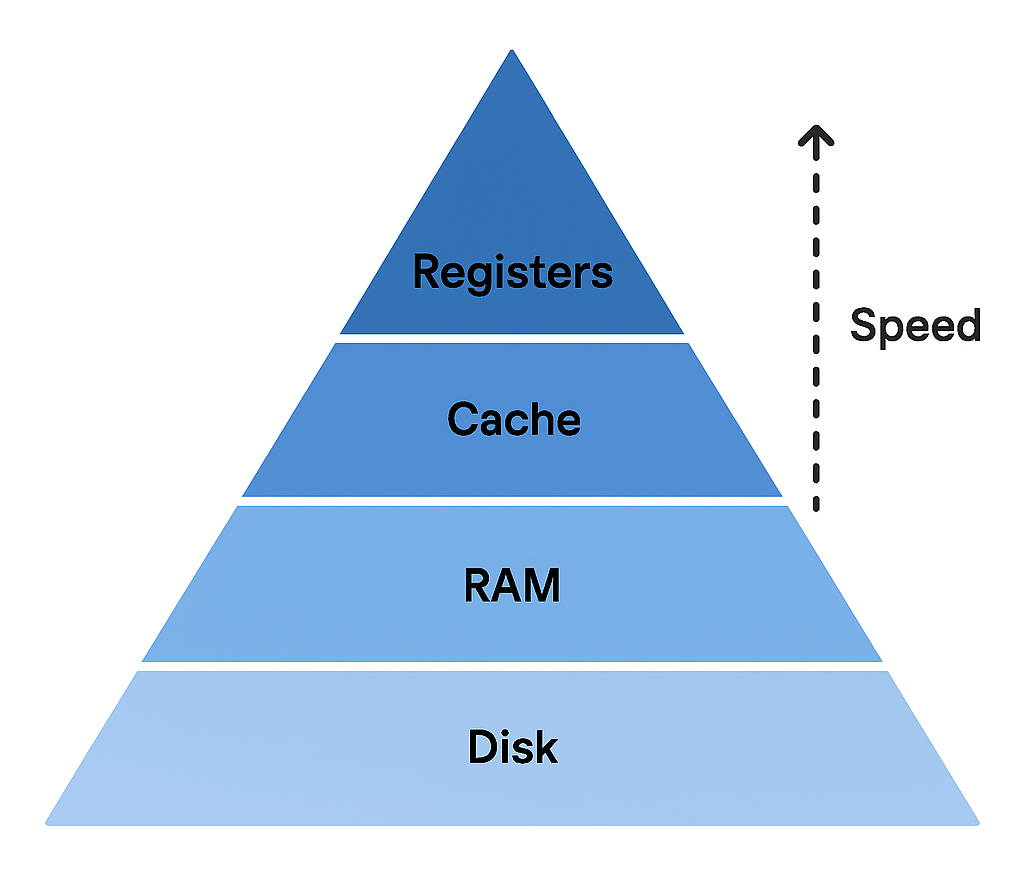
Your CPU is much faster than RAM. To bridge this gap, modern processors use a multi-level memory hierarchy:
- Registers — fastest, tiny
- L1 cache — extremely fast, per core (instructions & data)
- L2 cache — larger, slower
- L3 cache — large, shared across cores
- RAM — much slower
- Disk (SSD/HDD) — slowest, used for virtual memory
As you go down, speed decreases but capacity increases.
A cache hit means the data is already in a fast cache. A cache miss means the CPU must fetch from RAM — hundreds of cycles slower.
Locality of Reference
Caches work well because typical programs access data with locality:
- Temporal locality — recently used data will likely be used again
- Spatial locality — data close together in memory is often used sequentially
This is why arrays perform better than linked lists:
int arr[1000];
for (int i = 0; i < 1000; i++) // excellent spatial locality
   arr[i]++;
In contrast:
struct Node { int x; Node* next; };
// Linked list traversal -> poor locality
Debugging Memory with GDB
A debugger makes abstract memory concepts concrete by letting you step through execution, examine variables and addresses, inspect raw memory and view virtual memory mappings.
Compiling with Debug Symbols
g++ -g demo.cpp -o demo
gdb ./demo
Useful GDB Commands
break <function>      // set breakpoint
run                   // start execution
next                  // step over
step                  // step into
p variable            // print variable value
p &variable           // print address
info locals           // all local variables in scope
x/4xb <address>       // examine 4 bytes in hex
info files sections   // view code/data/bss sections
info proc mappings    // view virtual memory layout
For example, int sum = 10 is in GDB:
(gdb) p &sum
0x7fffffffde3c

(gdb) x/w 0x7fffffffde3c
0x7fffffffde3c: 10
You are literally inspecting the bytes inside the program’s memory. Consider the code below:
int calculate_sum(int n) {
    int sum = 0;
    for (int i = 0; i <= n; ++i) {
        sum += i;
    }
    return sum;
}
Using GDB to step through the loop lets you inspect values of i and sum, helping you diagnose off-by-one errors or logic issues. Setting a breakpoint:
(gdb) break calculate_sum
(gdb) run
(gdb) next
Conclusion
Memory management in C++ is not just about avoiding leaks — it’s about understanding the full lifecycle of data, how it moves through the machine, and how your code interacts with the CPU. By learning:
- how memory is structured
- why pointers behave the way they do
- how caches dramatically affect performance
- how debuggers reveal the truth of program execution
…you gain the ability to write fast, robust, and deeply efficient systems software.
If you’re learning C++, mastering these concepts will give you the tools to debug even the hardest memory issues with confidence.
메타데이터
- post_id
- e1667d3c60db
- slug
- c-memory-fundamentals-hierarchy-pointers-caches-and-debugging-with-gdb-e1667d3c60db
- url
- https://medium.com/@su-paris/c-memory-fundamentals-hierarchy-pointers-caches-and-debugging-with-gdb-e1667d3c60db
- canonical_url
- https://medium.com/@su-paris/c-memory-fundamentals-hierarchy-pointers-caches-and-debugging-with-gdb-e1667d3c60db
- author_url
- https://medium.com/@su-paris
- status
- ok
- fetched_at
- 2026-06-13 07:35:29



