Can Java Microservices Be As Fast As Go? A 2026 Benchmark Update
Can Java Microservices Be As Fast As Go? A 2026 Benchmark Update
Can Java Microservices Be As Fast As Go? A 2026 Benchmark Update
Six years ago, Peter Nagy and I asked a question that was simple enough to be fun and annoying enough to be useful: can Java microservices be as fast as Go microservices? It was not meant to be a language war, because those are usually subjective anyway, and worse, they tend to make people less curious. The practical question was smaller: if you take a small HTTP service, implement it carefully in Go and Java, and run it on the same hardware, do the results land in the same performance neighborhood?
In 2020, the answer was yes for the small case. The shape I remembered, and wanted to test again, was that Java became more interesting as the workload and the machine got larger. So the 2026 question is not “did Go lose?” or “did Java solve all computer problems and also fold the laundry?” It is this: for this service, on this machine, with current runtimes, what happens as payload size and concurrency go up?
The companion repository for this article is markxnelson/go-java-go-2026. It includes the service code, benchmark scripts, raw results, summary tables, and chart-generation script.
The Baseline
For this run I used:
- Go 1.26.3
- Oracle JDK 26.0.1
- Helidon SE 4.4.1
- Linux on x86_64
- Intel Xeon W-11855M, 6 cores / 12 threads
- 128 GiB RAM
The Go service uses the standard library net/http server. No framework. No middleware stack.
The Java service uses Helidon SE WebServer. Helidon 4 uses virtual threads for request handling, and the service health endpoint confirmed that request work was running on virtual threads.
For the Java side I measured two runtime shapes:
- Oracle JDK JVM
- Oracle JDK with a Leyden AOT cache
That is enough for this pass. It keeps the article focused on the question I actually measured: a compact Go service against a compact Java service, both running sequentially on the same local machine.
The Service
Both services expose the same endpoints:
GET /health
GET /ready
GET /api/strings/{value}
GET /api/generated/{size}
The strings endpoint is useful for simple functional checks. The generated endpoint is the one I used for the benchmark matrix.
That distinction matters.
In an early run I tested a 2 KB input by putting a 2 KB string directly in the URL path. That mostly told me how each router handled a silly path parameter. Interesting, maybe, but not the thing I wanted to measure. The final full run uses /api/generated/{size} so the URL stays small and the application generates the requested input size inside the handler.
Each request does the same small unit of work:
- uppercase the input
- lowercase the input
- reverse the input
- compute a CRC32 hash
- repeat extra CRC work according to
WORK_FACTOR - return JSON with the result and runtime metadata
For the benchmark run, WORK_FACTOR=10. Request logging was off.
This is still a small synthetic service. It is not a shopping cart, a fraud system, or a payments API. It has no database, no TLS, no queue, no JSON parser on the inbound side, and no remote dependency. That is intentional. The point is to make the hot path small enough that runtime and server behavior are visible.
The Benchmark Shape
Please allow me to use the term “benchmark” a little loosely in this article.
The benchmark runner starts one service, runs the full matrix, stops it, and then starts the next service. Go and Java do not run at the same time, so they are not competing with each other for CPU or memory.
The benchmark run used:
payload sizes:      7, 128, 2048, 8192 bytes
concurrency levels: 1, 6, 12, 24, 48, 96, 192
repeats per cell:   2
warmup per cell:    2 seconds
measurement window: 5 seconds
work factor:        10
The runtime settings were explicit:
Go:
  GOMAXPROCS=12
  GOMEMLIMIT=off

Java JVM variants:
  -XX:ActiveProcessorCount=12
  -XX:MaxRAMPercentage=75

With Leyden:
  -XX:+UnlockDiagnosticVMOptions
  -XX:-AOTRecordTraining
  -XX:-AOTReplayTraining
The combined result set used for the article lives under:
results/sequential_generated_leyden_feedback_full_20260608_0700432/It includes the raw per-cell summary table, the peak-throughput table, the pivot table used for the charts, and the runtime configuration table.
The Small Tuning Detail That Changed The Java Result
Before the benchmark run, I hit a strange result.
The Helidon service looked fine for tiny responses, but larger generated responses had a suspicious latency floor around 44–48 ms when the Go load driver reused persistent HTTP/1.1 connections. A fresh curl request did not show the same behavior after warmup. That smelled less like application code and more like packet behavior.
The fix was:
WebServer server = WebServer.builder()
        .port(port)
        .connectionOptions(socket -> socket.tcpNoDelay(true))
        .routing(routing -> routing
                .get("/health", (req, res) -> health(res))
                .get("/ready", (req, res) -> ready(res))
                .get("/api/strings/{value}", (req, res) -> strings(req, res, logRequests, workFactor))
                .get("/api/generated/{size}", (req, res) -> generated(req, res, logRequests, workFactor)))
        .build()
        .start();
After setting tcpNoDelay(true), the 2 KB persistent-connection case moved from “obviously broken benchmark” to “serious server.” That is exactly why these tests are worth running before writing the article. A single missed production setting can turn into a confident but wrong conclusion.
Both services also set Content-Length explicitly for known-size JSON responses.
What Happened
Here is the short version: for this service, on this machine, Java was not merely “as fast as Go.” Once the test moved beyond the smallest case, the Java implementation often scaled better.
In the benchmark run, the runner used a 10-second service warmup after each service started, plus a 10-second warmup before every measured cell. It also ran the Leyden replay with diagnostic options that disable record and replay training during measurement (see above).
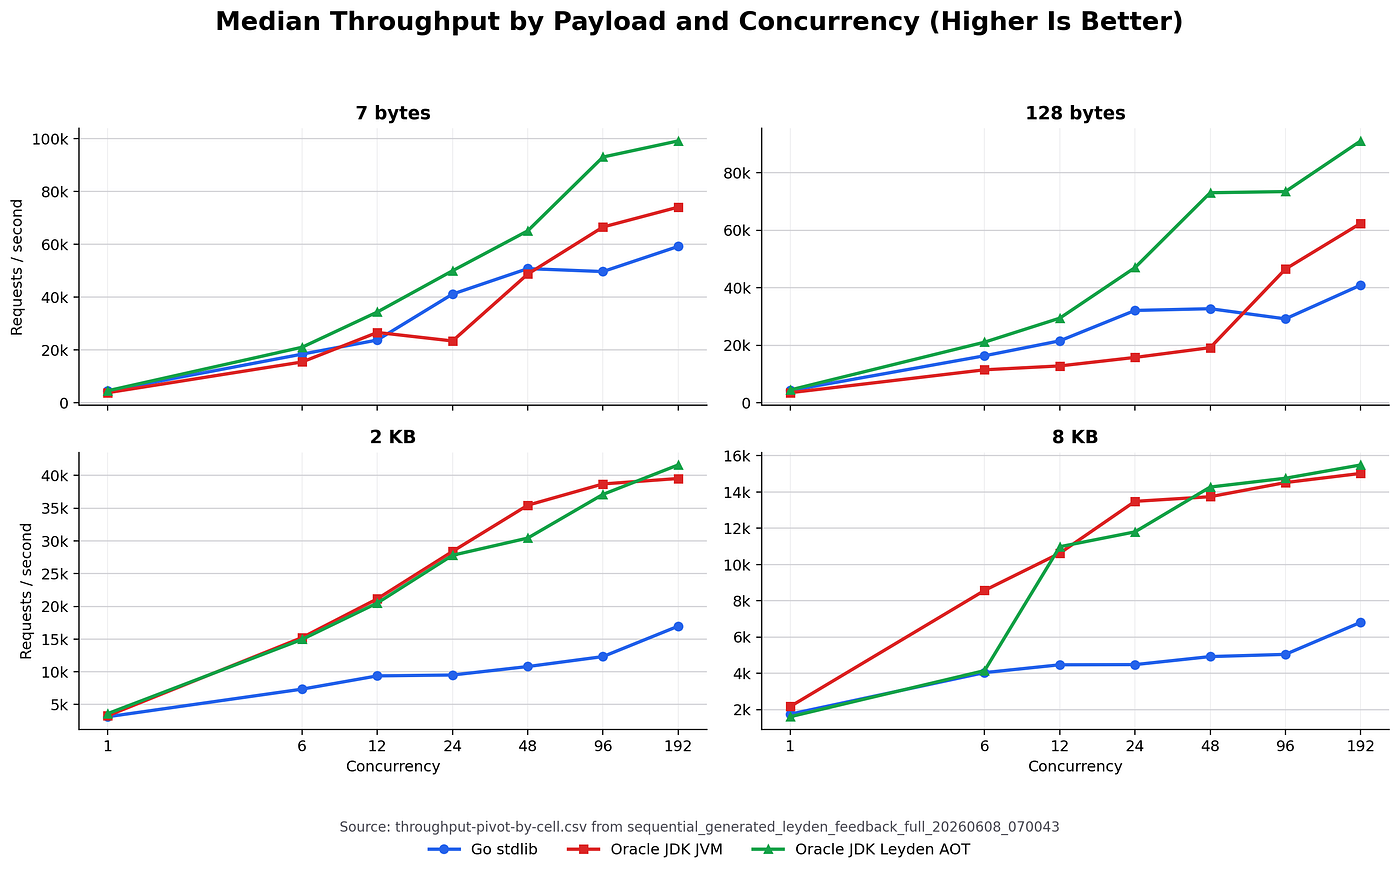
At the smallest generated payload, all three runs were in the same neighborhood at low concurrency. With one worker and a 7-byte payload, Go reached about 3,200 requests per second. The regular Oracle JDK run reached about 2,722 requests per second, and the Leyden AOT run reached about 3,561.
That is a close small-service result. It is also the sort of result people tend to remember from older Java versus Go conversations: Go starts fast, the code is compact, and the low-concurrency case looks good.
But the shape changed as concurrency rose.
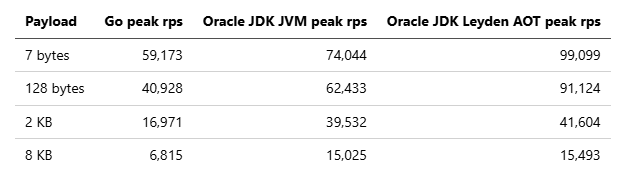
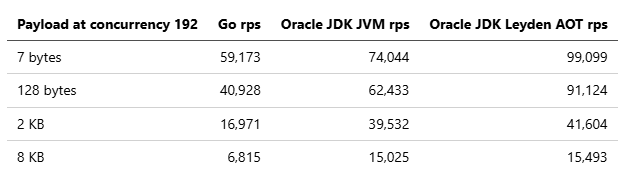
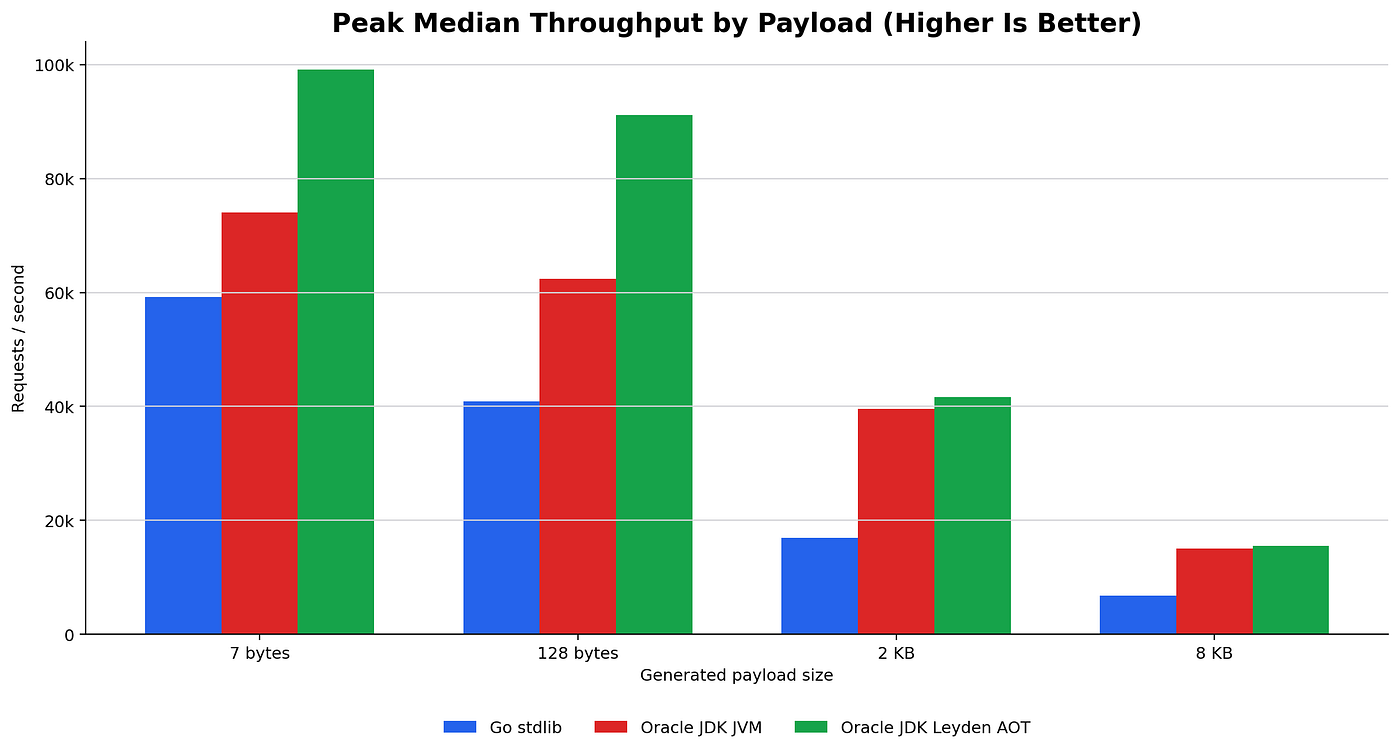
At 192 concurrent workers and the same 7-byte generated payload, Go reached about 59,173 requests per second. The regular Oracle JDK run reached about 74,044 requests per second. The Leyden AOT run reached about 99,099 requests per second.
At 128 bytes, the Java variants pulled ahead at higher concurrency. At 192 concurrent workers, Go reached about 40,928 requests per second. The regular Oracle JDK run reached about 62,433. The Leyden AOT run reached about 91,124.
At 2 KB, the gap was larger. Go peaked at about 16,971 requests per second. The regular Oracle JDK run peaked at about 39,532 requests per second, and the Leyden AOT run peaked at about 41,604.
At 8 KB, both Java shapes were well ahead of Go in this local run. Go peaked at about 6,815 requests per second. The regular Oracle JDK run peaked at about 15,025, and the Leyden AOT run peaked at about 15,493.
The peak-throughput table from this run looks like this:
And the high-concurrency cells that anchor the narrative are:
No measured row in the benchmark run had request failures.
That is the interesting version of the story. Not a slogan, but a curve.
For the smallest case, the services are in the same range at low concurrency, but Leyden AOT pulls away at the high-concurrency end. As the generated payload grows, Java’s advantage shows up earlier and more strongly.
That does not mean “Java is faster than Go.” It means this Java implementation, on this JDK, with Helidon virtual-thread request handling and the right socket setting, scaled better than this Go implementation in this local matrix.
That sentence has a lot of nouns in it. It needs all of them.
What Leyden AOT Did
Leyden AOT did not simply make every individual cell faster, but with the replay training options disabled during measurement it changed the headline result substantially.
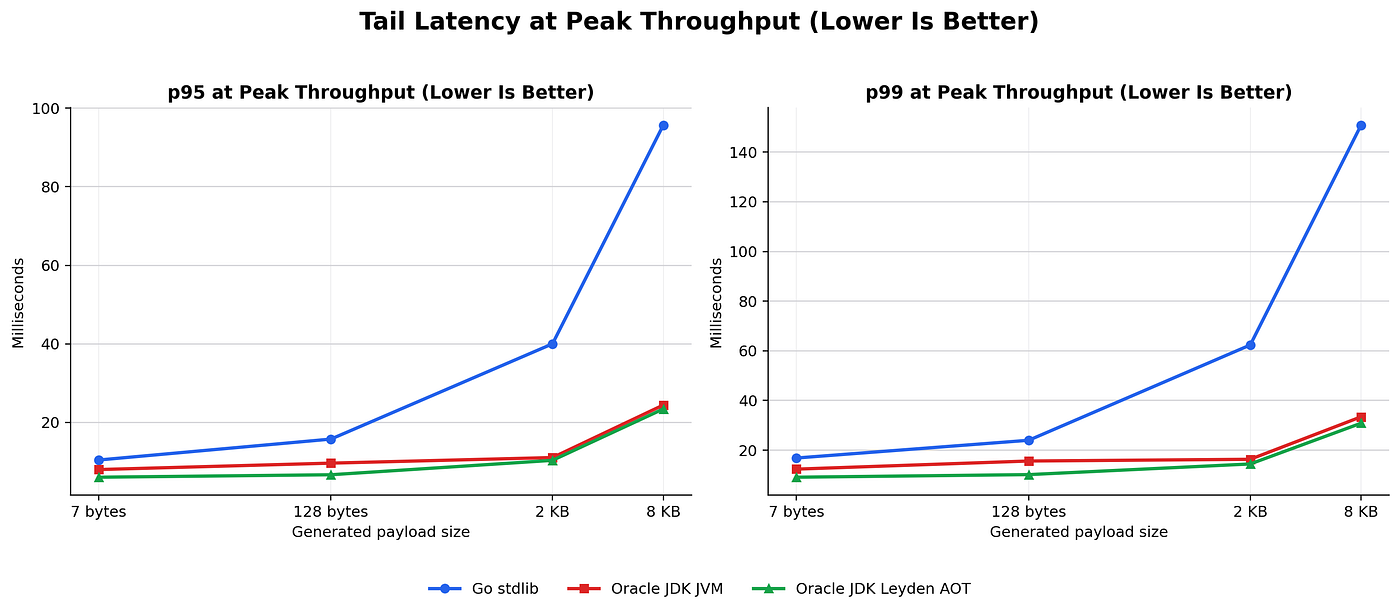
It had the best peak throughput for every payload in this run. At 7 bytes, the Leyden peak was about 99,099 requests per second at concurrency 192, with p95 around 6.0 ms and p99 around 9.1 ms. At 128 bytes it peaked around 91,124 requests per second. At 2 KB it peaked around 41,604. At 8 KB it peaked around 15,493.
That does not mean Leyden won every row. Leyden AOT had the highest throughput in 20 of the 28 payload/concurrency cells, while the regular Oracle JDK JVM run won the other 8. Go did not win an individual cell in this final matrix, though it stayed close at the smallest low-concurrency cases. The overall peak-throughput story shifted: Leyden AOT was the highest peak runtime shape for each payload in this matrix.
That is not disappointing. It is useful. Leyden AOT is not a magic “make benchmark bigger” switch. It changes startup, warmup, and runtime behavior in ways that need to be measured against the workload you actually care about.
For this article, the honest summary is:
Leyden AOT was strongest in the peak-throughput view after the measurement run separated warmup more carefully and disabled Leyden record/replay training during replay. Startup and footprint still deserve their own pass.
What The Results Mean
The old easy argument was that Go is the obvious choice for small network services because Java is too heavy.
That argument does not survive this run.
Go remains excellent for small services. The implementation is compact. The toolchain is simple. The standard HTTP server is capable. The single-binary deployment story is still very attractive.
Modern Java is also excellent for small services, and it has a very different set of strengths. The JVM has a mature optimizer, rich observability tools, excellent GC engineering, and now a mainstream virtual-thread model that makes blocking server code feel much less expensive than it used to.
Helidon SE keeps the Java side small enough that this comparison is not “minimal Go versus enormous Java framework.” It is a compact Java service using a compact Java server.
This does not mean I would take these numbers and make a company-wide language policy. Please do not do that. That is how benchmark articles become office folklore, and office folklore is where nuance goes to quietly retire.
What I would take from this run is more practical:
Language matters, but runtime, framework, hardware shape, warmup, logging, socket options, packaging, and measurement design often matter more than our slogans.
What I Would Measure Next
Throughput is only one part of the story.
The next pass should add:
- startup time
- RSS and heap usage
- CPU utilization
- GC logs
- Java Flight Recorder
- async-profiler
- longer runs
- more repeats per cell
- isolated load generator host
- container limits
- TLS
- request logging on and off
- Spring Boot
- at least one real dependency, such as a database call
I would also keep the tcpNoDelay lesson in the benchmark checklist. It is not glamorous, but neither is being wrong by 40 milliseconds.
How To Reproduce This Run
Build the Java service:
cd helidon-service
JAVA_HOME=/home/mark/jdk-26.0.1 \
PATH=/home/mark/jdk-26.0.1/bin:/home/mark/apache-maven-3.9.12/bin:$PATH \
mvn -B -DskipTests package
Run the sequential matrix:
RESULTS_DIR=/home/mark/redstack/go-java-go-2026/results/sequential_generated_$(date +%Y%m%d_%H%M%S) \
GO_PORT=25081 \
JAVA_PORT=25082 \
CONCURRENCY_LEVELS="1 6 12 24 48 96 192" \
PAYLOAD_SIZES="7 128 2048 8192" \
REPEATS=2 \
DURATION=5s \
WARMUP_DURATION=2s \
JAVA_VARIANTS="oracle-jdk-jvm oracle-jdk-leyden-aot" \
WORK_FACTOR=10 \
ENDPOINT_MODE=generated \
scripts/run-sequential-matrix.sh
The runner writes the raw and summarized tables automatically.
The Bit I Still Believe
The original article did not settle the question forever. It was never going to.
Performance is not just a property of a language.
It is also a property of:
- hardware shape
- runtime version
- framework choices
- warmup
- logging
- serialization
- socket options
- container limits
- GC behavior
- load-driver design
- measurement duration
- noisy neighbors
- the parts of the service that are not in your benchmark
That was true in 2020, and it is still true in 2026.
So, can Java microservices be as fast as Go?
For this service, on this machine, with these versions, yes. And as the payload and concurrency grew, the Java implementation was often faster.
That is not a trophy. It is a measurement.
The useful next question is not “which language won?”
It is “which runtime shape do you want to operate, observe, tune, deploy, and live with in production?”
That is a better question. It gives you something to measure, something to improve, and, on a good day, something worth changing your mind about.
메타데이터
- post_id
- e16a2e262fc4
- slug
- can-java-microservices-be-as-fast-as-go-a-2026-benchmark-update-e16a2e262fc4
- url
- https://medium.com/helidon/can-java-microservices-be-as-fast-as-go-a-2026-benchmark-update-e16a2e262fc4
- canonical_url
- https://medium.com/helidon/can-java-microservices-be-as-fast-as-go-a-2026-benchmark-update-e16a2e262fc4
- author_url
- https://medium.com/@mark.x.nelson
- status
- ok
- fetched_at
- 2026-06-10 18:44:10