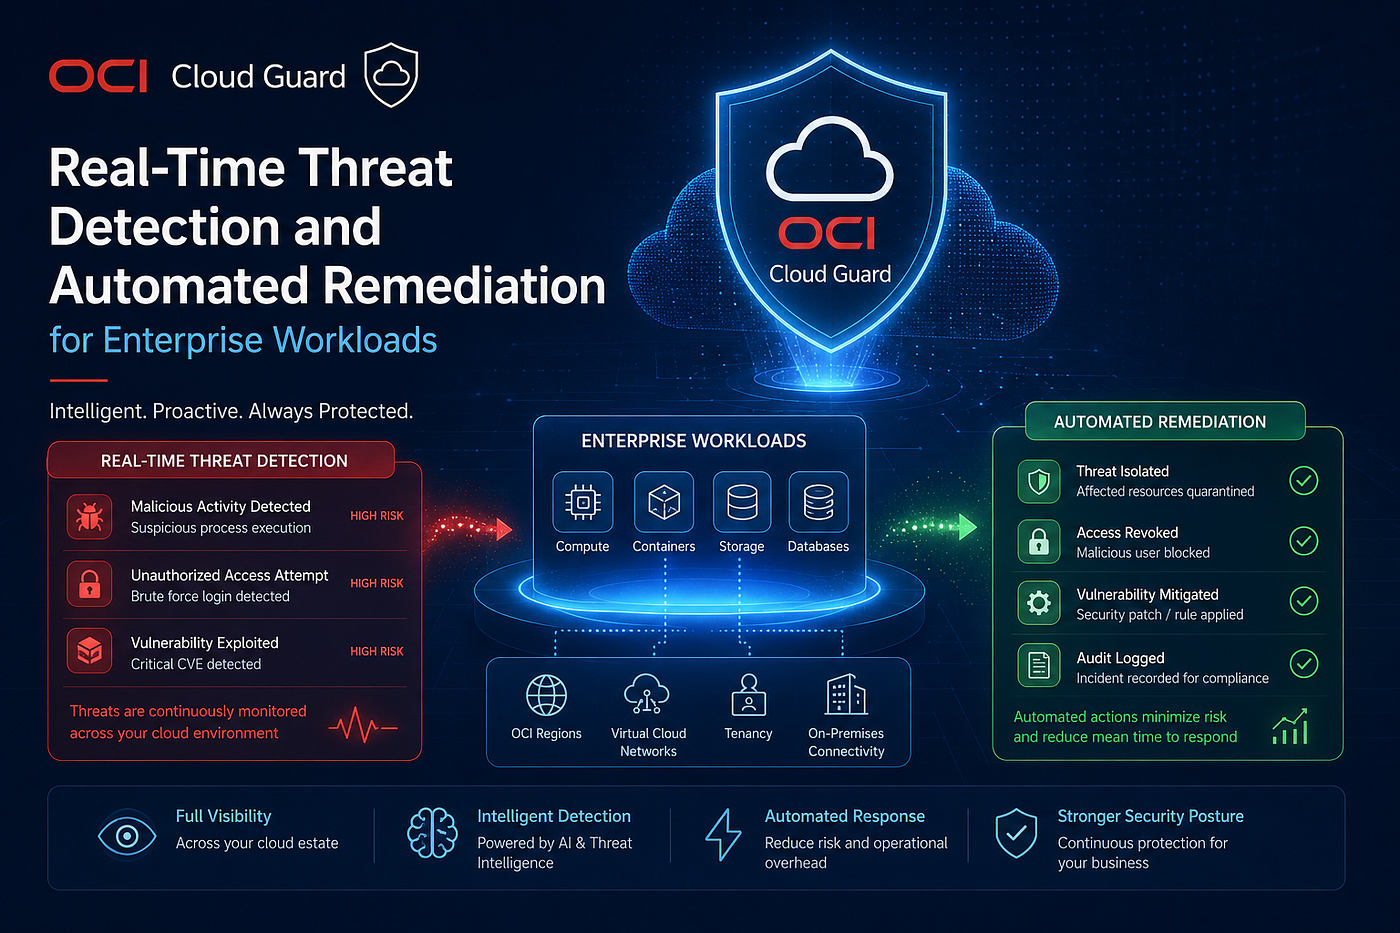
Exporting OCI Cloud Guard Findings to Excel for Compliance Reporting Using Python SDK
Stop manually screenshotting the console. Here’s how to build a Python tool that pulls every Cloud Guard security finding from your OCI…
Exporting OCI Cloud Guard Findings to Excel for Compliance Reporting Using Python SDK
Stop manually screenshotting the console. Here’s how to build a Python tool that pulls every Cloud Guard security finding from your OCI tenancy and exports it into a formatted, audit-ready Excel workbook — automatically.

What We Are Building
If you have worked with OCI, you know Cloud Guard is a powerful security posture management service. It scans your tenancy continuously and flags misconfigurations, suspicious activity, and policy violations as Problems.
But here is the gap that frustrates every cloud security engineer: Cloud Guard shows findings inside the console. Your compliance team, your auditors, and your manager want an Excel file they can sort, filter, annotate, and email. Not a browser tab.
This project closes that gap. By the end of this blog, you will have a working Python tool that:
- Fetches all Cloud Guard problems across your tenancy using pagination
- Pulls all detector recipe rules and their enabled/disabled status
- Captures the responder activity audit trail (who fixed what, and when)
- Exports everything into a 6-sheet, color-coded Excel workbook
- Includes a mock data generator so you can test it without any OCI credentials
Project Structure
Before writing a single line of code, here is how the project is organized:
cloudguard-exporter/
├── cloudguard_exporter.py    # Main script — OCI API + Excel builder
├── generate_mock_report.py   # Demo mode — no OCI credentials needed
├── requirements.txt
├── output/                   # Reports saved here
└── utils/
    ├── helpers.py            # Date formatting, risk labels, truncation
    └── logger.py             # Structured console logger
Each file has a single responsibility. The main script handles only OCI API calls and workbook assembly. All formatting utilities live in helpers.py. This separation makes the helpers independently testable and makes the OCI layer easy to swap out or mock.
Prerequisites
Install the two dependencies:
pip install oci openpyxlOCI config — you need a valid ~/.oci/config. If you have already used the OCI CLI, this is done. If not:
bash
oci setup configIAM policy — add these statements at the tenancy level so your user can read Cloud Guard data:
Allow group SecurityAuditors to inspect cloud-guard-problems in tenancy
Allow group SecurityAuditors to read cloud-guard-detector-recipes in tenancy
Allow group SecurityAuditors to inspect cloud-guard-responder-activities in tenancy
Allow group SecurityAuditors to inspect compartments in tenancy
No OCI access yet? Run
python generate_mock_report.py— it builds a fully realistic report with 45 sample findings using zero OCI credentials. Great for testing and for sharing screenshots in your blog.
Step-by-Step Code Walkthrough
Step 1 — Setting up OCI clients
The script creates two SDK clients: one for Cloud Guard and one for Identity (to resolve compartment names).
def build_clients(profile: str, region: str | None):
    config = oci.config.from_file(profile_name=profile)
    if region:
        config["region"] = region
# Always validate before making any API calls
oci.config.validate_config(config) cg_client = oci.cloud_guard.CloudGuardClient(config)
id_client = oci.identity.IdentityClient(config)
return config, cg_client, id_clientNotice we call oci.config.validate_config() before touching any API. This catches missing fields, wrong key file paths, or invalid regions early — before you waste time on a broken API call.
Step 2 — Fetching problems with pagination
Cloud Guard can return hundreds of problems. The OCI API paginates results in pages of up to 100. Instead of manually looping with next_page tokens, we use the SDK's built-in pagination helper:
def fetch_problems(cg_client, compartment_id: str, status_filter: str | None) -> list[dict]:
    kwargs = {
        "compartment_id": compartment_id,
        "compartment_id_in_subtree": True,   # scan all child compartments
        "limit": 100,
    }
    if status_filter:
        kwargs["lifecycle_state"] = status_filter
response = oci.pagination.list_call_get_all_results(
cg_client.list_problems,
**kwargs
) problems = []
for p in response.data:
problems.append({
"risk_level": safe_str(p.risk_level),
"resource_name": safe_str(p.resource_name),
"resource_type": safe_str(p.resource_type),
"status": safe_str(p.lifecycle_state),
"detected_at": format_datetime(p.time_first_detected),
"last_detected_at": format_datetime(p.time_last_detected),
"recommendation": safe_str(getattr(p, "recommendation", "")),
})
return problemsKey insight: Setting compartment_id_in_subtree=True means one call scans your root compartment and all child compartments recursively. Without this flag, you see only the top-level compartment.
Step 3 — The safe_str pattern (the most important habit)
OCI API responses return None for optional fields. Writing p.resource_name directly crashes with a TypeError the moment any field is missing. The safe_str helper protects every single field access:
# utils/helpers.pydef safe_str(val) -> str:
if val is None:
return ""
return str(val)def format_datetime(dt) -> str:
if dt is None:
return "N/A"
try:
return dt.strftime("%Y-%m-%d %H:%M UTC")
except Exception:
return str(dt)def truncate(text: str, max_len: int) -> str:
if not text:
return ""
text = str(text).strip()
if len(text) <= max_len:
return text
return text[:max_len - 3] + "..."This is the most important defensive habit when working with the OCI Python SDK. A single unguarded .attribute access on a None response can crash the entire script mid-run.
Step 4 — Fetching detector rules (two-level pagination)
Detector rules live inside recipes. You need to fetch all recipes first, then loop through each recipe to get its rules — two levels of pagination:
def fetch_detector_rules(cg_client, compartment_id: str) -> list[dict]:
    recipes = oci.pagination.list_call_get_all_results(
        cg_client.list_detector_recipes,
        compartment_id=compartment_id
    ).data
rules = []
for recipe in recipes:
recipe_rules = oci.pagination.list_call_get_all_results(
cg_client.list_detector_recipe_detector_rules,
detector_recipe_id=recipe.id
).data for r in recipe_rules:
rules.append({
"recipe_name": safe_str(recipe.display_name),
"rule_id": safe_str(r.detector_rule_id),
"display_name": safe_str(r.display_name),
"risk_level": safe_str(r.risk_level),
"lifecycle_state": safe_str(r.lifecycle_state),
"detector": safe_str(r.detector),
"recommendation": safe_str(getattr(r, "recommendation", "")),
})
return rulesStep 5 — Building the Excel workbook
The workbook is assembled using openpyxl. The most reusable pattern in the whole project is apply_data_cell — a single function that handles alternating row colors and automatic risk-level color coding:
python
RISK_COLOR_MAP = {
    "CRITICAL": ("E74C3C", "FFFFFF"),   # red background, white text
    "HIGH":     ("E67E22", "FFFFFF"),   # orange
    "MEDIUM":   ("F1C40F", "1A1A1A"),   # yellow, dark text
    "LOW":      ("2ECC71", "FFFFFF"),   # green
}
def apply_data_cell(ws, row, col, value, alt_row=False,
risk=None, bold=False, center=False):
cell = ws.cell(row=row, column=col, value=value)
cell.border = THIN_BORDER
cell.font = Font(size=9, bold=bold)
cell.alignment = Alignment(
vertical="center",
wrap_text=True,
horizontal="center" if center else "left"
) if risk and risk.upper() in RISK_COLOR_MAP:
bg, fg = RISK_COLOR_MAP[risk.upper()]
cell.fill = PatternFill("solid", fgColor=bg)
cell.font = Font(color=fg, size=9, bold=True)
elif alt_row:
cell.fill = PatternFill("solid", fgColor="EAF2FF") return cellThe problems sheet uses this on every row:
for row_idx, p in enumerate(data, start=2):
    alt  = row_idx % 2 == 0
    risk = p["risk_level"].upper()
# Risk column — automatically colored red/orange/yellow/green
apply_data_cell(ws, row_idx, 1, risk, risk=risk, bold=True, center=True) # All other columns — alternating light blue rows
apply_data_cell(ws, row_idx, 2, p["resource_name"], alt_row=alt)
apply_data_cell(ws, row_idx, 3, p["resource_type"], alt_row=alt)
apply_data_cell(ws, row_idx, 4, p["status"], alt_row=alt, center=True)
apply_data_cell(ws, row_idx, 5, p["detected_at"], alt_row=alt, center=True)
apply_data_cell(ws, row_idx, 6, p["recommendation"], alt_row=alt)# Enable auto-filter so the reader can sort and filter in Excel
ws.auto_filter.ref = f"A1:{get_column_letter(len(headers))}1"Step 6 — The “Critical & High” filtered sheet (zero duplicated code)
The Critical & High sheet is just the All Problems sheet with a filter applied. We pass a filter_fn argument — no need to duplicate anything:
# In main():
build_problems_sheet(wb, problems, "All Problems")
build_problems_sheet(
wb, problems, "Critical & High",
filter_fn=lambda p: p["risk_level"].upper() in ("CRITICAL", "HIGH")
)# The function signature:
def build_problems_sheet(wb, problems, sheet_name, filter_fn=None):
data = [p for p in problems if (filter_fn is None or filter_fn(p))]
# ... rest of the sheet builderThis is a clean pattern for any report that needs multiple filtered views of the same data.
Step 7 — Charts on the summary sheet
The summary dashboard gets a bar chart (risk breakdown) and a pie chart (status breakdown) using openpyxl’s built-in chart support:
python
from openpyxl.chart import BarChart, Reference, PieChart# Bar chart — problems by risk level
bar = BarChart()
bar.type = "col"
bar.title = "Problems by risk level"
bar.style = 10
bar.width = 18
bar.height = 12data = Reference(ws, min_col=2, min_row=1, max_row=6)
cats = Reference(ws, min_col=1, min_row=2, max_row=6)
bar.add_data(data, titles_from_data=True)
bar.set_categories(cats)
ws.add_chart(bar, "A10") # Anchor the chart at cell A10The Reference rows point to the risk count table you wrote just above the chart — the chart reads its own data from the sheet, which keeps everything in sync automatically.
Running the Tool
Demo mode — no OCI credentials needed:
python generate_mock_report.pyOutput:
[2026-03-25 10:15:42] INFO  Generating mock Cloud Guard data...
[2026-03-25 10:15:42] INFO  Building Excel workbook...
[2026-03-25 10:15:42] INFO  Sheet 'All Problems' written with 45 rows.
[2026-03-25 10:15:42] INFO  Sheet 'Critical & High' written with 12 rows.
[2026-03-25 10:15:42] INFO  Detector Rules sheet written with 15 rows.
[2026-03-25 10:15:42] INFO  Responder Activity sheet written with 5 rows.
Report saved to: output/cloudguard_mock_report_20260325_101542.xlsxAgainst your real tenancy:
python cloudguard_exporter.py \
    --compartment-id ocid1.tenancy.oc1..YOUR_TENANCY_OCID \
    --profile DEFAULT \
    --region ap-mumbai-1
Export only open findings:
bash
python cloudguard_exporter.py \
    --compartment-id ocid1.tenancy.oc1..YOUR_TENANCY_OCID \
    --status OPEN
What Is in the Output Report
SheetContentsCoverMetadata, totals by risk and status, sheet indexSummary DashboardRisk bar chart, status pie chart, top affected resource typesAll ProblemsFull list, color-coded by risk, with auto-filterCritical & HighFiltered urgent findings only — ready for immediate triageDetector RulesAll recipe rules, risk levels, enabled/disabled stateResponder ActivityAudit trail of all remediation and notification actions
Key Takeaways
Working through this project teaches five habits that apply to any OCI Python SDK automation:
1. Always use oci.pagination.list_call_get_all_results() instead of manual pagination loops. It handles next_page tokens, retries, and edge cases automatically.
2. Set compartment_id_in_subtree=True whenever you want full tenancy visibility. Without it, child compartments are invisible to your script.
3. Wrap every API field access in safe_str() or an equivalent guard. OCI response objects return None for optional fields, and one unguarded access silently breaks everything downstream.
4. Catch oci.exceptions.ServiceError specifically, not bare Exception. It gives you the HTTP status code and the OCI error message, which makes debugging 10x faster.
5. Separate OCI logic from formatting logic. The main script knows nothing about Excel. The sheet builders know nothing about OCI. Both sides become independently testable.
메타데이터
- post_id
- e1d4c831fcf1
- slug
- exporting-oci-cloud-guard-findings-to-excel-for-compliance-reporting-using-python-sdk-e1d4c831fcf1
- url
- https://medium.com/@tokishi/exporting-oci-cloud-guard-findings-to-excel-for-compliance-reporting-using-python-sdk-e1d4c831fcf1
- canonical_url
- https://medium.com/@tokishi/exporting-oci-cloud-guard-findings-to-excel-for-compliance-reporting-using-python-sdk-e1d4c831fcf1
- author_url
- https://medium.com/@tokishi
- status
- ok
- fetched_at
- 2026-06-24 11:06:28