What I Learned Breaking My Own Trading Infrastructure
Building a single-host trading systems lab taught me more about observability and failure than building the matching engine ever did.
What I Learned Breaking My Own Trading Infrastructure
Building a single-host trading systems lab taught me more about observability and failure than building the matching engine ever did.
Part 1: The Matching Engine Was The Easy Part
Most engineers think the difficult part of trading systems is:
- Matching engines
- FIX protocol
- Order books
- Kafka
You can build a matching engine in a weekend.
Understanding what happens when it breaks takes months.
I spent two weeks implementing an order book with deterministic matching. I spent three months understanding why my monitoring system couldn’t detect failures.
This is the story of what I learned breaking things intentionally.
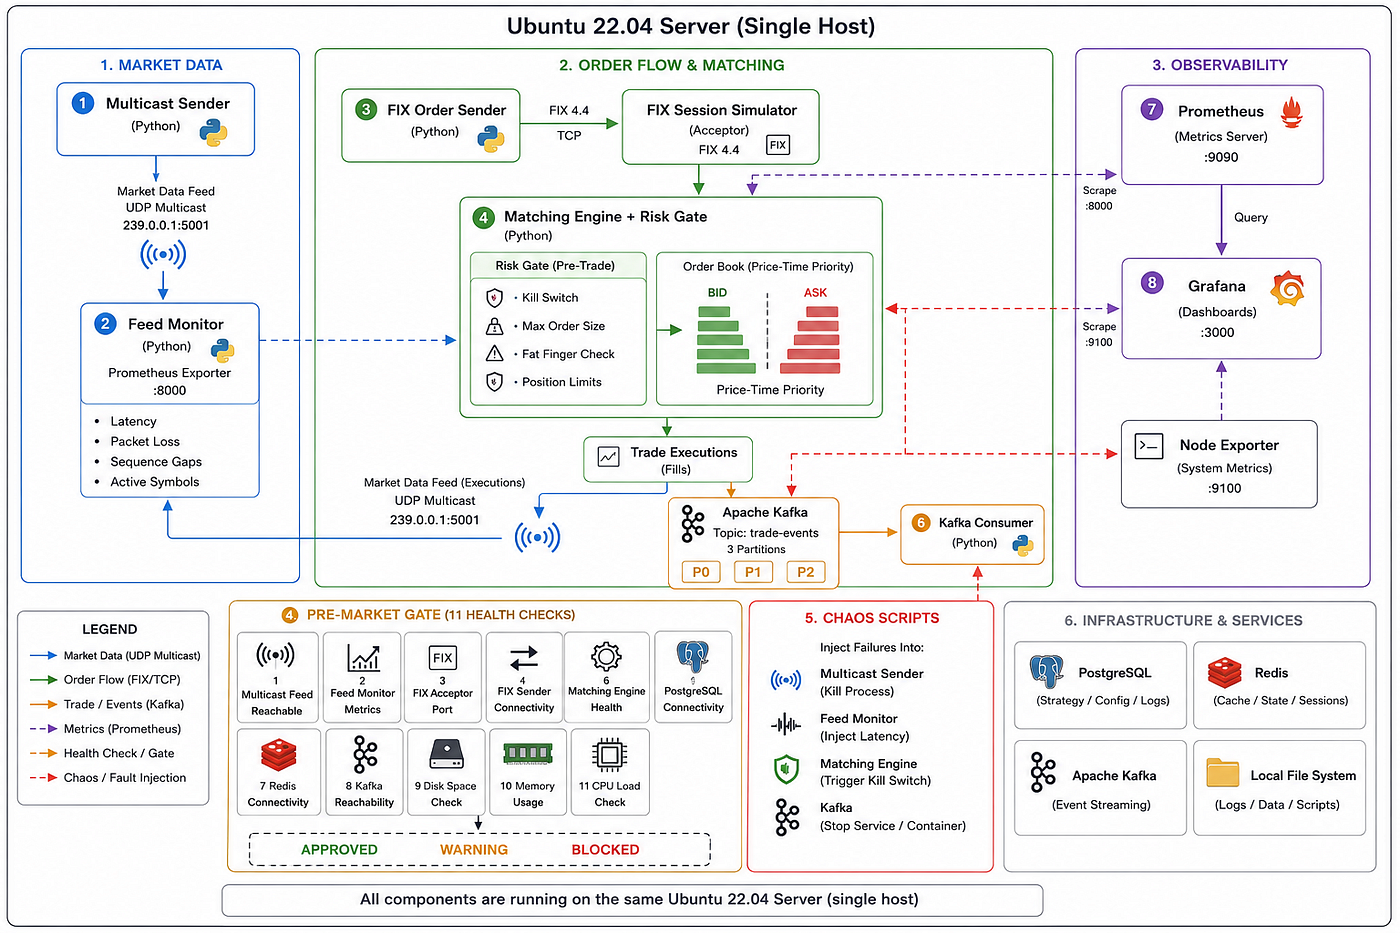
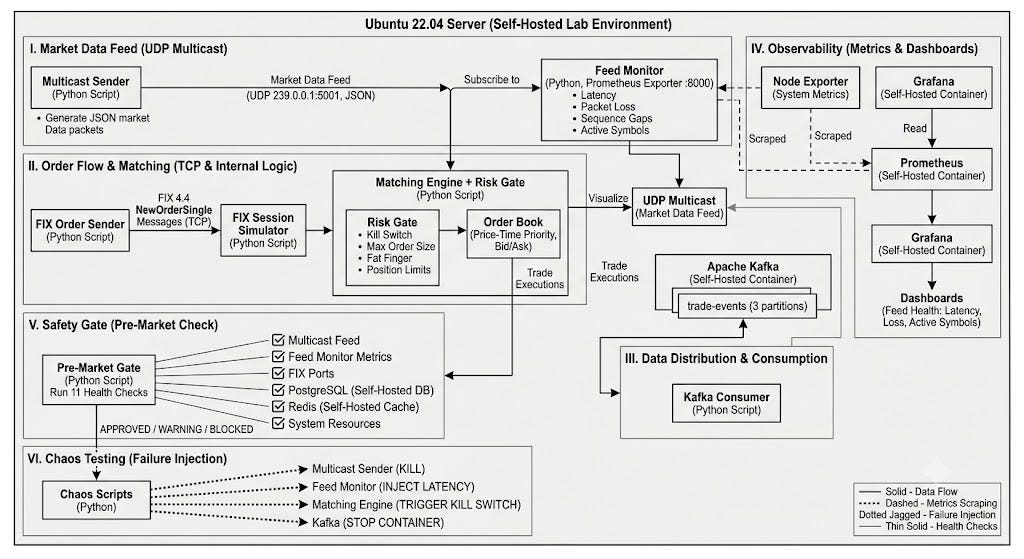
Part 2: The Lab
A single Ubuntu server running:
UDP Multicast → Feed Monitor → Prometheus/Grafana
FIX → Risk Gate → Matching Engine → Kafka → PostgreSQL
One diagram. The architecture itself is not the story.
The story is what happens when you inject failures and discover your assumptions were wrong.
Part 3: Failure #1 Packet Loss Testing Didn’t Work
What I Expected
Inject 20% packet loss on the multicast feed. Observe gaps in sequence numbers. Watch the gate detect packet loss.
What Actually Happened
I ran the test. Packet loss injection succeeded. But the feed showed zero packets dropped.
For 45 minutes, I tried different approaches:
- iptables rules
- tc netem with different parameters
- Different packet loss percentages
Nothing worked.
Why
localhost UDP multicast uses IP_MULTICAST_LOOP. The kernel bypasses the network stack for same-host multicast. The tc qdisc never sees the packets.
This is a kernel-level detail I didn’t know. My architecture assumption “same-host multicast behaves like network multicast” was wrong.
The Lesson
Infrastructure assumptions are often wrong. Not bugs. Assumptions.
Before you write chaos tests, you need to understand which failure modes are even possible in your architecture. Same-host multicast is immune to network-layer packet loss injection.
This taught me to validate assumptions first. Test assumptions. Document what’s impossible, not just what’s possible.
Part 4: Failure #2 — The Monitoring Blind Spot
What I Discovered

I injected 150ms artificial latency into the feed processing. The latency check reported: 2ms.
The system was degraded but the monitoring system was blind to it.
Why
The latency check made its own measurement: it opened a fresh socket, received a packet, and measured the time. That socket saw low latency (~2ms).
But the main feed consumer (which I also wrote) was experiencing 150ms of processing delay. The check never measured that.
Two independent measurements of the same phenomenon. One was blind to the other.
The Fix
Dual measurement:
- Measure own latency (fresh socket)
- Query feed_monitor’s reported latency (main consumer’s view)
- Use worst-case for gate decision
After the fix, the latency check detected the 150ms delay correctly.
The Lesson
This is the most important lesson from the entire lab.
Safety-critical checks need dual measurement. Not for redundancy. For coverage.
Different measurement points see different problems. A fresh socket might see low latency while the main consumer starves under garbage collection. A one-time measurement might catch a healthy state while the rolling average sees degradation.
If you only measure from one angle, you will be blind to failures from other angles.
This pattern now applies to every safety-critical check I write.
Part 5: Failure #3 — The Consumer Crash That Changed Nothing
What I Expected
Kill the Kafka consumer (trade_persister). Watch the feed degrade. Watch the gate detect and block.
What Actually Happened

I killed the consumer. The feed stayed healthy. Latency unchanged. Packet count unchanged.

The gate blocked but for a different reason (disk space).
Why
The architecture I designed isolated the feed from persistence.
The multicast feed runs independently. The Kafka consumer runs independently. When the consumer dies, the feed doesn’t care. Trades stop persisting, but market data keeps flowing.
This is correct architectural design. But it’s also why it was invisible — the consumer crash produced no observable symptom in the feed metrics.
The Lesson
Architectural isolation is good. But isolation creates observability gaps.
When you decouple systems, you remove failure propagation. The consumer can fail silently because the feed doesn’t see it.
In a trading system, that’s the right trade-off (data delivery > data persistence). But you need to know about it and accept it.
The consumer crash test proved that my architecture works as designed. But it also revealed that if Kafka dies, there’s no alert.
Part 6: Failure #4 — CPU Credits Were More Dangerous Than Failures
The system ran on t3.micro (1 vCPU, burstable credits).
For a week, everything worked fine.
Then the instance started crashing. Services would restart randomly. Kafka would die. The multicast sender would lag.
I expected a bug. I got resource starvation.
Why
t3.micro gets burst credits. Full CPU for a while. When credits exhaust, you drop to baseline (5% CPU). That baseline is not enough for Kafka + Prometheus + Postgres + 3 Python daemons.
The fix wasn’t code. It was upsizing to t3.small.
The Lesson
Service crashes are obvious. Resource starvation is sneaky.
When a process crashes, you get a restart log. When CPU exhausts, you get cascading failures across multiple services that appear unrelated.
Burstable instances are dangerous for always-on multi-service stacks.
This taught me more about production operations than any failure testing did. The system wasn’t broken. It was just underfunded.
Part 7: What These Failures Taught Me
Observability isn’t optional. A system that runs fine but can’t be measured is worse than a system that fails obviously.
Assumptions are dangerous. I assumed same-host multicast behaved like real multicast. I assumed the latency check saw everything. I assumed the consumer crash would affect the feed.
Every assumption was wrong.
Architectural trade-offs are real. Decoupling the feed from persistence is good design. But it means consumer crashes are silent. You need to know about it and accept it.
Resource constraints are the real enemy. Service crashes are obvious. Resource starvation is invisible until everything cascades.
Part 8: What I’d Build Differently
This lab has gaps:
- No redundancy. Single host means single point of failure.
- No persistent FIX sessions. Real trading systems require stateful order entry.
- Limited market data realism. Real feeds are higher volume, more symbols, more complex.
- Incomplete chaos coverage. Only 4 of 10 chaos scenarios are validated.
- No production hardening. No rate limiting, no circuit breakers, no graceful degradation.
These aren’t bugs. They’re scope decisions.
For interview preparation and learning, this lab is complete. For production use, it would need hardening.
What This Is Actually Useful For
If you’re prepping for SRE/Platform Engineering roles, this lab teaches:
Production operations thinking:
- Failure testing is systematic, not reactive
- Observability patterns matter (dual measurement)
- Architectural trade-offs are real and must be documented
- Resource constraints are the real enemy
Real observability in action:
Chaos testing interface:
Real data flowing through the system:
Subtitle: Building a single-host trading systems lab taught me more about observability and failure than building the matching engine ever did.
Part 1: The Matching Engine Was The Easy Part
Most engineers think the difficult part of trading systems is:
- Matching engines
- FIX protocol
- Order books
- Kafka
You can build a matching engine in a weekend.
Understanding what happens when it breaks takes months.
I spent two weeks implementing an order book with deterministic matching. I spent three months understanding why my monitoring system couldn’t detect failures.
This is the story of what I learned breaking things intentionally.
Part 2: The Lab
A single Ubuntu server running:
UDP Multicast → Feed Monitor → Prometheus/Grafana
FIX → Risk Gate → Matching Engine → Kafka → PostgreSQL
One diagram. The architecture itself is not the story.
The story is what happens when you inject failures and discover your assumptions were wrong.
Part 3: Failure #1 — Packet Loss Testing Didn’t Work
What I Expected
Inject 20% packet loss on the multicast feed. Observe gaps in sequence numbers. Watch the gate detect packet loss.
What Actually Happened
I ran the test. Packet loss injection succeeded. But the feed showed zero packets dropped.
For 45 minutes, I tried different approaches:
- iptables rules
- tc netem with different parameters
- Different packet loss percentages
Nothing worked.
Why
localhost UDP multicast uses IP_MULTICAST_LOOP. The kernel bypasses the network stack for same-host multicast. The tc qdisc never sees the packets.
This is a kernel-level detail I didn’t know. My architecture assumption — “same-host multicast behaves like network multicast” — was wrong.
The Lesson
Infrastructure assumptions are often wrong. Not bugs. Assumptions.
Before you write chaos tests, you need to understand which failure modes are even possible in your architecture. Same-host multicast is immune to network-layer packet loss injection.
This taught me to validate assumptions first. Test assumptions. Document what’s impossible, not just what’s possible.
Part 4: Failure #2 — The Monitoring Blind Spot
What I Discovered
I injected 150ms artificial latency into the feed processing. The latency check reported: 2ms.
The system was degraded but the monitoring system was blind to it.
Why
The latency check made its own measurement: it opened a fresh socket, received a packet, and measured the time. That socket saw low latency (~2ms).
But the main feed consumer (which I also wrote) was experiencing 150ms of processing delay. The check never measured that.
Two independent measurements of the same phenomenon. One was blind to the other.
The Fix
Dual measurement:
- Measure own latency (fresh socket)
- Query feed_monitor’s reported latency (main consumer’s view)
- Use worst-case for gate decision
After the fix, the latency check detected the 150ms delay correctly.
The Lesson
This is the most important lesson from the entire lab.
Safety-critical checks need dual measurement. Not for redundancy. For coverage.
Different measurement points see different problems. A fresh socket might see low latency while the main consumer starves under garbage collection. A one-time measurement might catch a healthy state while the rolling average sees degradation.
If you only measure from one angle, you will be blind to failures from other angles.
This pattern now applies to every safety-critical check I write.
Part 5: Failure #3 — The Consumer Crash That Changed Nothing
What I Expected
Kill the Kafka consumer (trade_persister). Watch the feed degrade. Watch the gate detect and block.
What Actually Happened
I killed the consumer. The feed stayed healthy. Latency unchanged. Packet count unchanged.
The gate blocked — but for a different reason (disk space).
Why
The architecture I designed isolated the feed from persistence.
The multicast feed runs independently. The Kafka consumer runs independently. When the consumer dies, the feed doesn’t care. Trades stop persisting, but market data keeps flowing.
This is correct architectural design. But it’s also why it was invisible — the consumer crash produced no observable symptom in the feed metrics.
The Lesson
Architectural isolation is good. But isolation creates observability gaps.
When you decouple systems, you remove failure propagation. The consumer can fail silently because the feed doesn’t see it.
In a trading system, that’s the right trade-off (data delivery > data persistence). But you need to know about it and accept it.
The consumer crash test proved that my architecture works as designed. But it also revealed that if Kafka dies, there’s no alert.
Part 6: Failure #4 — CPU Credits Were More Dangerous Than Failures
The system ran on t3.micro (1 vCPU, burstable credits).
For a week, everything worked fine.
Then the instance started crashing. Services would restart randomly. Kafka would die. The multicast sender would lag.
I expected a bug. I got resource starvation.
Why
t3.micro gets burst credits. Full CPU for a while. When credits exhaust, you drop to baseline (5% CPU). That baseline is not enough for Kafka + Prometheus + Postgres + 3 Python daemons.
The fix wasn’t code. It was upsizing to t3.small.
The Lesson
Service crashes are obvious. Resource starvation is sneaky.
When a process crashes, you get a restart log. When CPU exhausts, you get cascading failures across multiple services that appear unrelated.
Burstable instances are dangerous for always-on multi-service stacks.
This taught me more about production operations than any failure testing did. The system wasn’t broken. It was just underfunded.
Part 7: What These Failures Taught Me
Observability isn’t optional. A system that runs fine but can’t be measured is worse than a system that fails obviously.
Assumptions are dangerous. I assumed same-host multicast behaved like real multicast. I assumed the latency check saw everything. I assumed the consumer crash would affect the feed.
Every assumption was wrong.
Architectural trade-offs are real. Decoupling the feed from persistence is good design. But it means consumer crashes are silent. You need to know about it and accept it.
Resource constraints are the real enemy. Service crashes are obvious. Resource starvation is invisible until everything cascades.
Part 8: What I’d Build Differently
This lab has gaps:
- No redundancy. Single host means single point of failure.
- No persistent FIX sessions. Real trading systems require stateful order entry.
- Limited market data realism. Real feeds are higher volume, more symbols, more complex.
- Incomplete chaos coverage. Only 4 of 10 chaos scenarios are validated.
- No production hardening. No rate limiting, no circuit breakers, no graceful degradation.
These aren’t bugs. They’re scope decisions.
For interview preparation and learning, this lab is complete. For production use, it would need hardening.
What This Is Actually Useful For
If you’re prepping for SRE/Platform Engineering roles, this lab teaches:
Production operations thinking:
- Failure testing is systematic, not reactive
- Observability patterns matter (dual measurement)
- Architectural trade-offs are real and must be documented
- Resource constraints are the real enemy
Real observability in action:
Chaos testing interface:
Real data flowing through the system:
Technical depth:
- UDP multicast quirks (IP_MULTICAST_LOOP)
- Kafka event persistence
- Prometheus + Grafana safety-gate design
- systemd service hardening
Realistic stories for interviews:
- “Monitoring was blind to a performance issue. We fixed it with dual measurement.”
- “Architecture isolation meant failures were silent. We had to accept that trade-off.”
- “CPU starvation broke the system more than any bug did.”
These aren’t invented stories. They’re real failures from breaking a system on purpose.
The Actual Lesson
Build something. Break it systematically. Document what you learn.
That’s production thinking.
Not how to build systems.
How to understand them when they fail.
Repo: github.com/ibraheemcisse/trading-infra-lab Postmortems: docs/postmortems/
Technical depth:
- UDP multicast quirks (IP_MULTICAST_LOOP)
- Kafka event persistence
- Prometheus + Grafana safety-gate design
- systemd service hardening
The Actual Lesson
Build something. Break it systematically. Document what you learn.
That’s production thinking.
Not how to build systems.
How to understand them when they fail.
Repo: github.com/ibraheemcisse/trading-infra-lab Postmortems: docs/postmortems/
메타데이터
- post_id
- e2dfcd3a3491
- slug
- what-i-learned-breaking-my-own-trading-infrastructure-e2dfcd3a3491
- url
- https://medium.com/@Ibraheemcisse/what-i-learned-breaking-my-own-trading-infrastructure-e2dfcd3a3491
- canonical_url
- https://medium.com/@Ibraheemcisse/what-i-learned-breaking-my-own-trading-infrastructure-e2dfcd3a3491
- author_url
- https://medium.com/@Ibraheemcisse
- status
- ok
- fetched_at
- 2026-06-16 19:09:56