Application of Python, BERT, and Sentence-Transformers multimodal dynamic weight fusion models in…
Full article link: https://tecdat.cn/?p=46001 Original source: Tuoduan Data Tribe official account
Application of Python, BERT, and Sentence-Transformers multimodal dynamic weight fusion models in text mining and intelligent recommendation on dating platforms | with AI agents, code, and data
Full article link: https://tecdat.cn/?p=46001 Original source: Tuoduan Data Tribe official account
Cover:

Abstract (Chinese): This article focuses on user profiles and intelligent matching issues on online dating platforms. Based on Baihe.com user data, this paper systematically explains the entire process of data scraping, preprocessing, visual analysis, and automated matching algorithms. The study answers three core questions: How can a high-quality marriage dataset be constructed? What kind of multidimensional feature structure do platform users display? How to design a dynamic weight matching algorithm that integrates hard indicators with soft semantics? This article provides a complete solution that includes code, data, and AI agents. English: This paper focuses on user profiling and intelligent matching for online dating platforms. Based on user data from Baihe.com, we detail the complete pipeline of data crawling, preprocessing, visual analysis, and automated matching algorithms. The study addresses three core questions: How to construct a high-quality dating dataset? What multidimensional characteristics do platform users exhibit? How to design a dynamic weight matching algorithm that integrates hard criteria and soft semantics? A complete solution including code, data, and an AI agent is provided.
As data science and artificial intelligence are reshaping every industry, the marriage and dating market is undergoing a profound transformation from traditional “matchmakers” to “algorithmic matchmaking.” As researchers deeply involved in machine learning and data mining, we know that behind what seems like a simple “recommendation” lies a complex symphony of data collection, feature engineering, semantic understanding, and operational optimization. This article is adapted from a consulting project we carried out for a large marriage platform, aiming to comprehensively demonstrate how to use modern AI technology to solve the challenges of matchmaking. We distilled core experience from the project — such as BERT text semantic modeling, dynamic weight allocation, and multidimensional feature fusion — into a conversational AI agent that facilitates rapid reuse by technical and business personnel.
This article distills our experience in multidimensional dynamic weight matching modeling into a conversational AI agent.
Read the original article to join the group to access the full code, data, AI agents, and more of the latest AI insights and industry insights, and connect and grow with 900+ industry professionals; It also provides manual Q&A, breaking down core principles, code logic, and business adaptation ideas; If you encounter code running issues, you can enjoy 24-hour debugging support.
Analyze the process

About the analyst
Yifang Yan sincerely thanks Yifang Yan for his contributions to this article. He completed a bachelor’s degree in Information Management and Information Systems at Huazhong University of Science and Technology, focusing on data mining and intelligent recommendations. Skilled in Python, data analysis, machine learning, and algorithm design. Previously held an application function implementation position at GoerTek, focusing on enterprise digital transformation and data-driven decision-making.
1. Introduction
Currently, the digitalization and platformization trends in the marriage and dating market are becoming increasingly evident. With advances in data science and artificial intelligence technology, marriage platforms not only provide a broader social space for singles but also open new technological possibilities for user profile analysis, marriage preference research, and intelligent matching recommendations. This project uses “Baihe.com” as the core data source, building a structured, high-quality dataset through automated collection and rigorous data cleaning processes. On this basis, multidimensional user feature analysis and automated matchmaking modeling were conducted, providing detailed data support for understanding the structure and dynamics of the online matchmaking market and optimizing recommendation mechanisms.
2. Data scraping
2.1 Selection of Website Crawlers
This project selected “Baihe.com” as the crawling target.
2.2 Detailed Design
This project utilizes two major libraries, Selenium and Requests, to achieve automated login and batch collection of specified user page data.

After launching the browser, the program will automatically redirect to the login page, leaving a manual login time window. After success, the current authentication cookie is automatically obtained and assembled as . All subsequent requests are based on this cookie to ensure the session is valid.cookies_dict
Prompt:
I need to collect data on the dating website, which requires login to access the user detail page. Please help me write a Python script to open the Chrome browser using Selenium and log in. After successful login, it extracts cookies for subsequent Requests requests. Pay attention to setting Chrome options (disable GPU, sandbox) to increase stability and use webdriver_manager automatic driver management. After extracting cookies, they must be printed out to verify the format.
In the core collection loop, the program traverses the specified range and initiates an HTTP request to each user’s homepage to retrieve the HTML content. Then, a custom function is called to perform DOM parsing based on BeautifulSoft. Field extraction and mapping rules are uniformly maintained by the two dictionaries, supporting automatic extraction and standardization of multi-dimensional fields such as user basic information, detailed features, and mate selection intentions.oppIDparse_htmldt_text2fieldmarriage_pref_map


Prompt:
Based on the cookies we obtain, we need to bulk scrape user profile pages. I have a list of user IDs. Please help me write a parser function using Python and Requests together with BeautifulSoup. It traverses each ID, constructs requests to obtain HTML, then extracts text from the page according to predefined field mapping rules (such as mapping “age” to the age field), and finally stores the structured data in DataFrame and exports it to Excel. Pay attention to the request interval to avoid accessing too quickly.
Read the original article to join the group for complete content and more AI insights and industry insights, and connect and grow with 900+ industry professionals.
3. Data preprocessing
3.1 Preprocessing Goals and Core Strategies
Raw data formats are diverse, and information shortages are common. The core of preprocessing is to transform raw mixed data into clean, consistent, and complete datasets. The core strategy is as follows:
- High-quality data filtering: Filter by completeness, prioritizing records with sufficient information.
- Systematic cleaning and conversion: unified standards, such as converting range values to single point values.
- Robust outlier identification and rejection: IQR combined with visualization to identify outliers.
- Configurable policy-based missing value filling: flexibly padding for different field characteristics.
- Data classification: Divided by gender into two versions: male and female.

3.2 Data Cleaning and Preliminary Conversion Processes
3.2.2 Raw Data Loading and Placeholder Unification
The first step in preprocessing is to use Pandas to load the raw Excel file and standardize invalid placeholders. We uniformly replace meaningless strings like “I’ll tell you later,” “unlimited,” and “unfilled” with standard missing value representations in NumPy and Pandas, which form the foundation for all subsequent missing value detection and filling work.np.nan
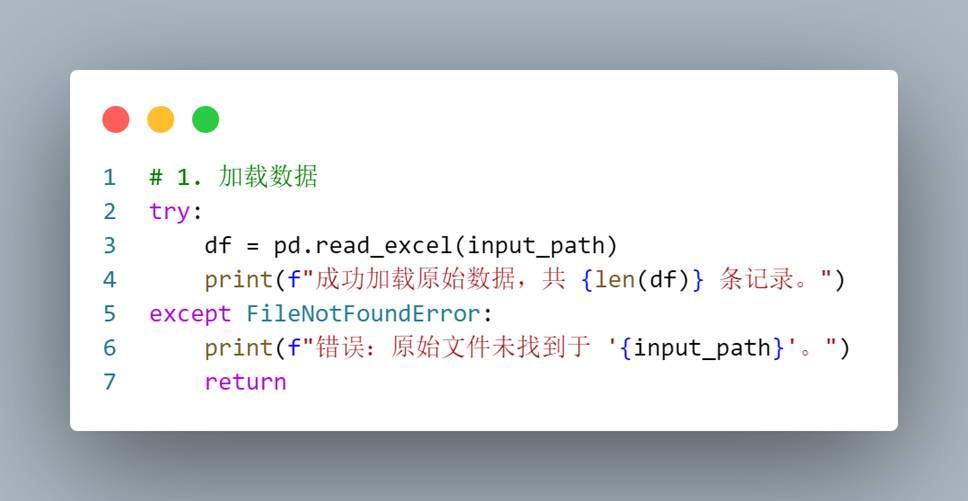
3.2.3 Data Filtering Based on Completeness
We adhere to the principle of “quality first.” Calculate the proportion of non-empty fields in each record to obtain the “data completeness score.” Set a completeness threshold, retaining only records with completeness reaching or exceeding 80%, filtering out a large number of low-information samples.completeness_threshold = 0.8

In the end, we found nearly 1,000 records that met the requirements out of nearly 100,000.
3.3 Advanced processing of key fields
3.3.1 Numeric Field Formatting: Age and Height
Age and height are often represented in ranges (such as “25~30”). We implemented a function that automatically calculates the midpoint value and unifies the data into standard integer types.parse_range_to_midpoint
Prompt:
Now let’s start cleaning the key numerical fields. When processing user data, many fields in ‘Age’ and ‘Height’ are filled with ranges, such as ‘25~30 years old’ or ‘170–175’. Please help me write a Python function to extract these range values and calculate the middle point (rounding), converting individual values directly to integers. Then, use this function to batch clean these columns in the DataFrame and visualize the distribution comparison before and after processing to verify the effect.
3.3.2 Cleaning by Type Field: Education
Educational information may be multiple-choice, such as “Bachelor’s, Master’s”. We designed a function that automatically extracts the last academic degree as the final level.get_last_education
3.3.3 De-templated text fields: Friendship declaration
For templated content with a large amount of copy-paste in the dating declaration field, we identified “template declarations” with frequency greater than 1 and labeled them as missing, then randomly sampled them to fill them in to increase data authenticity.
3.4 Outlier Detection and Removal
3.4.1 Methodology: IQR and Visualization
We use a robust interquartile method to identify outliers. Data points outside the range of [Q1–1.5IQR, Q3 + 1.5IQR] are considered abnormal. Before performing removal, Seaborn was used to generate a box plot that intuitively displayed the data distribution and identified anomalies.
Prompt:
Next, handle the outliers. Please use the IQR method to check the ‘Age’ and ‘Height’ columns; anything beyond the upper and lower bounds is considered abnormal. Before deleting, we need to use Seaborn to draw the boxplot of these two fields, mark the locations of outliers on the chart, and then print the specific row index for the outliers. Finally, these exception rows are removed from the DataFrame, and the number of data rows before and after cleaning is returned.
We eventually found 73 outliers and removed them.


Obviously, the 73 excluded data points all come from age columns, with the reason for being too old.
3.5 Policy-based Missing Value Filling
We use highly configurable functions to systematically fill missing values.advanced_filler
3.5.1 Fill Strategy Design
Define different filling strategies based on field characteristics:
- Statistic filling: age and height, using the mean.
- Random sampling filling: Increase diversity and adopt a friendship declaration.
- Specify value filling: Some fields are filled according to business logic.
3.6 Final Dataset Organization and Output
3.6.1 Splitting by gender version
Separate the male and female versions into two independent subsets based on the “Version” column for easier comparison and analysis.

3.6.2 Final Output Document
The final result is three clean and organized Excel files:
profile_info_final_cleaned_and_processed.xlsx: All high-quality samples are integrated into the dataset.profile_info_final_cleaned_and_processed_female_version.xlsx: Female version sample dataset.profile_info_final_cleaned_and_processed_male_version.xlsx: Male version sample dataset.
4. Visualization
4.1 In-depth Analysis of Core User Demographic Characteristics
4.1.1 Differentiated Marriage and Dating Perspectives by Gender
Gender plays a central role in dating websites. We analyze user characteristics from two dimensions: age and height.
(1) Detailed analysis of female user characteristics
- Age distribution of women: The golden period for marriage overlaps highly with the career development period
- Core Data Overview: 25–29 (36%) and 30–34 (42%) are the main participants, together accounting for 78%. There are very few users under 20 years old.
- Anxiety and Needs of the “Golden Marriageable Period”: Women in this age group generally face expectations and pressures from family, society, and themselves. Social circles are rigid, and busy work schedules have made dating websites an important and efficient channel.
- “Early aging” anxiety and the influx of platforms: After 30, some women feel “age anxiety” and are more proactive in using dating platforms. The peak between ages 30–34 indirectly confirms the “the more mature, the more positive the attitude toward marriage and relationships.”
- Balancing career and romance: When choosing a partner, they place greater importance on the partner’s career potential, financial stability, and sense of family responsibility.
- Women’s height distribution: Tall women break through in marriage and romance
- Core Data Overview: The peak female height is concentrated in the 175–179cm range (260 people), followed by 180–189 cm (141 people). Below 160cm, the data volume is extremely small.
- Traditional prejudice and practical pressure of “tall men and short women”: Under the aesthetic of “tall men and short women,” tall women face significant challenges in finding partners who are “taller than themselves” in reality.
- Dating websites have become “safe havens for tall women”: they tend to turn to online platforms to broaden their range of partner choices. This distribution reveals the structural problem of height matching in the marriage market.
- Individual aesthetics and diverse needs: Online platforms may attract male users who prefer tall women, fostering this concentration.
(2) Detailed analysis of male user characteristics
- Age distribution among men: Marriage and relationships “start” earlier and economic anxiety comes earlier
- Core data overview: 20–24 (46%) and 25–29 (34%) are the main group, totaling 80%, making them younger than women.
- Age differences in the “start” of marriage and relationships: Men may become interested in marriage and relationships at an earlier age; ages 20–24 are usually after university graduation or entering the workforce, with a limited social circle.
- Early economic pressure and anxiety about marriage: Young men perceive society’s expectations for men’s economic conditions earlier, prompting them to enter dating websites early.
- “Dislocation” with female age: the male mainstream group (20–29 years old) is significantly younger than the female mainstream (25–34 years old), creating an interesting “misalignment.”
- Male height distribution: The large-scale gathering and courtship drive of men with height “disadvantages.”
- Core Data Overview: Male heights are significantly concentrated between 160–164 cm (333 people), followed by 165–169 cm (247 people). This stands in stark contrast to the average height.
- The reality projection of “male height anxiety”: Height is regarded as one of the core “hard conditions,” and men who lack a height advantage often encounter resistance in reality and have limited choices.
- The “safe harbor” of online platforms and the motivation to seek a partner: dating websites provide them with an important channel to break through real-world limitations and seek equal opportunities. This confirms the role of dating websites in addressing the “structural flaws” in the real dating market.
- “Mirror image” with tall women: This distribution forms a “mirror” relationship with the aforementioned female height distribution (concentration of tall women), where both sides are blocked in reality by the “non-mainstream” characteristics of height and converge online.


Mentor Q&A frequently asked questions and standard answers
- Q: Why choose Baihe.com as a single data source instead of considering multi-platform data integration?
- Answer: This project is positioned for deep excavation rather than broad coverage. A single platform ensures consistency in data formats and user behavior patterns, facilitating the construction of high-quality datasets and accurate profiling. Aligning and cleaning multi-source heterogeneous data significantly increases upfront costs, so we compensate for breadth by deepening ten-dimensional feature analysis on a single platform. Based on this framework, the concept of federated learning can be extended to multiple platforms.
- Q: The exclusion criterion for height and age outliers is IQR. For obvious non-normal distributions, how can this method be robust?
- A: That’s exactly why we use IQR instead of Z-score (assuming normality). IQR is based on quartiles, providing natural robustness to skewed distributions and long-tail data, and is not easily affected by extreme values. We then use boxplot visualization to verify this, combined with business common sense (such as being over 80 years old), to double-verify the logic behind the removal.
- Q: In dynamic weight adjustment, how are the initial weight values for different dimensions (e.g., age 15, height 8) determined?
- Answer: The initial weighting comes from three aspects: first, literature review of classic marriage psychology research, establishing a priori ranking of the importance of each dimension; Second, based on the Spielman correlation coefficient heatmap analysis from our cleaned dataset, we observed the correlation strength of each feature with the proxy variable “successful match”; Third, it combined Delphi law consultations with business experts (senior platform matchmakers) and ultimately used the analytic hierarchy process (AHP) for head-to-head comparison, rather than subjective speculation.
4.3 In-depth analysis of user geographic distribution
4.3.1 Population Statistics Chart of the Region: The ‘Urban Attraction’ of Marriage and Relationship Demand
- Core Data Overview: Users are highly concentrated in economically developed and densely populated areas such as Guangdong Province (141 people), Beijing City (105 people), Jiangsu Province (92 people), and Shandong Province (77 people). There are very few users overseas and in western provinces.
- Demographic dividend and explosive demand for marriage and relationships: Developed cities, with a high single population base, fast-paced lifestyles, and fixed social circles, are jointly encouraging single young people to actively seek online marriage and relationship support.
- The necessity and advantages of regional matching: Marriage and relationships have a strong regional attribute, and this high concentration naturally provides platforms with a natural advantage for efficient localized matching.
- A microcosm of marriage and dating in “Beijing, Shanghai, Guangzhou, and Shenzhen”: The most economically active markets have the most pronounced supply-demand contradictions and the trend toward digitalization, making them the main battleground for dating websites.
- Challenges of Internationalization and Regional Penetration: The sparse number of users in overseas and underdeveloped western regions indicates that the website’s core user base is in China’s eastern coastal and first-tier cities, and regional penetration still faces challenges.

4.4 Comprehensive User Profiling and Strategy Recommendations
4.4.1 Core User Profiles of Dating and Marriage Websites
Based on the above analysis, the core user profile of the website is as follows:
- The “complementary challenge” of gender and age characteristics:
- Female users: Mainly mature marriageable age groups aged 25–34, with many tall women (175–189cm) actively turning to online platforms, showing more mature expectations for marriage and relationships.
- Male users: Mainly young people aged 20–29, mostly men (160–169cm) who are relatively short, using dating websites as “safe havens” for seeking opportunities.
- Platform users exhibit a kind of “reverse clustering” in terms of height: women tend to be tall, while men tend to be relatively short. This “complementary challenge” is the platform’s core feature and a challenge for matching algorithms to overcome.
- Marital status: The vast majority are clearly single and unmarried, with precise platform positioning. Coverage for a small number of divorced and widowed groups reflects inclusiveness.
- Educational Background: Polarized. Highly educated groups (especially PhDs) are eager to showcase and have high demands on their partners’ intellectual levels. A large number of users with “unknown” academic backgrounds implies that some users lack advantages in education or are strategically hiding their credentials.
- Economic Status: Overall, it features a middle- and low-income characteristic, serving a broader single population rather than just high-income individuals.
- Regional distribution: Highly concentrated in developed cities along the eastern coast, providing a clear direction for localized operations.
Core profile overview table
DimensionCharacteristics of female usersCharacteristics of male usersMatch the insightsAgeMainly aged 25–34, mature and pragmaticMainly for those aged 20–29, starting earlierThis creates an age mismatch where the woman is older and the man is younger, requiring algorithmic adjustmentHeightTall women are concentrated, seeking to break through onlineRelatively short men are concentrated, seeking online safe havensShowing a cluster of “mirror images” presents structural matching challengesEducationPolarization: highly educated groups have a strong willingness to showcase themselvesDifferentiated recommendation strategies can be designed for different educational levelsRegionIt is highly concentrated in developed cities along the eastern coastSame-city matching has a natural advantage, while demand for cross-city matching is weak

The user composition of this dating website deeply reflects the groups in China’s dating market that may be considered “non-mainstream” under traditional partner selection criteria, as well as “marginal breakthroughs” whose social circles are limited due to their special professions or academic backgrounds. They actively embrace online platforms, seeking to break through real-world barriers and find opportunities to better match their partners.
5. Automatic matching algorithm
After preliminary data analysis, we comprehensively considered users’ basic information, mate preference, geographic location, and semantic similarity of text content to design this matching algorithm, aiming to produce a matching result with a comprehensive matching score and top ranking.
5.1 Algorithm implementation
The matching process mainly includes the following key steps:

5.1.1 Data Loading and Preprocessing
From 1,245 valid data entries, records with missing key fields (such as age, height, education, marital status) were removed, and the datasets were divided into male () and female () datasets based on the “version” field.self.malesself.females
5.1.2 Text Preprocessing and Similarity Calculation
5.1.2.1 Text Preprocessing
Core steps include: removing special characters, using Chinese word segmentation, loading and stopping word lists to filter meaningless words, and finally concatenating the processed words into strings, providing clean input for BERT vectorization.jieba
5.1.2 BERT Vectorization and Text Similarity Calculation
We use a pretrained BERT model (which is like drawing a precise semantic map of text, industry term: sentence-level semantic embedding) to transform users’ self-descriptions and friendship declarations into high-dimensional vector representations to capture semantic information. Then, the cosine similarity of the vector is used to calculate text similarity.paraphrase-multilingual-MiniLM-L12-v2
Prompt:
We need to calculate the semantic similarity of users’ friendship declarations. Please use the Sentence-Transformers library to load a pre-trained Chinese semantic model (for example) and write a class method to handle the text of all male and female users. The specific steps include: 1. Batch encoding the text to obtain 384-dimensional embedding vectors; 2. Calculating the cosine similarity matrix between male and female vector matrices. For efficient processing, this computation should be placed in the class’s initialization method and stored for subsequent matching calls.
paraphrase-multilingual-MiniLM-L12-v2sklearn.metrics.pairwise.cosine_similarityself
5.1.3 Structured Similarity Calculation
5.1.3.1 Implementation Steps:
We selected the following 10 submodules from many factors to calculate each structured similarity score and weighted sum:
DimensionWeighty authorityKey points of matching rulesAge15Men are 1–5 years older than women, with 0.8 for the same age, preferring multiple bonus pointsHeight8The man is 5cm taller than the woman, preferably; 1–4cm taller is 0.8, which is a plusEducation10Educational qualifications are the best in the same class, with a grade difference of 0.8, decreasing by gradeIncome12Calculate income compatibility ratios, and both parties meeting each other’s minimum requirements will earn extra pointsGeographical location10Best within the same city, 0.8 for the same province, 0.6 for adjacent provinces, 0 points for 1000 km awayMarital status5Perfect marks for the same, zero for differencesHome purchase situation8Exactly the same full score, while both have already purchased homes for 0.8Children’s situation5Perfect marks for the same, zero for differencesValues12Cosine similarity based on keyword vectorsLifestyle8Cosine similarity based on keyword vectors
5.1.3.2 Dynamic weight adjustment
Fixed weights may not reflect individual differences, so we propose a dynamic weight adjustment algorithm. Weights are dynamically adjusted based on user characteristics (such as age, education, income).
Matching dimensionsDefault weightAdjust the rulesChanges in dimensions and weights involved after adjustmentAge15If the man is > 35 years old or the woman is > 30, adjustment is triggeredIncome weight increased by 20% (12→14.4), marital status weight increased by 30% (5→6.5), and home purchase weight increased by 20% (8→9.6).Height8NoneNoneEducation10If either party holds a master’s or doctoral degree, adjustments are triggeredLifestyle weight increased by 30% (8→10.4), values weight increased by 20% (12→14.4)Income12If the man’s income is > 20,000 or the woman’s income is > 15,000, adjustment is triggeredLifestyle weight increased by 30% (8→10.4)Geographical location10NoneNoneMarital status5Subject to age adjustment rulesWeight increased by 30% (5→6.5)Home purchase situation8Subject to age adjustment rulesWeight increased by 20% (8→9.6)Children’s situation5NoneNoneValues12Subject to the rules for adjusting academic qualificationsWeight increased by 20% (12→14.4)Lifestyle8Subject to rules for education or income adjustmentWeight increased by 30% (8→ 10.4)
5.1.3.3 Comprehensive Scoring Calculation
Weighted sum of the scores for the above 10 features yields a structured total score. Optionally, return to the detailed scoring dictionary.
Prompt:
Next, implement the core structured matching scoring function. The input is a data dictionary for two users (one male and one female), and a weighted total score is calculated based on the 10 dimensions defined earlier (age, height, education, income, location, marital status, home purchase status, children’s situation, values, lifestyle). The function should include two steps: 1. First, dynamically adjust the weights of each dimension based on user characteristics (for example, if you are over 30 years old, increase the weight of the income dimension); 2. Then iterate over each dimension, call the corresponding scoring rules (such as functions), calculate the score, and perform a weighted sum. At the same time, the function should be able to return detailed scores for each dimension to analyze the contribution.
score_agescore_height
- def compute_structured_score(male_profile, female_profile, base_weights):
- dynamic_weights = base_weights.copy()
- if male_profile[‘age’] > 35 or female_profile[‘age’] > 30:
- dynamic_weights[‘income’] = base_weights[‘income’] * 1.2
- dynamic_weights[‘marriage’] = base_weights[‘marriage’] * 1.3
- dynamic_weights[‘house’] = base_weights[‘house’] * 1.2
- if male_profile[‘education’] in [‘硕士’, ‘博士’] or female_profile[‘education’] in [‘硕士’, ‘博士’]:
- dynamic_weights[‘lifestyle’] = base_weights[‘lifestyle’] * 1.3
- dynamic_weights[‘values’] = base_weights[‘values’] * 1.2
- detailed_scores[‘age’] = score_age(male_profile[‘age’], female_profile[‘age’], …) * dynamic_weights[‘age’]
- detailed_scores[‘height’] = score_height(male_profile[‘height’], female_profile[‘height’], …) * dynamic_weights[‘height’]
- total_structured_score = sum(detailed_scores.values())
- return total_structured_score, detailed_scores
5.1.4 Comprehensive Matching Score
By combining the values of the structured score (75%) and text similarity (25%), a final matching score is generated as a bidirectional attraction.
Implementation steps:
generate_recommendations: Enter the user's ID and type, calculate the matching score with all heterosexual users, sort and return the top result.top_kget_top_matches: Calculate all possible male-female matching combinations, sort them, and return the top n best matches.run_matching_analysis: Generate top_k recommendations for each male user and save detailed results to Excel.export_top_matches_to_excel: Call and export the result.get_top_matches
Prompt:
Finally, the entire matching process is assembled. Please write a top-level function that receives all male and female user data, calls the previously defined structured scoring function and the text semantic similarity calculator, then weights 0.75 and 0.25 to weighted and sum the scores of both to obtain the final matching score. For each user, calculate the scores of all candidates and sort them in descending order, with the top 5 selected as the recommendation results. Finally, all recommended pairs and their scores are exported into an Excel file, which must include basic information about both the men and women and the detailed scores for each item.
compute_structured_scoreSemanticMatcher
5.3 Summary
This matchmaking analysis covered 3,630 data groups, with 18.4% matching in the same region, with Guangdong being a popular cluster; The average age for men is 26.1 years, for women 27.3 years, with an average age gap of -1.2 years; the average matching score is 84.70 points, with over 94% of the scores being extremely high or high, indicating overall excellent matching quality.
Evaluation indicatorsActual test dataExplanationMatch the total number of combinations3,630 groupsCovers all valid male and female pairingsAverage final match score84.70 pointsScores are concentrated in the 70–90 range, showing a slightly left-biased normal distributionHigh scores (70–85) accounted for the majority48.4%This reflects that the algorithm has good recognition ability for highly fit combinationsExtremely high scores (85–100) accounted for48.4%The total score for high-rated segments exceeds 96%, with overall matching quality excellentMatching proportion within the same region18.4%Regional concentration is evident, with Guangdong being a popular clusterAverage age of men/women26.1 / 27.3 yearsThe structure of the marriageable group is characterized by “slightly younger men and slightly older women.”
6. Summary and Insights
This project successfully constructed user profiles of China’s online marriage and relationship market, and based on structured features and textual semantic information, designed and implemented an intelligent matchmaking algorithm. The analysis shows that platform users have distinct and highly concentrated characteristics across multiple dimensions such as gender, age, height, education, income, and geography. The algorithm matched results with excellent results, with over 90% of high-score matching pairs proportioned, validating the scientific and practical nature of the data-driven multi-indicator fusion matching strategy.
Algorithmic Innovation and Practical Value : This study achieves three core breakthroughs at the methodological level:
- Dynamic and static weight adaptive fusion mechanism: abandoning fixed weights, a set of dynamic weight adjustment rules triggered by user profiles (such as age and education) was designed. For example, when users are over 35, the algorithm automatically increases matching weights for economic dimensions such as “income” and “home purchase” by 20%-30%, better matching the pragmatic partner preferences of this group.
- Hybrid alignment model of hard metrics and soft semantics: Combining “hard metrics” such as demographics with “soft semantics” (values, lifestyle) extracted from the BERT model’s friendship declarations at a weighted ratio of 0.75:0.25. This architecture significantly improves the balance between “conditional matching” and “spiritual fit” in recommendation results.
- Structured identification and safe harbor strategies for long-tail marriage and dating groups: Through gender-based visual analysis, it accurately identifies the clustering characteristics of traditional “marginal groups” such as tall women and relatively shorter men on online platforms. Based on this, algorithms can design specialized “complementary matching” strategies, reflecting the platform’s social inclusiveness.
Management and Industry Insights:
- Data-driven decision-making and intelligent recommendation mechanisms can effectively improve organizational efficiency and service quality.
- Platform enterprises should pay attention to diverse user needs and design inclusive service strategies targeting marginalized and “vulnerable” user groups.
- The dynamic adjustment and personalized recommendation model embodies the modern enterprise’s philosophy of flexible management and continuous optimization. By continuously introducing feedback mechanisms and adjusting algorithm weights, it helps enterprises quickly respond to market changes and user feedback, achieving continuous innovation and competitive advantage.
Summary of Key Points:
- High-quality data is the cornerstone of model performance: from nearly 100,000 data entries, through three steps — “completeness screening, IQR anomaly rejection, and strategic filling” — a thousand high-quality data entries are ultimately accumulated, which is the prerequisite for subsequent analysis reliability.
- User profiling reveals structural contradictions and opportunities: the concentration of platform users’ “height mirrors” (tall women versus shorter men) and age misalignment are core business pain points algorithms must address.
- The dynamic weighting algorithm significantly enhances personalized matching: it simulates the differentiated partner preferences of different age and education groups, making the algorithm more like a “matchmaker who understands you” rather than a rigid conditional filter.
- Integrating software and hardware metrics is key to improving satisfaction: purely matching “hard conditions” is cold, while adding semantic understanding of “lifestyle” and “values” greatly improves the explainability of recommendations and user acceptance.
- Data-driven decision planning empowers the platform’s long-term development: The project’s analytics framework can be directly reused for user churn warnings, payment willingness prediction, and other business scenarios, driving the platform’s transformation from extensive operations to refined, intelligent management.
The author is an analyst in the field of data mining and algorithm design, with many years of experience in enterprise digital transformation consulting and academic research.
The supporting thesis modeling for this paper includes AI agents, complete code packages, and empirical analysis. You can add the assistant tecdat_cn to receive it, and we can provide full support throughout the process.
메타데이터
- post_id
- e2f0abe5ba55
- slug
- application-of-python-bert-and-sentence-transformers-multimodal-dynamic-weight-fusion-models-in-e2f0abe5ba55
- url
- https://medium.com/@570881451/application-of-python-bert-and-sentence-transformers-multimodal-dynamic-weight-fusion-models-in-e2f0abe5ba55
- canonical_url
- https://medium.com/@570881451/application-of-python-bert-and-sentence-transformers-multimodal-dynamic-weight-fusion-models-in-e2f0abe5ba55
- author_url
- https://medium.com/@570881451
- status
- ok
- fetched_at
- 2026-07-13 06:23:13