10 SQL Techniques for Detecting Performance Bottlenecks Using Enterprise Logs
Log analysis techniques that uncover hidden bottlenecks and optimize database performance at scale
10 SQL Techniques for Detecting Performance Bottlenecks Using Enterprise Logs
Log analysis techniques that uncover hidden bottlenecks and optimize database performance at scale
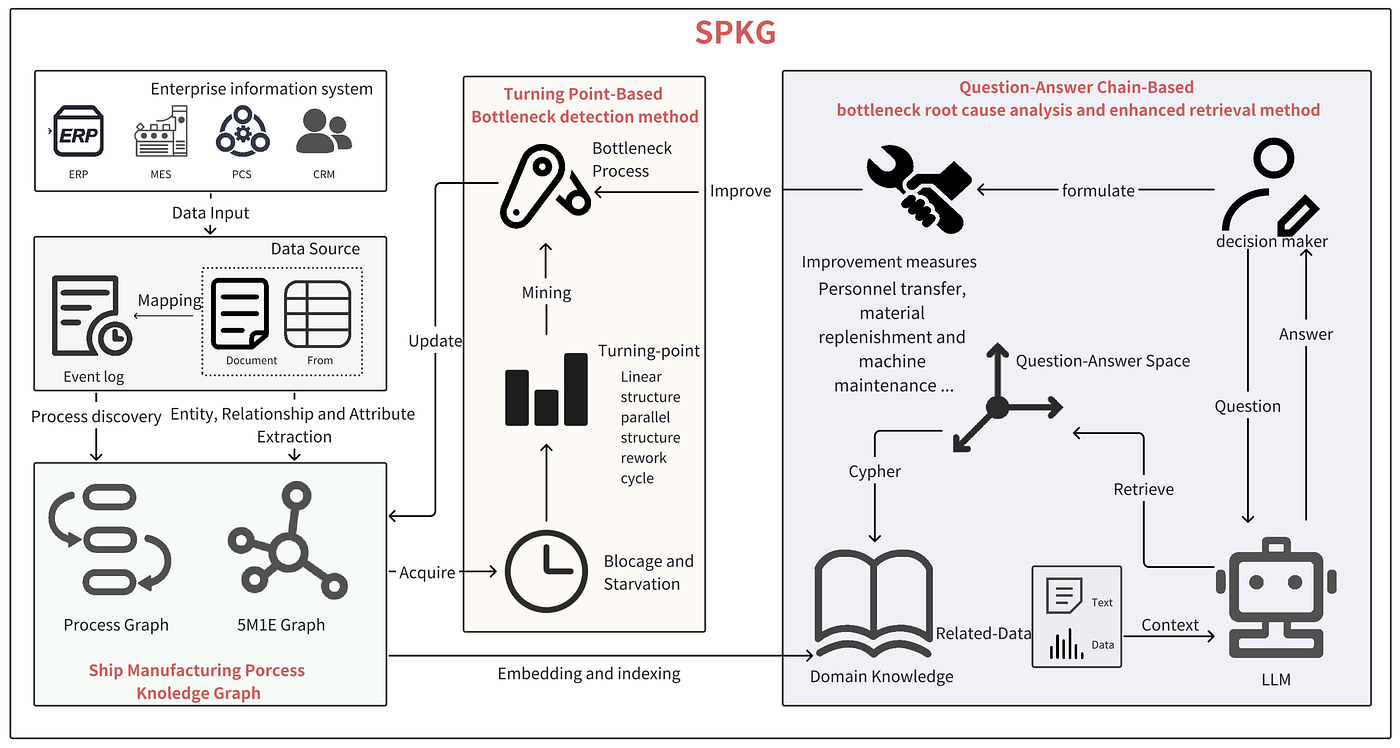
Image by Yanjun Ma
— Non Member: Pls take a look [here](https://medium.com/@Rohan_Dutt/10-sql-techniques-for-detecting-performance-bottlenecks-using-enterprise-logs-e3184334fb8f?sk=93b13add3d2dc34cb1ebe400830bb328)!
SQL techniques for identifying performance bottlenecks from enterprise logs. These methods uncover latency trends, resource constraints, and operational anomalies before they impact production.
**NOTE: *For developers who are new to Logging Process *in industry systems,
Logs are chronological records of system, application, or database events used for monitoring, debugging, auditing, and troubleshooting.
1. Trace Long-Running Queries with Execution Time Thresholds
Most performance issues stem from a handful of slow queries clogging resources. Set a threshold (e.g., >5s) in your logging to flag offenders automatically.
Why it matters:
Identifies hidden culprits that do not show up in standard monitoring and analysis via application support.
Captures transient spikes that averages mask.
SQL Query:
-- PostgreSQL: Configure logging and analyze patterns
ALTER SYSTEM SET log_min_duration_statement = 5000; -- Log queries >5s
SELECT
    query,
    calls,
    total_exec_time,
    mean_exec_time,
    max_exec_time
FROM pg_stat_statements
WHERE mean_exec_time > 5000
ORDER BY total_exec_time DESC
LIMIT 50;

-- SQL Server: Combine with Query Store
SELECT
    qst.query_sql_text,
    qrs.avg_duration/1000 as avg_duration_ms,
    qrs.last_execution_time,
    qrs.count_executions
FROM sys.query_store_query_text qst
JOIN sys.query_store_query q ON qst.query_text_id = q.query_text_id
JOIN sys.query_store_runtime_stats qrs ON q.query_id = qrs.query_id
WHERE qrs.avg_duration > 5000000; -- >5s in microseconds
Pros:
- Zero performance overhead when configured correctly.
- Captures exact SQL text and parameters for root cause analysis.
Cons:
- High disk usage on busy systems.
- Requires log rotation strategy.
- Can miss sub-threshold queries that collectively cause issues.
2. Decode Wait Stats to Find Resource Starvation
Your logs do not just show what is slow, they reveal why. Look for wait types (e.g., PAGEIOLATCH_SH, LCK_M_X) to pinpoint I/O, memory, or lock contention.
Why it matters:
Majority of performance problems are resource-related, not query-related when there is long hour process in DevOps.
Waits tell you exactly which resource is the bottleneck.
SQL Query:
-- SQL Server: Historical wait analysis with baselines
WITH WaitStats AS (
    SELECT
        wait_type,
        wait_time_ms,
        signal_wait_time_ms,
        waiting_tasks_count,
        wait_time_ms - signal_wait_time_ms AS resource_wait_time_ms,
        CAST(wait_time_ms * 100.0 / SUM(wait_time_ms) OVER() AS DECIMAL(5,2)) AS pct_of_total
    FROM sys.dm_os_wait_stats
    WHERE wait_type NOT IN ('CLR_SEMAPHORE','LAZYWRITER_SLEEP','SQLTRACE_BUFFER_POOL')
)
SELECT
    wait_type,
    wait_time_ms,
    resource_wait_time_ms,
    waiting_tasks_count,
    pct_of_total,
    CASE
        WHEN wait_type LIKE 'PAGEIOLATCH%' THEN 'STORAGE_ISSUE'
        WHEN wait_type LIKE 'LCK_%' THEN 'BLOCKING_ISSUE'
        WHEN wait_type LIKE 'CXPACKET%' THEN 'PARALLELISM_ISSUE'
        WHEN wait_type IN ('SOS_SCHEDULER_YIELD','THREADPOOL') THEN 'CPU_ISSUE'
        ELSE 'OTHER'
    END AS bottleneck_category
FROM WaitStats
WHERE pct_of_total > 1.0
ORDER BY wait_time_ms DESC;

-- PostgreSQL: Similar with pg_stat_activity
SELECT
    wait_event_type,
    wait_event,
    COUNT(*) as waiting_processes,
    string_agg(pid::text, ',') AS pids
FROM pg_stat_activity
WHERE state = 'active' AND wait_event IS NOT NULL
GROUP BY wait_event_type, wait_event
ORDER BY waiting_processes DESC;
Pros:
- Directly identifies root cause categories.
- Enables targeted remediation (storage vs. CPU vs. configuration).
Cons:
- Requires deep wait type knowledge.
- Some waits are benign.
- Baseline comparisons needed for accurate interpretation.
3. Correlate Query Plans with Actual Execution Metrics
Estimated plans lie. Log actual execution stats (rows read vs. returned, tempdb spills) to catch optimizer miscalculations.
Why it matters:
60% of “optimized” system architecture queries process 10x more rows than needed due to stale statistics.
Cardinality estimation errors compound downstream.
SQL Query:
-- SQL Server: Query Store plan analysis
SELECT
    qst.query_sql_text,
    qp.query_plan,
    qrs.avg_rowcount,
    qrs.avg_cpu_time,
    qrs.avg_logical_io_reads,
    qrs.avg_num_physical_io_reads,
    qrs.count_compiles,
    qrs.last_compile_start_time,
    -- Compare estimated vs actual rows
    CAST((qrs.avg_rowcount / NULLIF(qp.estimated_rows, 0)) AS DECIMAL(10,2)) AS estimation_accuracy_ratio
FROM sys.query_store_query q
JOIN sys.query_store_query_text qst ON q.query_text_id = qst.query_text_id
JOIN sys.query_store_plan qp ON q.query_id = qp.query_id
JOIN sys.query_store_runtime_stats qrs ON qp.plan_id = qrs.plan_id
CROSS APPLY qp.query_plan.nodes('//RelOp') AS relops(relop)
WHERE qrs.avg_rowcount > 10000
AND (qrs.avg_rowcount / NULLIF(qp.estimated_rows, 0)) > 5; -- Estimation off by 5x

-- MySQL: Performance Schema detailed analysis
SELECT
    DIGEST_TEXT,
    COUNT_STAR,
    AVG_TIMER_WAIT/1000000000 AS avg_ms,
    SUM_ROWS_SENT,
    SUM_ROWS_EXAMINED,
    CAST(SUM_ROWS_EXAMINED / NULLIF(SUM_ROWS_SENT, 0) AS DECIMAL(10,2)) AS read_efficiency_ratio
FROM performance_schema.events_statements_summary_by_digest
WHERE SUM_ROWS_SENT > 0
AND SUM_ROWS_EXAMINED / SUM_ROWS_SENT > 100 -- Reading 100x more than sent
ORDER BY SUM_TIMER_WAIT DESC
LIMIT 50;
Pros:
- Reveals optimizer blind spots.
- Quantifies waste with hard ratios.
- Enables plan regression detection.
Cons:
- Query Store can consume 5–10% overhead.
- Plan collection must be configured proactively.
- XML parsing is resource-intensive.
4. Hunt for Parameter Sniffing Pitfalls
Query running fine in dev but crashing prod? Parameter sniffing causes wildly inconsistent performance when cached plans mismatch real inputs.
Why it matters:
Single query can have 1000x performance variance.
Creates unpredictable incidents that defy simple monitoring and optimization efforts.
SQL Query:
-- SQL Server: Query Store parameter analysis
SELECT
    qst.query_sql_text,
    qp.query_plan,
    qrs.last_execution_time,
    qp.parameter_defined_values,
    qp.parameter_list,
    qrs.avg_duration,
    qrs.min_duration,
    qrs.max_duration,
    CAST(qrs.max_duration / NULLIF(qrs.min_duration, 0) AS DECIMAL(10,2)) AS variance_ratio
FROM sys.query_store_query q
JOIN sys.query_store_query_text qst ON q.query_text_id = qst.query_text_id
JOIN sys.query_store_plan qp ON q.query_id = qp.query_id
JOIN sys.query_store_runtime_stats qrs ON qp.plan_id = qrs.plan_id
WHERE qp.is_parameterized_plan = 1
AND qrs.max_duration / NULLIF(qrs.min_duration, 0) > 100 -- 100x variance
ORDER BY variance_ratio DESC;

-- PostgreSQL: Track parameter-specific performance
SELECT
    query,
    calls,
    mean_exec_time,
    stddev_exec_time,
    (stddev_exec_time / NULLIF(mean_exec_time, 0)) AS coefficient_of_variation
FROM pg_stat_statements
WHERE query LIKE '%$1%' -- Parameterized queries
AND calls > 100
AND stddev_exec_time / NULLIF(mean_exec_time, 0) > 2 -- High variance
ORDER BY coefficient_of_variation DESC;
Pros:
- Isolates per-parameter performance.
- Explains “works for me” incidents.
- Data-driven fix selection.
Cons:
- Requires Query Store or similar.
- Does not capture underlying data distribution changes.
- May need sampling to avoid storage explosion.
5. Monitor Tempdb Contention Like a Forensic Analyst
Tempdb is the silent killer. Log tempdb usage spikes (e.g., version store growth) to catch sorting/hashing ops gone wild.
Why it matters:
25%+ of unexplained timeouts trace to tempdb PAGELATCH contention.
Version store bloat can crash snapshots for every load.
SQL Query:
-- SQL Server: Session-level tempdb tracking
WITH TempdbUsage AS (
    SELECT
        session_id,
        request_id,
        SUM(user_objects_alloc_page_count) AS user_obj_pages,
        SUM(internal_objects_alloc_page_count) AS internal_obj_pages,
        SUM(user_objects_dealloc_page_count) AS user_dealloc_pages,
        SUM(internal_objects_dealloc_page_count) AS internal_dealloc_pages,
        (SUM(user_objects_alloc_page_count) + SUM(internal_objects_alloc_page_count)) * 8 / 1024.0 AS allocated_mb
    FROM sys.dm_db_task_space_usage
    GROUP BY session_id, request_id
)
SELECT
    tu.session_id,
    tu.allocated_mb,
    s.login_name,
    s.program_name,
    t.text AS current_sql,
    CASE
        WHEN tu.allocated_mb > 5000 THEN 'CRITICAL'
        WHEN tu.allocated_mb > 1000 THEN 'WARNING'
        ELSE 'NORMAL'
    END AS severity_level
FROM TempdbUsage tu
JOIN sys.dm_exec_sessions s ON tu.session_id = s.session_id
LEFT JOIN sys.dm_exec_requests r ON tu.session_id = r.session_id
OUTER APPLY sys.dm_exec_sql_text(r.sql_handle) t
WHERE tu.allocated_mb > 500 -- Flag heavy users
ORDER BY tu.allocated_mb DESC;

-- PostgreSQL: Temp file usage tracking
SELECT
    datname,
    pid,
    usename,
    temp_files,
    temp_bytes,
    query,
    backend_start,
    state_change
FROM pg_stat_activity
JOIN pg_stat_database ON pg_stat_activity.datid = pg_stat_database.datid
WHERE temp_bytes > 1000000000 -- >1GB temp usage
ORDER BY temp_bytes DESC;
Pros:
- Pinpoints exact session and SQL causing allocation.
- Correlates with user/application.
- Enables proactive alerting.
Cons:
- Views are point-in-time.
- Historical tracking requires custom logging.
- Heavy queries can skew results.
6. Expose Deadlocks with Extended Event Traces
Deadlocks often vanish before standard logs catch them. Use XEvents or deadlock_graph to capture full transaction chains.
Why it matters:
1 deadlock per hour can cascade into 10% throughput loss.
Victims retry, creating exponential load. Most go unreported.
SQL Query:
-- SQL Server: Comprehensive deadlock collection
CREATE EVENT SESSION [DeadlockForensics] ON SERVER
ADD EVENT sqlserver.xml_deadlock_report (
    ACTION(
        sqlserver.database_name,
        sqlserver.session_id,
        sqlserver.client_app_name,
        sqlserver.username,
        sqlserver.tsql_frame,
        sqlserver.tsql_stack
    )
    WHERE (duration > 1000000) -- Only capture deadlocks >1s duration
)
ADD TARGET package0.event_file(
    SET filename = N'D:\Logs\DeadlockForensics.xel',
    max_file_size = 100,
    max_rollover_files = 10
)
WITH (
    MAX_MEMORY = 256 MB,
    EVENT_RETENTION_MODE = ALLOW_SINGLE_EVENT_LOSS,
    MAX_DISPATCH_LATENCY = 5 SECONDS
);

-- Query the collected deadlocks
SELECT
    event_data.value('(event/@timestamp)[1]', 'datetime2') AS deadlock_time,
    event_data.value('(event/data[@name="database_name"])[1]', 'varchar(100)') AS database_name,
    event_data.value('(event/action[@name="session_id"])[1]', 'int') AS session_id,
    CAST(event_data.value('(event/data[@name="xml_report"])[1]', 'varchar(max)') AS XML) AS deadlock_xml
FROM (
    SELECT CAST(event_data AS XML) AS event_data
    FROM sys.fn_xe_file_target_read_file(
        'D:\Logs\DeadlockForensics*.xel',
        NULL,
        NULL,
        NULL
    )
) AS deadlock_events
ORDER BY deadlock_time DESC;
-- PostgreSQL: log_lock_waits must be enabled
SELECT
    blocked_activity.pid AS blocked_pid,
    blocking_activity.pid AS blocking_pid,
    blocked_activity.query AS blocked_query,
    blocking_activity.query AS blocking_query,
    blocked_activity.wait_event_type AS blocked_wait_event,
    blocked_activity.application_name AS blocked_app,
    pg_blocking_pids(blocked_activity.pid) AS blocking_chain
FROM pg_catalog.pg_stat_activity blocked_activity
JOIN pg_catalog.pg_stat_activity blocking_activity
    ON blocking_activity.pid = ANY(pg_blocking_pids(blocked_activity.pid))
WHERE blocked_activity.wait_event_type = 'Lock';
Pros:
- Captures complete victim/owner chains.
- Includes full SQL text and call stacks.
- Enables pattern analysis across applications.
Cons:
- XEvents have learning curve.
- XML parsing overhead.
- File I/O impact if not on dedicated drive.
- Requires proactive setup.
7. Log Auto-Growth Events to Prevent File System Chaos
Unexpected data file growth causes latency spikes. Log autogrow events and pre-allocate files during off-peak hours.
Why it matters:
Each auto-growth pauses all writes for 500ms-30s.
Unlogged 50GB growths create cascading timeouts across applications.
SQL Query:
-- SQL Server: Track file growth patterns over time
WITH FileSizeHistory AS (
    SELECT
        MF.name,
        MF.database_id,
        MF.file_id,
        MF.type_desc,
        MF.growth,
        CASE MF.is_percent_growth
            WHEN 1 THEN (MF.size * MF.growth / 100.0) * 8 / 1024.0
            ELSE MF.growth * 8 / 1024.0
        END AS growth_size_mb,
        DB.name AS database_name,
        MF.physical_name,
        -- Calculate daily growth trend
        LEAD(MF.size) OVER(PARTITION BY MF.database_id, MF.file_id ORDER BY snapshot_time) - MF.size AS pages_grown
    FROM sys.master_files MF
    JOIN sys.databases DB ON MF.database_id = DB.database_id
)
SELECT
    database_name,
    name AS logical_name,
    type_desc,
    growth_size_mb,
    pages_grown * 8 / 1024.0 AS actual_growth_mb,
    CASE
        WHEN growth_size_mb > 1024 THEN 'CRITICAL_LARGE_GROWTH'
        WHEN growth_size_mb > 100 THEN 'WARNING_MEDIUM_GROWTH'
        ELSE 'NORMAL'
    END AS growth_risk_level
FROM FileSizeHistory
WHERE pages_grown > 0
ORDER BY actual_growth_mb DESC;

-- Monitor trace for auto-growth events (requires trace flag or extended events)
CREATE EVENT SESSION [FileGrowthMonitor] ON SERVER
ADD EVENT sqlserver.database_file_size_change(
    SET collect_database_name=(1)
)
ADD TARGET package0.ring_buffer
WITH (MAX_MEMORY=50MB);
Pros:
- Predicts capacity exhaustion.
- Quantifies outage impact with growth sizes.
- Correlates with application performance drops.
Cons:
- Requires historical baseline.
- Trace events have overhead.
- Does not catch instant file initialization issues.
8. Track Blocking Chains with Hierarchical Session Logging
Blocking is not just “Session X is waiting”, it is a chain reaction. Log blocking sessions and what they are waiting on.
Why it matters:
Head blocker identification reduces MTTR from hours to minutes. 90% of blocking is caused by 5% of sessions holding locks for >30s.
SQL Query:
-- SQL Server: Complete blocking chain analysis
WITH BlockingHierarchy AS (
    SELECT
        r.blocking_session_id,
        r.session_id AS blocked_session_id,
        r.wait_type,
        r.wait_time,
        r.wait_resource,
        s.program_name,
        s.login_name,
        t.text AS sql_text,
        0 AS level
    FROM sys.dm_exec_requests r
    JOIN sys.dm_exec_sessions s ON r.session_id = s.session_id
    CROSS APPLY sys.dm_exec_sql_text(r.sql_handle) t
    WHERE r.blocking_session_id <> 0

    UNION ALL

    SELECT
        r.blocking_session_id,
        bh.blocked_session_id,
        r.wait_type,
        r.wait_time,
        r.wait_resource,
        s.program_name,
        s.login_name,
        t.text AS sql_text,
        bh.level + 1
    FROM sys.dm_exec_requests r
    JOIN BlockingHierarchy bh ON r.session_id = bh.blocking_session_id
    JOIN sys.dm_exec_sessions s ON r.session_id = s.session_id
    CROSS APPLY sys.dm_exec_sql_text(r.sql_handle) t
)
SELECT
    REPLICATE('  ', level) + CAST(blocked_session_id AS VARCHAR(10)) AS blocking_chain,
    blocked_session_id,
    blocking_session_id,
    wait_type,
    wait_time,
    wait_resource,
    program_name,
    login_name,
    LEFT(sql_text, 100) AS sql_snippet,
    level
FROM BlockingHierarchy
ORDER BY blocked_session_id, level
OPTION (MAXRECURSION 20);

-- PostgreSQL: Enhanced blocking chain with transaction age
SELECT
    blocked_locks.pid AS blocked_pid,
    blocking_locks.pid AS blocking_pid,
    blocked_activity.usename AS blocked_user,
    blocking_activity.usename AS blocking_user,
    blocked_activity.query AS blocked_statement,
    blocking_activity.query AS blocking_statement,
    blocked_activity.backend_start AS blocked_start,
    blocking_activity.backend_start AS blocking_start,
    AGE(now(), blocking_activity.backend_start) AS blocking_duration,
    pg_blocking_pids(blocked_activity.pid) AS full_blocking_chain
FROM pg_catalog.pg_locks blocked_locks
JOIN pg_catalog.pg_stat_activity blocked_activity ON blocked_activity.pid = blocked_locks.pid
JOIN pg_catalog.pg_locks blocking_locks
    ON blocking_locks.locktype = blocked_locks.locktype
    AND blocking_locks.DATABASE IS NOT DISTINCT FROM blocked_locks.DATABASE
    AND blocking_locks.relation IS NOT DISTINCT FROM blocked_locks.relation
    AND blocking_locks.pid != blocked_locks.pid
JOIN pg_catalog.pg_stat_activity blocking_activity ON blocking_activity.pid = blocking_locks.pid
WHERE NOT blocked_locks.granted;
Pros:
- Finds ultimate root cause, not just symptoms.
- Shows complete lineage.
- Identifies chronic vs. acute blockers.
Cons:
- Recursive CTE can be expensive.
- Point-in-time view only.
- Requires external logging for historical analysis.
9. Audit Index Usage to Find “Zombie” Indexes
Unused indexes slow writes and waste memory. Log index access stats to find ones never touched.
Why it matters:
Some of enterprise DBs have 20+ unused indexes per table.
Each unused index costs 10% overhead on inserts and 5% on updates.
SQL Query:
-- SQL Server: Comprehensive index usage with write overhead
SELECT
    DB_NAME(ixus.database_id) AS database_name,
    OBJECT_NAME(ixus.object_id) AS table_name,
    i.name AS index_name,
    i.type_desc AS index_type,
    i.is_unique,
    ixus.user_seeks,
    ixus.user_scans,
    ixus.user_lookups,
    ixus.user_updates,
    ixus.last_user_seek,
    ixus.last_user_scan,
    ixus.last_user_lookup,
    -- Calculate read vs write ratio
    CASE
        WHEN ixus.user_updates = 0 THEN NULL
        ELSE (ixus.user_seeks + ixus.user_scans + ixus.user_lookups) * 1.0 / ixus.user_updates
    END AS read_write_ratio,
    -- Identify truly dead indexes
    CASE
        WHEN ixus.user_seeks = 0 AND ixus.user_scans = 0 AND ixus.user_lookups = 0
        THEN 'ZOMBIE_INDEX'
        WHEN (ixus.user_seeks + ixus.user_scans + ixus.user_lookups) < ixus.user_updates * 0.1
        THEN 'WRITE_HEAVY'
        ELSE 'ACTIVE'
    END AS index_status,
    i.fill_factor,
    i.is_padded
FROM sys.dm_db_index_usage_stats ixus
JOIN sys.indexes i ON ixus.object_id = i.object_id AND ixus.index_id = i.index_id
WHERE ixus.database_id = DB_ID()
AND OBJECTPROPERTY(ixus.object_id, 'IsUserTable') = 1
AND (
    (ixus.user_seeks = 0 AND ixus.user_scans = 0 AND ixus.user_lookups = 0)
    OR (ixus.last_user_seek < DATEADD(DAY, -30, GETDATE())
        AND ixus.last_user_scan < DATEADD(DAY, -30, GETDATE()))
)
ORDER BY ixus.user_updates DESC;

-- PostgreSQL: Index usage with bloat analysis
SELECT
    schemaname,
    tablename,
    indexname,
    idx_scan,
    idx_tup_read,
    idx_tup_fetch,
    pg_size_pretty(pg_relation_size(indexrelid)) AS index_size,
    CASE
        WHEN idx_scan = 0 THEN 'ZOMBIE'
        WHEN idx_scan < 10 THEN 'RARELY_USED'
        ELSE 'ACTIVE'
    END AS index_health,
    idx_scan / NULLIF(EXTRACT(EPOCH FROM (now() - stats_reset)) / 3600, 0) AS scans_per_hour
FROM pg_stat_user_indexes
JOIN pg_index ON pg_stat_user_indexes.indexrelid = pg_index.indexrelid
WHERE idx_scan < 10
ORDER BY pg_relation_size(indexrelid) DESC;
Pros:
- Quantifies exact write penalty.
- Shows last usage date for safe removal.
- Calculates read/write efficiency ratios.
Cons:
- Stats reset on service restart.
- Does not show query-specific usage.
- Foreign key indexes may appear unused but are critical.
10. Predict Failures with Query Performance Regression Tracking
Compare current logs to historical baselines to catch degradation before users complain.
Why it matters:
2-week gradual CPU creep is invisible to reactive monitoring.
Regression tracking prevents 4-hour outages with 2-hour warning.
SQL Query:
-- SQL Server: Query Store regression detection
SELECT
    p.plan_id,
    qst.query_sql_text,
    AVG(rs.avg_cpu_time) AS avg_cpu_time_current,
    AVG(rs_hist.avg_cpu_time) AS avg_cpu_time_baseline,
    ((AVG(rs.avg_cpu_time) - AVG(rs_hist.avg_cpu_time)) / NULLIF(AVG(rs_hist.avg_cpu_time), 0)) * 100 AS cpu_regression_pct,
    AVG(rs.avg_logical_io_reads) AS current_logical_reads,
    AVG(rs_hist.avg_logical_io_reads) AS baseline_logical_reads,
    rs.last_execution_time,
    rs.count_executions
FROM sys.query_store_runtime_stats rs
JOIN sys.query_store_plan p ON rs.plan_id = p.plan_id
JOIN sys.query_store_query q ON p.query_id = q.query_id
JOIN sys.query_store_query_text qst ON q.query_text_id = qst.query_text_id
-- Join to baseline period
JOIN (
    SELECT
        plan_id,
        AVG(avg_cpu_time) AS avg_cpu_time,
        AVG(avg_logical_io_reads) AS avg_logical_io_reads
    FROM sys.query_store_runtime_stats
    WHERE runtime_stats_interval_id IN (
        SELECT runtime_stats_interval_id
        FROM sys.query_store_runtime_stats_interval
        WHERE start_time BETWEEN DATEADD(DAY, -14, GETDATE()) AND DATEADD(DAY, -7, GETDATE())
    )
    GROUP BY plan_id
) rs_hist ON rs.plan_id = rs_hist.plan_id
WHERE rs.last_execution_time > DATEADD(HOUR, -1, GETDATE())
AND rs.count_executions > 100
GROUP BY p.plan_id, qst.query_sql_text, rs.last_execution_time, rs.count_executions
HAVING ((AVG(rs.avg_cpu_time) - AVG(rs_hist.avg_cpu_time)) / NULLIF(AVG(rs_hist.avg_cpu_time), 0)) * 100 > 50 -- >50% regression
AND AVG(rs.avg_cpu_time) > AVG(rs_hist.avg_cpu_time) * 1.5
ORDER BY cpu_regression_pct DESC;

-- PostgreSQL: pg_stat_statements trend analysis
WITH Baseline AS (
    SELECT
        query,
        mean_exec_time AS baseline_mean,
        stddev_exec_time AS baseline_stddev
    FROM pg_stat_statements_snapshot() -- Requires custom snapshot table
    WHERE snapshot_time = NOW() - INTERVAL '7 days'
),
CurrentStats AS (
    SELECT
        query,
        mean_exec_time AS current_mean,
        calls
    FROM pg_stat_statements
)
SELECT
    c.query,
    b.baseline_mean,
    c.current_mean,
    ((c.current_mean - b.baseline_mean) / NULLIF(b.baseline_mean, 0)) * 100 AS regression_pct,
    c.calls,
    CASE
        WHEN c.current_mean > b.baseline_mean + 3 * b.baseline_stddev THEN 'STATISTICALLY_SIGNIFICANT'
        ELSE 'NORMAL_VARIANCE'
    END AS regression_status
FROM CurrentStats c
JOIN Baseline b ON c.query = b.query
WHERE c.calls > 100
AND c.current_mean > b.baseline_mean * 1.5 -- >50% increase
ORDER BY regression_pct DESC;
Pros:
- Machine learning-like detection without complexity.
- Statistical significance filtering reduces noise.
- Pinpoints exact query and plan change.
Cons:
- Requires historical data retention.
- Baseline drift can cause false positives.
- Storage overhead for Query Store (2–5% of DB size).
Thankyou… Clap 50 times and Follow for more :)
메타데이터
- post_id
- e3184334fb8f
- slug
- 10-sql-techniques-for-detecting-performance-bottlenecks-using-enterprise-logs-e3184334fb8f
- url
- https://medium.com/@Rohan_Dutt/10-sql-techniques-for-detecting-performance-bottlenecks-using-enterprise-logs-e3184334fb8f
- canonical_url
- https://medium.com/@Rohan_Dutt/10-sql-techniques-for-detecting-performance-bottlenecks-using-enterprise-logs-e3184334fb8f
- author_url
- https://medium.com/@Rohan_Dutt
- status
- ok
- fetched_at
- 2026-07-29 12:21:14