Fix Flaky Jest Tests in CI with maxWorkers (and why it works)
When I was a kid, I spent a lot of time across the street at my grandparents’ house. I remember my grandfather picking apples from the tree…
Fix Flaky Jest Tests in CI with maxWorkers (and why it works)
When I was a kid, I spent a lot of time across the street at my grandparents’ house. I remember my grandfather picking apples from the tree and slicing them up for me with his pocket knife, or showing me how the tools in his workshop worked (although I didn’t grow up to become particularly handy). There were also quieter, more mundane moments: watching him pour Frosted Flakes into a bowl at breakfast, singing along with Tony the Tiger during basketball game commercials. Those little routines stuck with me. I kept a fondness for Frosted Flakes.
But not all flakes are charming. In fact, I find one kind of flake to be quite sinister: flaky tests. These are automated tests that can either pass and fail on subsequent test runs, even when nothing in the code has changed. In React Native, we usually think of flaky tests as a problem to solve in end-to-end suites with Detox or Maestro. Running emulators and simulators in the cloud introduce variability and make it hard to run fully deterministic test cases.
Unfortunately, Jest unit tests can be flaky as well. And those kinds of flakes are even more frustrating to me. Jest tests only run in Node and eliminate a swath of indeterminate factors. They’re supposed to be fast, simple, and extremely reliable. How can these simple tests flake out on us?
After a frustrating two weeks wrestling with this myself, I’ve found a common culprit: Jest’s default parallelization aggressively consumes machine resources. When your test runner grabs as much memory as possible, it can cause nondeterministic slowdowns. Under these conditions, tests with timeout-based assertions may begin to exhibit flaky behavior.
TL;DR: to possibly fix flaky Jest tests in CI/CD, add:
--maxWorkers='50%'to your Jest command to reduce memory pressure, and speed up your tests, even as it spawns fewer parallel workers.
When parallelization goes wrong
We often consider parallelization an easy performance win. In theory, if you isolate your test files, they can be run at the same time as one another in parallel processes. Splitting the workload usually means you can reduce your overall test runtime. That’s true when your test suite is small, medium-sized, or if you have ample resources on the machine running the tests. But Jest runners seem to use as much memory as they can. So the more workers you spawn, the more memory they’ll allocate. And if your machine starts to run out of available memory, the operating system will attempt to reclaim memory. It will either drop RAM pages into swap memory, or if it has no swap memory, it will have to thrash and reallocate pages. These actions will slow down your process, and a slowdown in performance might result in test failures, but not always.
And there you have it: flaky tests.
Imagine you’ve got some component like this:
import { useEffect, useState } from "react"
import { View } from "react-native"

import { Text } from "./Text"

export function DelayedContent() {
  const [showContent, setShowContent] = useState(false)

  useEffect(() => {
    const timer = setTimeout(() => {
      setShowContent(true)
    }, 4000) // 4 second delay
    return () => clearTimeout(timer)
  }, [])

  return (
    <View>
      <Text>Loading...</Text>
      {showContent && <Text>Content loaded!</Text>}
    </View>
  )
}
With a test like:
import { render } from "@testing-library/react-native"

import { DelayedContent } from "./DelayedContent"
import { ThemeProvider } from "../theme/context"

describe("DelayedContent", () => {
  it("should show content after delay", async () => {
    const { findByText } = render(
      <ThemeProvider>
        <DelayedContent />
      </ThemeProvider>,
    )

    // Component shows "Content loaded!" after 4 seconds
    // findByText default timeout is 5 seconds (1 second margin)
    // Under memory pressure, the timer + React updates take longer
    // causing this to timeout and fail
    const content = await findByText("Content loaded!", {}, { timeout: 5000 })
    expect(content).toBeDefined()
  })
})
This is a contrived example to illustrate the point. DelayedContentshows a Content Loaded!string after 4 seconds. But in JavaScript, setTimeout only sets a minimum amount of time before running a function, not a guaranteed amount of time. So if your JavaScript process slows down, and setTimeout takes longer than your test assertion timeout, your test will fail, like this:
FAIL app/components/DelayedContent.test.tsx (31.954 s, 87 MB heap size)
  DelayedContent
    ✕ should show content after delay (5059 ms)

  ● DelayedContent › should show content after delay

    thrown: "Exceeded timeout of 5000 ms for a test.
    Add a timeout value to this test to increase the timeout, if this is a long-running test. See https://jestjs.io/docs/api#testname-fn-timeout."
Moreover, the test will only fail in this mode if the underlying system conditions cause it to. Those conditions are non-deterministic. So you’ll see these failures intermittently. There’s your flake.
As mentioned before — we can work around these failure conditions by enforcing a maximum worker limit for Jest, and preventing the operating system from slowing down while low memory gets managed. The — maxWorkersflag helps us here, and if you set it to --maxWorkers='50%’, it will force Jest to use half as many workers as there are CPU cores on the system.
The solution: we’ve seen this before
This is a known issue and workaround with Jest. Others have written about it:
- Ivan Tanev wrote about it for Dev.to in 2021
- Vikram Gupta wrote about it for Adobe in 2022
- And you’ll see people on GitHub issues mentioning this flag as a fix for poorly performing tests
Digging Deeper
Ok, so we know the “one weird trick to fix Jest flakes in CI/CD”, but a magic setting is not a satisfactory answer to me. I wanted to understand the behavior more thoroughly. After running into these kinds of flakes and implementing this setting on my client project, I still had questions:
- Can I reliably reproduce this scenario to prove that more workers result in flakier tests?
- What’s actually happening in the operating system in these conditions? Can we measure it?
- What happens in machines with no swap memory? In these scenarios, I haven’t observed out of memory errors, but I have observed flakes. Why don’t they just run out of memory?
Overall, I wanted to make sure the solution to these flakes was fully verifiable, so I could make a recommendation to the client, understand why the changes were necessary, and enable the team to tweak the setting in the future if needed.
Experimenting with Jest memory consumption
We can use Docker to run experiments and directly observe the memory pressure in a reproducible system that mirrors typical CI runners. I designed an example project, based off Ignite. Ignite includes a sample test suite built with Jest and React Native Testing Library — a fairly common set up for React Native and Expo applications. I added our theoretical component: DelayedContent, which again looks like this:
import { useEffect, useState } from "react"
import { View } from "react-native"

import { Text } from "./Text"

export function DelayedContent() {
  const [showContent, setShowContent] = useState(false)

  useEffect(() => {
    const timer = setTimeout(() => {
      setShowContent(true)
    }, 4000) // 4 second delay
    return () => clearTimeout(timer)
  }, [])

  return (
    <View>
      <Text>Loading...</Text>
      {showContent && <Text>Content loaded!</Text>}
    </View>
  )
}
And its corresponding test:
import { render } from "@testing-library/react-native"

import { DelayedContent } from "./DelayedContent"
import { ThemeProvider } from "../theme/context"

describe("DelayedContent", () => {
  it("should show content after delay", async () => {
    const { findByText } = render(
      <ThemeProvider>
        <DelayedContent />
      </ThemeProvider>,
    )

    // Component shows "Content loaded!" after 4 seconds
    // findByText default timeout is 5 seconds (1 second margin)
    // Under memory pressure, the timer + React updates take longer
    // causing this to timeout and fail
    const content = await findByText("Content loaded!", {}, { timeout: 5000 })
    expect(content).toBeDefined()
  })
})
I also created a Dockerfile that creates an Alpine-based Node image, and pulls in some scripts to run the Jest suite under different conditions, and inspect the system memory behavior. In the rest of this article, I’ll walk you through my experimentation and results that get into the nitty gritty for how Jest impacts system memory usage, and what that means for test stability.
Spin up the sample project
Here’s how it works. Pull down the repository and install dependencies:
yarnAnd then build the docker image with:
yarn docker:buildThis will pull down the node:24-alpine image, copy the working directory into the container, and then set up commands to run the test and monitor memory usage in the background.
Baseline: just run the tests
As a baseline, we can just run the Jest command in the Docker container. If you run:
yarn docker:testThe script will:
- Set up a control group (or cgroup) for us to control the resources allocated to the test command.
- Set up the command to run, just
yarn test, which callsjestwith— verboseand— logHeapUsageflags so we can compare timing information and see memory usage for our test files. - Configure the cgroup with no memory constraints.
- Start the
scripts/monitor-memory.shscript in the background, which polls statistics about memory usage on the memory.stat file for the cgroup, this file breaks down the memory footprint on the cgroup along many different statistics. - Finally, it will run the Jest command we set up earlier in the script.
While Jest runs, our scripts/monitor-memory.sh scrip will poll for this information:
- Total number of page faults. These are fairly routine memory bookkeeping. A page fault indicates some overhead, but not major slowdowns.
- Total major page faults. These usually indicate the OS had to read a page from swap memory. Major page faults are likely to cause slowdowns.
- Page scans,,) which can be indicative of overall memory usage. Page scans tend to go up when a system is attempting to reclaim memory.
- Page steal, which gives us a count of how many pages in memory were reclaimed by the system — an indicator of thrashing.
Here’s what we see when we run the Jest test suite with default settings:
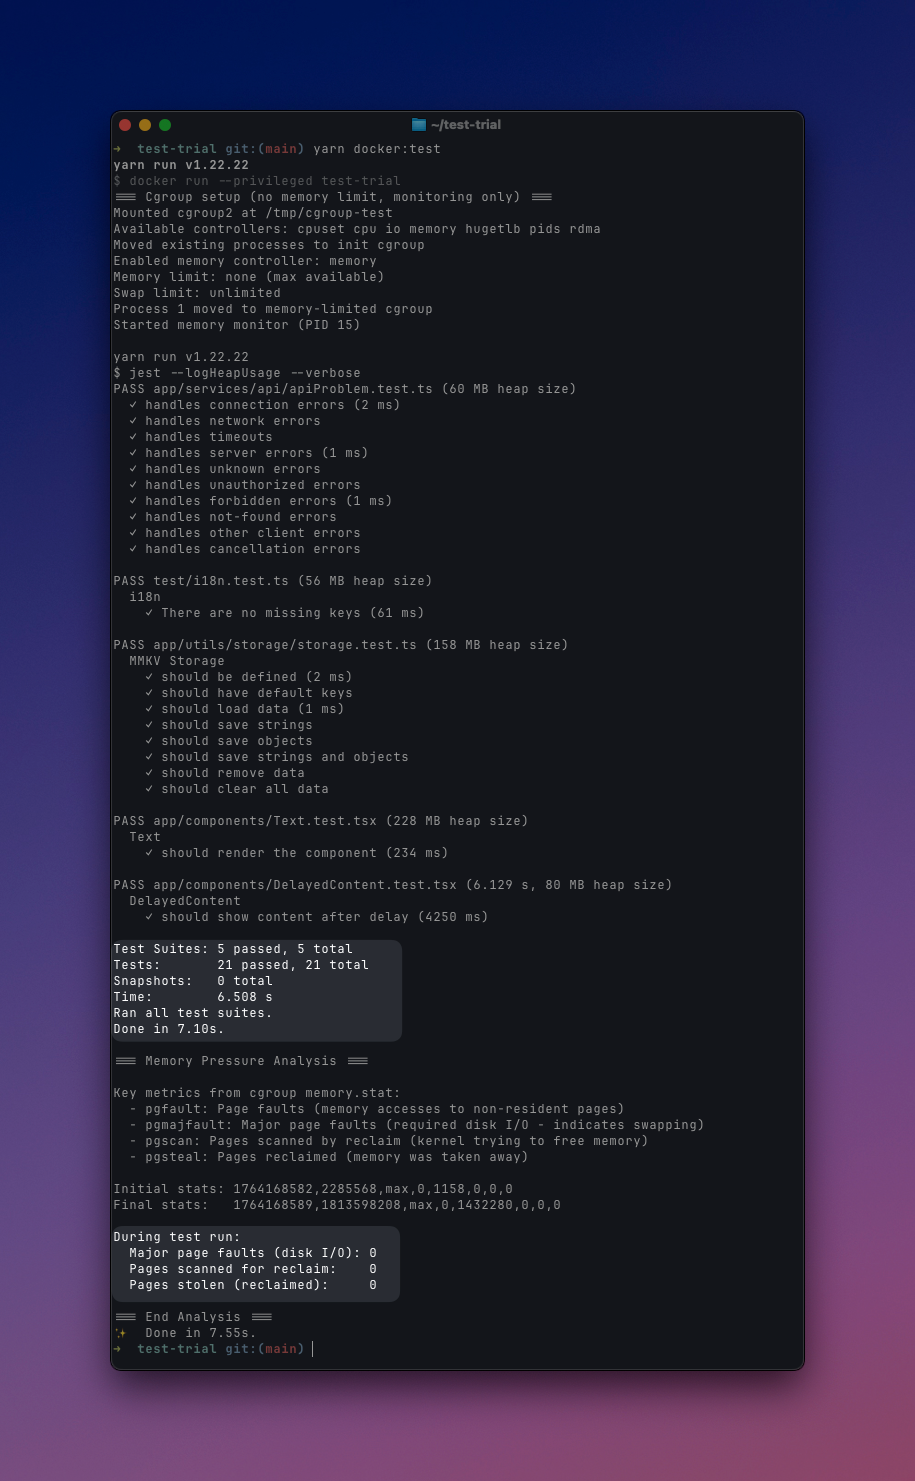
Under normal conditions, our tests run in about 8 seconds, and don’t log any signs of memory pressure.
Run tests in a memory constrained environment
We can apply a memory limit to our control group with the MEMORY_LIMIT_MBflag. There’s a convenience script that will set a limit of 200MB, which is roughly in the middle of our test files’ memory usage from the prior run. Jest will run as many workers as it can, and the cgroup will quickly run out of available memory for those workers. We should expect to see slower tests and more signs of memory pressure in memory.stat .
Running this will set those flags:
yarn:docker:test:constrainedAnd give an output like this:
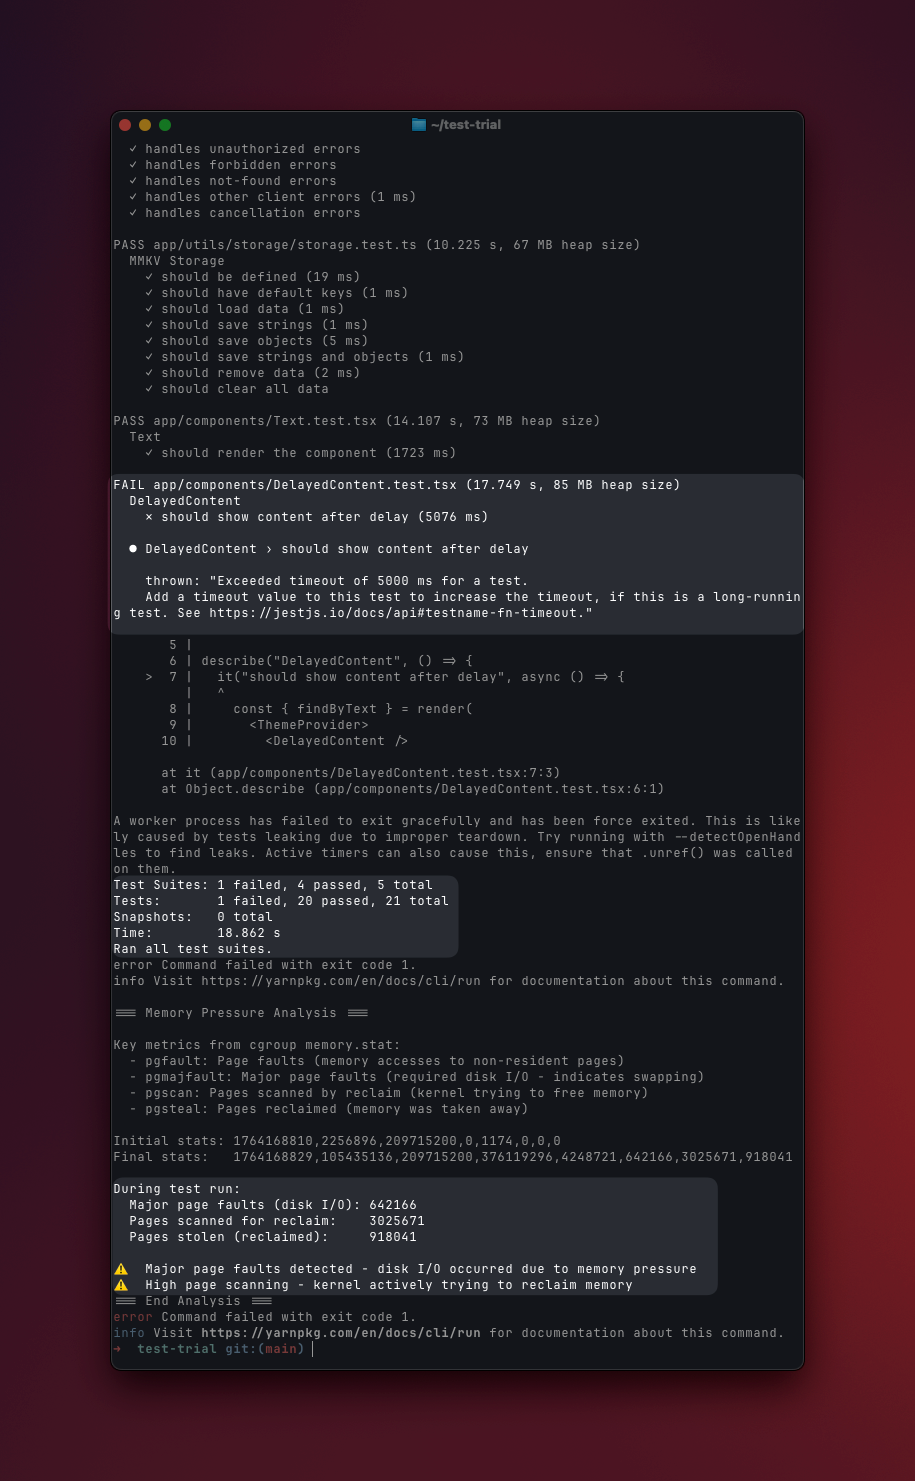
You’ll notice our tests take almost three times as long to run, and we experienced a timeout error in the DelayedContent component test. We also have evidence of memory pressure coming from memory.stat. This is evidence of our original hypothesis: Jest performance degrades in memory constrained environments, and may cause timeout errors for some tests.
Fix memory pressure with maxWorkers
Now let’s see if we can observe how — maxWorkers changes the state of things. Again, we have a convenience script to run with — maxWorkers=2, along with the same 200MB memory limit:
yarn docker:test:constrained:workersWhich gives me:
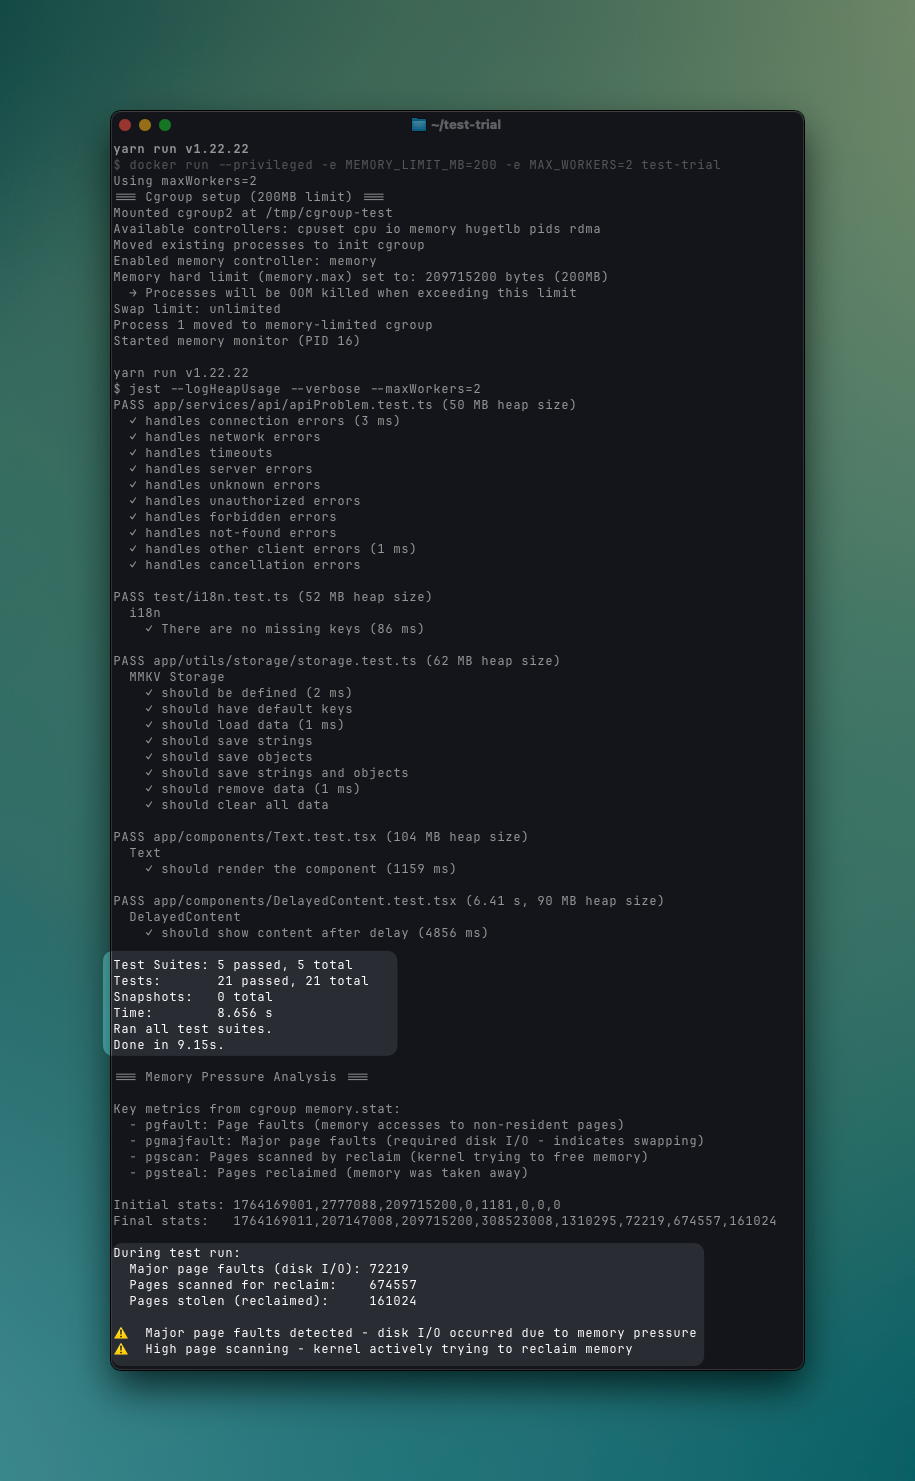
The tests are running closer to our original run time, and they seem more likely to pass. We do see some memory pressure, but we have an order of magnitude fewer page faults.
If you run this yourself, you may still experience timeout failures from time to time. In my own experimentation, I found it to be more reliable than the prior command. Try adjusting the maxWorkers or memory limits, and you’ll quickly get a feel for how these variables interact with the results. Overall, maxWorkerscan be effective at preventing memory pressure issues, but it’s a balancing act. The right value depends on your available system resources and the memory consumption of your test suite.
Running tests with no swap memory
Ok, so at this point we have a compelling case that major page faults (reading from swap memory) will slow down a Jest test suite and cause flaky timeout failures. But what about CI machines that have no swap? In my experience, CI machines with no allocated swap experience flaky timeouts as well, and not any kind of out-of-memory error. So there must be some other way that systems slow down in these scenarios.
We can model that question in our experimental repository with:
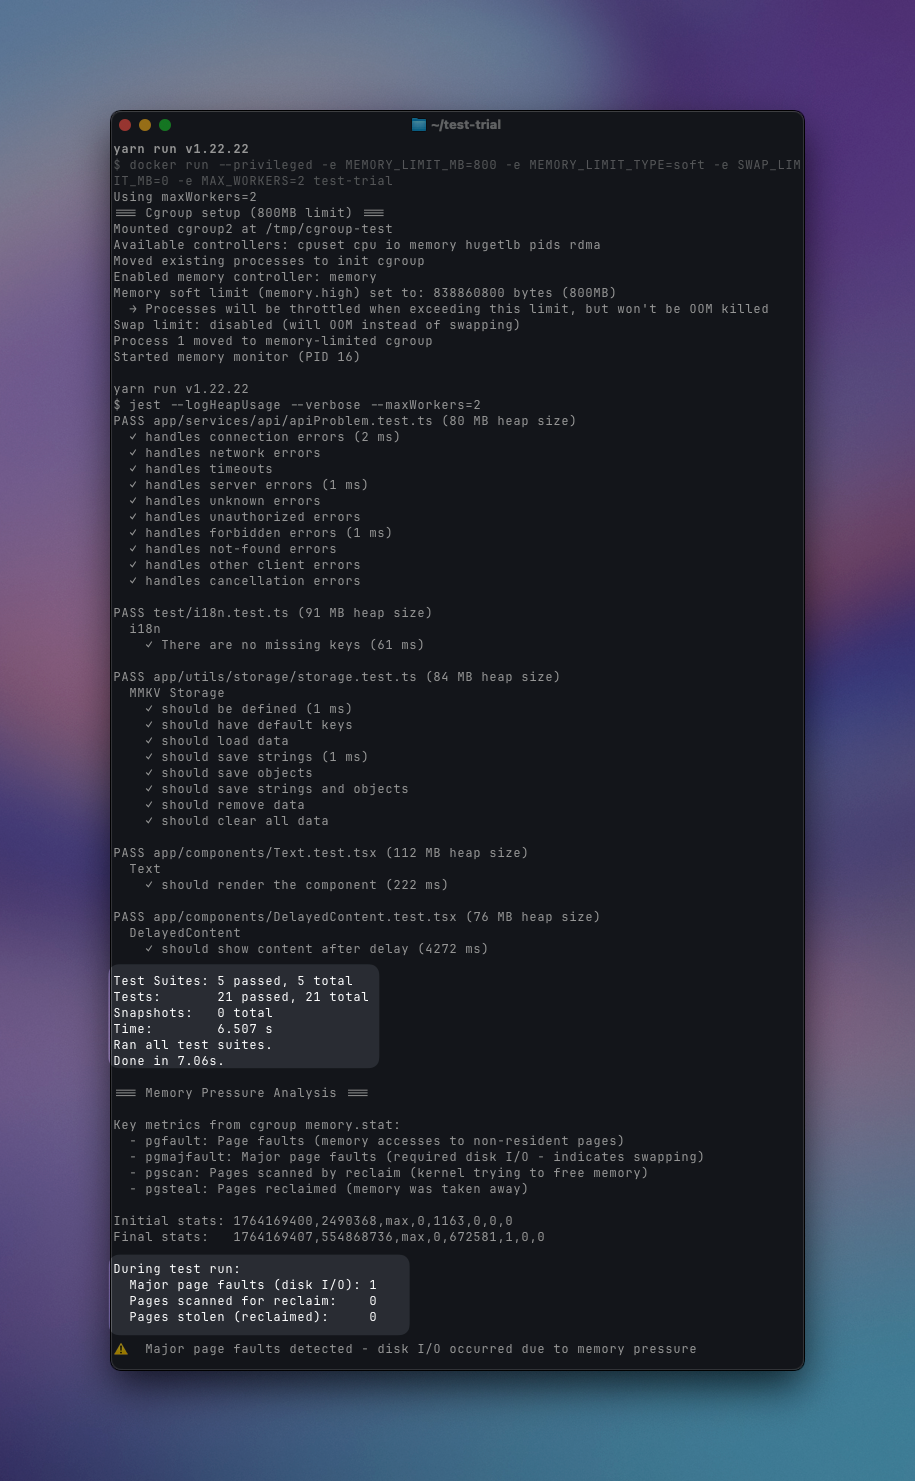
yarn docker:test:constrained:noswapWhich does the following:
- Sets a slightly higher memory limit to 800MB: we want some headroom to theoretically run all our tests correctly, but a low enough value that the Jest suite will consume most of it, and kick on memory-reclaiming actions from the operating system.
- We change
memory.maxin the cgroup tomemory.high. This will throttle memory, rather than killing it with OOM when we get close to the limit. - We also set the swap memory limit to
0bytes, which prevents the cgroup from ever using swap memory.
A test run of this scenario yields:
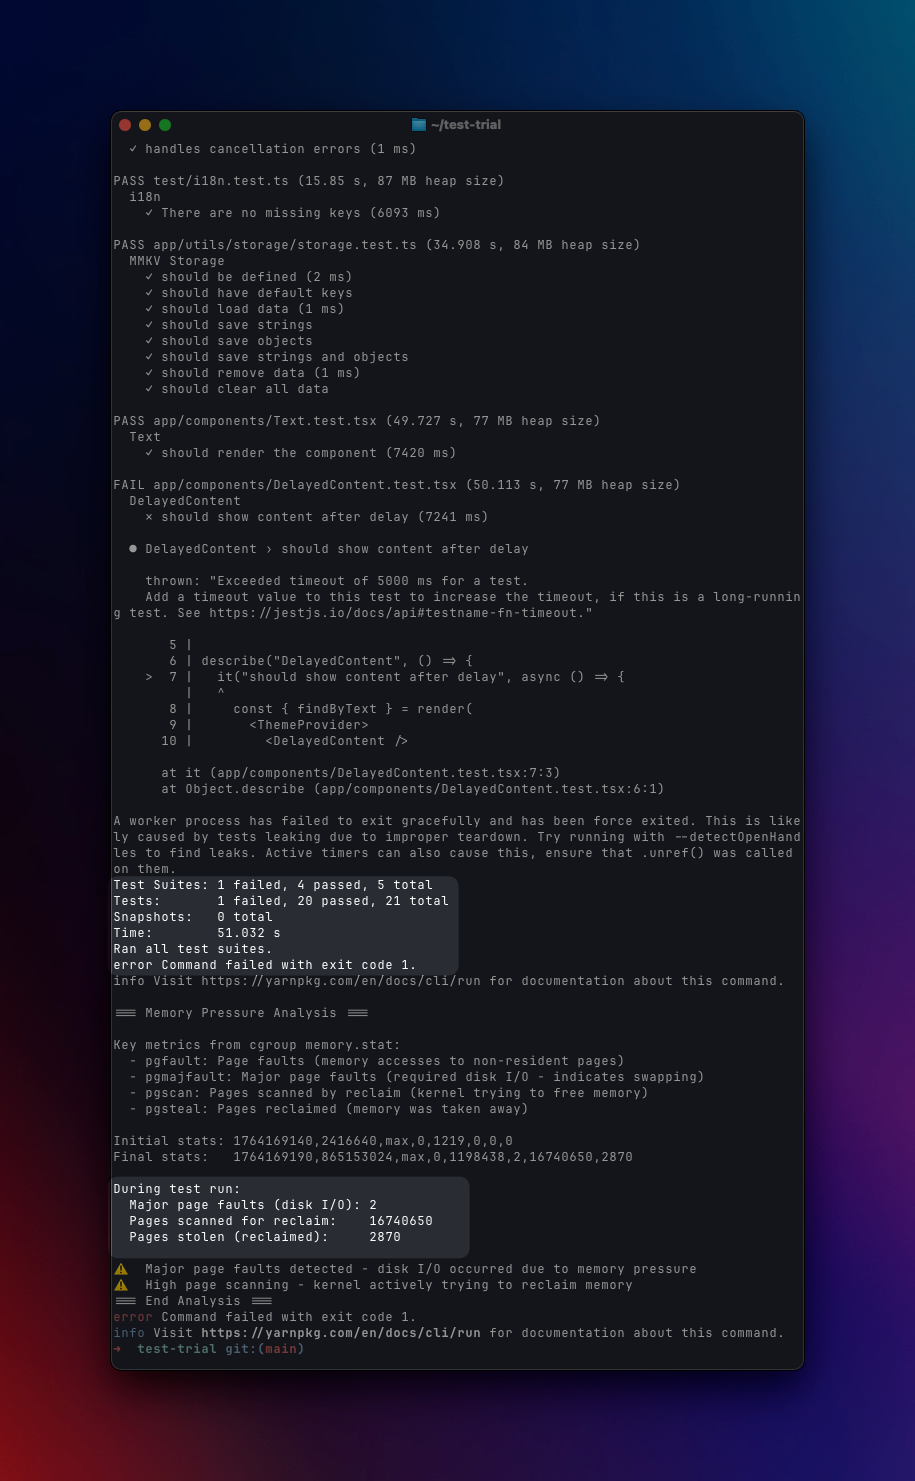
You’ll see here that we almost never experience major page faults. The process is not using swap memory. The page scanning is two orders of magnitude higher than what we saw in the original memory constrained environment. And our test suite now takes almost 8x as long as it originally did, which triggers our timeout error.
This tells us that Jest performance problems can be caused by swap memory, or in some cases, just plain old memory thrashing. Either case will result in slow test suites, and can cause flaky timeout errors.
Fix it with maxWorkers (again)
Again, this can be remedied with — maxWorkers. We can run the same command with — maxWorkers=2 by using this convenience script in the repo
yarn docker:test:constrained:noswap:workersWhich yields:
Summary
Here’s a table summarizing some of the key results from our experiments:
  | Scenario                                 | Time | Major Page Faults | Page Scans | Result    |
  |------------------------------------------|------|-------------------|------------|-----------|
  | Unconstrained                            | 7s   | 0                 | 0          | ✅ Pass    |
  | 200MB limit                              | 19s  | 642,166           | 3,025,671  | ❌ Timeout |
  | 200MB + maxWorkers=2                     | 9s   | 72,219            | 674,557    | ✅ Pass    |
  | 800MB soft limit, no swap                | 51s  | 2                 | 16,740,650 | ❌ Timeout |
  | 800MB soft limit, no swap + maxWorkers=2 | 7s   | 1                 | 0          | ✅ Pass    |
If you’re experiencing Jest timeout flakes in CI, it’s possible the culprit is memory pressure from parallelization. As Jest workers eat up memory resources, your CI runner may drop into swap memory or thrash its available RAM. This causes a slowdown and intermittently failures on timeout based assertions. You can fix it by setting an appropriate number of maxWorkers .
This problem is particularly insidious, because it occurs when your test suite grows in size. It almost acts as punishment for maintaining high test coverage in large scale codebases.
If you want to run a lot of Jest tests in your testing suite, you’ll want to either provision your machines with extra memory, fine-tune your maxWorkers, or find a balance between those approaches. I’ve had success setting this flag to — maxWorkers='50%', but the best setting for you will require some experimenting of your own. I hope this article gave you some tools to drive your own specific inquiry.
And of course, if you need help with React Native CI/CD, reach out to us at Infinite Red. We’ll not only fix your testing problems: we’ll work with you to understand them at a fundamental level.
메타데이터
- post_id
- e3d3189f35a4
- slug
- fix-flaky-jest-tests-in-ci-with-maxworkers-and-why-it-works-e3d3189f35a4
- url
- https://shift.infinite.red/fix-flaky-jest-tests-in-ci-with-maxworkers-and-why-it-works-e3d3189f35a4
- canonical_url
- https://shift.infinite.red/fix-flaky-jest-tests-in-ci-with-maxworkers-and-why-it-works-e3d3189f35a4
- author_url
- https://medium.com/@coolsoftwaretyler
- status
- ok
- fetched_at
- 2026-06-11 17:15:47