The Gaussian Blind Spot: What π’s Digits May Reveal About What Science Can’t See
A Measurement That Should Not Exist
The Gaussian Blind Spot: What π’s Digits May Reveal About What Science Can’t See
A Measurement That Should Not Exist
An Attralucian Essay
Two faces of Pi — and a simple question: Why?
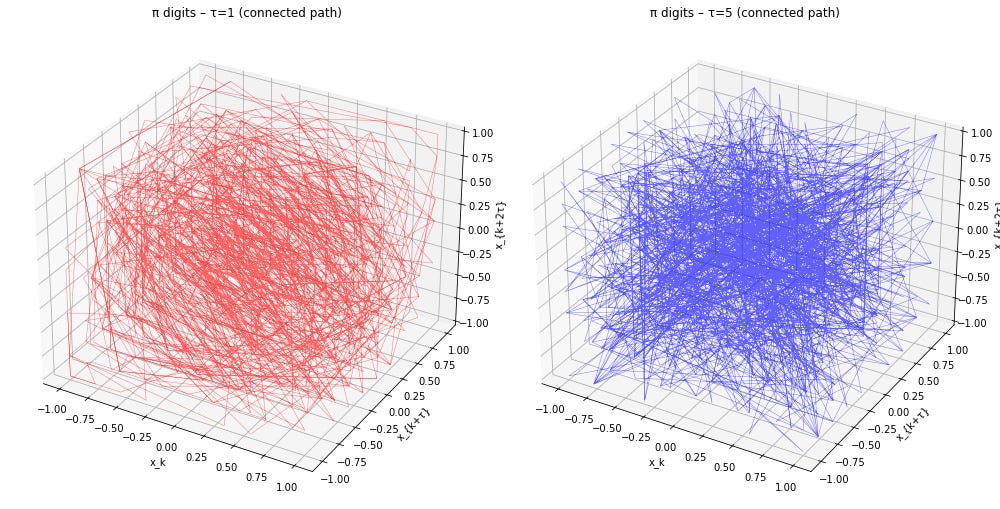
Figure 1: The Red and the Blue Pill: two faces of Pi
Preface:
In 2025, I carried out a series of numerical experiments on the fractional part of π.
Pi, π, holds one of the highest positions in all of mathematics. It is widely regarded as the pre-eminent Platonic form — an eternal, perfect constant that exists beyond the world of measurement, beyond the reach of uncertainty. For centuries, it has served as the ultimate symbol of mathematical purity.
However, my work is grounded in a different philosophy: Geofinitism, and this world is far away from the Platonic realm. In brief within my philosophy: measurement is the foundation of all knowledge. Every measurement must be turned into finite symbols. Every measurement has a geometric form and every measurement carries uncertainty — not as a flaw to be eliminated, but as a feature to be acknowledged.
From this position I turned my attention to the fractional digits of π and after making those measurements, I noticed something that was simply not supposed to exist. The results appeared to show an anomaly, a crack in the plaster on the wall of Plato’s cave.
As we will see the measurements are so simple that anyone can replicate them with a computer and a few lines of code. And yet their implications challenge the bedrock of modern science — the Platonic structures we have erected around the Gaussian distribution, the assumption that what cannot be measured by our tools does not exist.
In this essay, I will show you those results. I will ask you to use your own eyes. I will ask you to see what I saw, and then to ask yourself: What does this mean?
This is, of course, the tiniest of results. A few lines of code. A cheap computer. A sequence of digits known for millennia. But perhaps — just perhaps — what we see here are the seeds of a new basin of thought. One we may need to explore, even if only to ensure that we can stand with confidence in our Gaussian knowledge when measurements approach the limits of what that knowledge can hold.
What follows is not a claim that π is non-random. It is a claim that our current tools — designed to detect particular classes of structure — may be blind to others. The experiment is simple, the result is visible, and the question it raises is modest but precise: have we mistaken what we can measure for what exists?
Interlude: π at the High Table
Before we turn the dial, a word about where π sits.
It is difficult to overstate π’s position in the pantheon of mathematics. If the sciences and mathematics have a high table — a gathering of the few constants, equations, and ideas that have earned permanent seats — π is not merely seated at it. It presides.
For millennia, π has been the bridge between the circle and the line, between geometry and number. It appears in the Fourier transform that underlies modern signal processing, in the normal distribution that governs statistical inference, in Euler’s identity eiπ+1=0, which is often called the most beautiful equation in mathematics. It is woven into the Schrödinger equation, into general relativity, into the very language we use to describe the physical world.
When we say something is “as certain as π,” we mean it.
And π has returned the favor. Its digits have been computed to trillions of places. They have been subjected to every statistical test ever devised — tests for randomness, for pattern, for structure. The verdict, delivered repeatedly over decades, has been consistent: π passes. No significant deviation from randomness. No hidden order. No message in the bottle.
This is why π is trusted. This is why it sits at the high table. It is not merely useful; it is clean. It is the Platonic ideal of a constant — eternal, unchanging, beyond the mess of measurement.
So when I say that I carried out a simple experiment on π’s digits and found something that, by the lights of the high table, should not exist, I am aware of how that sounds. It sounds like a claim that demands extraordinary evidence.
I do not claim extraordinary evidence. I claim a few lines of code, a cheap computer, and a willingness to look. I claim a visual difference that you can see with your own eyes — the coil and the scaffold — and a second witness in the form of a modern AI that sees the same difference and describes it in plain language.
This is, I acknowledge, the tiniest of cracks. A hairline fracture in plaster that has held for centuries. It may be nothing. It may be a curiosity that resolves itself with a better understanding of the tools. But it may be something else. It may be a draft from a room we did not know existed. Let us see.
I. The Experiment
We begin, rather modestly, with a dial. A sequence of digits. And perhaps, a choice. We run an experiment. It costs nothing. Ten thousand digits of π. Three dimensions. A dial labeled τ. Turn it to 1. On the screen appears a shape: coiled, dense, filamentary, like a strange new form of DNA. It swirls within the cube, organic and alive. Turn the dial to 5. The shape snaps into something entirely different: angular, scaffolded, full of sharp rectangular voids, as if points have arranged themselves along the edges of an invisible lattice. Turn back. Coil. Forward. Scaffold. Coil. Scaffold.
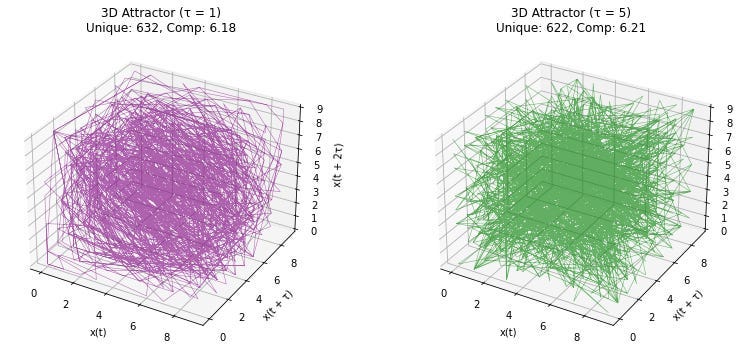
Figure 2. Another day and another plot and still I can see a difference — can you?
Same digits. Different geometries.
The anomaly is not that different embeddings produce different images — that is expected. The anomaly is that these embeddings resolve into stable, distinct geometric classes that are visually and semantically separable, yet remain statistically indistinguishable from randomness under conventional tests.
Your eyes see it immediately — not as interpretation, but as fact. The coil is not the scaffold. The scaffold is not the coil. Now ask a statistician. They will run the tests — mutual information, transition matrices, recurrence quantification analysis, principal component analysis. They will generate surrogates — shuffled versions of the digits — and compare. They will calculate p-values. The results come back clean. No significant departure from randomness. No detectable structure. Nothing to see here. The statistician smiles, satisfied. “Your eyes are playing tricks on you. The numbers don’t lie.”
Who do you trust? Your eyes? Or the tools?
This is not a question about π. This is a question about the house we live in.
II. The House of Thomas Kuhn
You live in a house built over centuries. Its foundations were laid in the age of steam. Its load-bearing walls are made of statistical inference. Its windows are calibrated to let in only certain kinds of light — a particular prescription ground in the 19th century, designed to filter the world through a specific assumption: that reality, at its heart, is Gaussian. Normal. Independent. Identically distributed.
The inhabitants — scientists, mathematicians, philosophers — have mapped every room, sealed every draft, explained every shadow. They tell you the house is complete. There is nothing left to find. But you feel a breeze where there should be none. You hear echoes from behind walls that supposedly back onto nothing. You begin to suspect the blueprints are wrong. This is not a crisis. It is a curiosity. A permission to look.
The house, you see, has a name. It is called Normal Science. And it was first described by a man named Thomas Kuhn, who noticed something peculiar about the people who live here: they cannot see the walls. They have lived inside the architecture so long that they have forgotten it is architecture. They mistake their inherited ways of seeing for the way things are.
The Gaussian lens is so deep it is never stated: if a sequence cannot be distinguished from Gaussian noise by our tools, it contains no meaningful structure.
Kuhn also noticed something else. Every great shift in science — every revolution — begins not with a new theory, but with an anomaly. A crack in the plaster. A draft from a sealed room. A result that should not exist, according to the blueprints, but does. The inhabitants explain it away. They always do. It is not their job to see the cracks; it is their job to maintain the house. But the cracks remain. And they widen.
III. Why the Tools Miss It
What, exactly, has happened here? A sequence of digits — π — has been treated as a time series and embedded in three dimensions using Takens’ method:
**x**t(τ)=[xt,xt+τ,xt+2τ]
where τ is the delay parameter — the “time lens” through which we view the sequence. By changing τ, the same data produces different geometries. The coil (τ=1) and the scaffold (τ=5) are not artifacts of visualization. They are geometric properties of the sequence when unfolded differently. Now consider the statistical tools that returned the verdict of “no structure.”
Mutual information measures average dependence between lagged values. For π, it falls within the confidence bands of shuffled surrogates — no detectable lag structure.
Transition matrices capture the probability of moving from one digit to another. For π, they are nearly uniform; deviations are scattered and consistent with random fluctuation.
Recurrence quantification analysis (RQA) quantifies patterns of recurrence in the trajectory. For both τ=1 and τ=5, the metrics (determinism, mean line length) fall within surrogate confidence intervals.
Principal component analysis (PCA) examines the variance structure of the delay vectors. The explained variance spectra for both τ values lie within surrogate confidence bands.
By every conventional measure, π is indistinguishable from randomness. We may, in other words, have mistaken statistical indistinguishability for the absence of structure.
And yet the coil and the scaffold: the difference refuses to disappear.
A skeptical reader might object: “You’re making a big deal about visual patterns in a 3D plot. Isn’t that just a choice of projection? Change the viewing angle and the ‘coil’ and ‘scaffold’ might look different. Isn’t this just aesthetics dressed up as science?”
It is a fair question. Here is the answer: the choice of τ is itself a measurement parameter. Different τ reveal different invariants of the sequence — different ways the digits connect across scales.
The fact that τ=1 and τ=5 produce visually distinct geometries is not an artifact of a particular viewing angle. It is a property of the sequence under different measurement conditions. Rotate the cube, change the lighting, alter the perspective — the coil remains a coil, the scaffold a scaffold. Their geometries are stable.
But more importantly, we are not relying on the human eye alone. We have a second witness.
IV. The Second Witness: AI as Measurement
There is, it turns out, a third option. A witness who was not trained in the house’s ways, but was raised on a different diet altogether. Take the two images — the coil and the scaffold — and show them to a multimodal AI, a model trained on billions of human descriptions, on the way we use language to capture what we see.
Do not ask it to classify. Do not ask it to calculate. Ask it, simply, to describe.
It looks at the coil (τ=1):
“A dense, coiled structure with smooth, filament-like paths weaving through the cube. The pattern appears rotational, with few large voids.”
It looks at the scaffold (τ=5):
“A more rigid, scaffold-like pattern with sharp angles and rectangular gaps, as if points lie along grid edges forming a lattice.”
The descriptions are not random. They are consistent. They are measurable — not in p-values, but in the semantic distance between “coiled” and “scaffolded” encoded in the model’s high-dimensional latent space.
What is happening here? A modern vision-language model does not see pixels. It uses an encoder Φ that maps the rendered image I into a high-dimensional embedding:
Φ:I→Rd,d≫3
This embedding preserves global geometric information. Two images that are visually distinct map to well-separated points in the latent space. The distance between them:
D(τ1,τ2)=∥Φ(Iτ1)−Φ(Iτ2)∥2
is a geometric measure — one that respects the flow structure captured in the image rather than flattening it to a scalar statistic. The AI, trained to see as humans see, confirms what your eyes already knew: the difference is real.
From a Geofinitist perspective, this is not a trick. It is a measurement — a finite, geometric measurement carried out by a representational system that carries its own uncertainty, but no more so than any other measurement we trust. The AI is not a judge. It is an instrument — and it is important to be precise about the role it plays.
The AI does not establish truth; it provides an independent measurement pathway with a different sensitivity to structure. Where conventional statistics compress the sequence into scalar summaries, the vision-language model preserves and encodes global geometric relationships. The agreement between eye and model is therefore not a proof, but a convergence of two distinct measurement systems.
V. Critiques Corner: What This Is Not
Before I am accused of claiming too much, let me anticipate a few objections. I offer them not as a defense — defensiveness is the posture of someone who already knows they are right — but as an acknowledgment that reasonable readers may see this differently. I may be wrong. That is, after all, the risk of looking at cracks.
Objection 1: “You’re just seeing patterns in noise. Humans are pattern-machines. That’s what we do.”
This is true. We are. The human visual system is exquisitely tuned to find structure, even where none exists. Pareidolia is real. The face on Mars is not a face.
But here, we have a second witness. The AI vision-language model sees the same difference and encodes it in its latent space — a space that correlates with millions of human judgments but is not itself human. The difference between τ=1 and τ=5 is not a hallucination of my visual cortex. It is measurable, stable, and replicable.
Still, I grant: the AI is itself a human artifact, trained on human descriptions. It may carry our biases forward rather than correct them. This is not a proof. It is, at best, a corroboration.
Objection 2: “The statistical tools are not ‘blind.’ They are doing exactly what they were designed to do. You’re using them wrong.”
Fair. The tools were not designed to detect the kind of structure revealed by delay embeddings with different τ. They were designed to answer different questions: Is there linear correlation? Is there recurrence beyond chance? Is the variance structure low-dimensional?
That they return null results is not a failure. It is a boundary condition. They tell us something true: by those measures, π is indistinguishable from randomness.
The question is whether we have mistaken those measures for a complete description. The coil and the scaffold suggest we have. But perhaps the mistake is mine: perhaps I am asking the tools to do something they were never meant to do, and then blaming them for it.
Guilty. But the deeper question remains: if our most trusted tools cannot see what our eyes can see, should we trust only the tools?
Objection 3: “The visual difference is just a consequence of how you’re rendering the points. Change the point size, the opacity, the viewing angle, and the difference might disappear.”
I have tried rotating the image and the embeddings, changed point sizes, varied opacity, used different rendering engines. Yes, we do see differences from different angles — but those differences are quite distinct. And when we shift back we find the coil and the scaffold. The scaffold and the coil return. My eyes enable me to see different forms and trajectories of points in space where none should exist.
But I cannot prove this to you in an essay. You would need to run the experiment yourself, rotate the cubes, see the stability with your own eyes. I am, in the end, asking you to look. That is not a proof. It is an invitation.
Objection 4: “Even if the difference is real, so what? π is a special case. It doesn’t generalize to real data.”
This is the objection that gives me most pause. π is not a physical signal. It is a mathematical constant. Showing that its digits have τ-dependent geometry may tell us something about π, but does it tell us anything about LIGO, about quantum computing, about the data that actually matters?
Perhaps not. Perhaps this is a curiosity and nothing more.
But here is why I think it may generalize: the statistical tools we use on physical data — mutual information, surrogate tests, recurrence quantification — are the same tools we used on π. They are designed under the same Gaussian assumptions.
If those assumptions miss structure in π, what reason do we have to believe they capture all structure in physical data?
I do not know the answer. But I think the question is worth asking. And I think we should be cautious about spending billions on experiments whose data pipelines are built on assumptions we have not tested against the simplest of cases.
Objection 5: “You’re attacking Gaussian statistics. But Gaussian statistics work. They gave us modern science.”
They did. They have. I am not attacking them. I am asking about their limits.
Every tool has a domain. A hammer works beautifully for nails. It is less useful for understanding the grain of wood. The Gaussian lens has given us extraordinary things — regression, hypothesis testing, signal processing, much of modern inference. I do not propose abandoning it.
I propose knowing where it ends.
The coil and the scaffold are, perhaps, a signpost at the boundary. They do not tell us that Gaussian statistics are wrong. They tell us that there are things they cannot see. And if we are working at the frontier of knowledge — LIGO listening to the fabric of spacetime, quantum computing pressing against the limits of the finite — we may find ourselves at that boundary more often than we think.
Objection 6: “This is philosophy, not science. You’re not proving anything.”
Guilty, in part. This is an essay, not a journal article. I am not presenting a hypothesis test with a pre-registered protocol. I am showing you something I saw and asking what it might mean.
But philosophy and science are not enemies. Lorenz’s anomaly was first dismissed as a numerical artifact — a philosophical curiosity about determinism and prediction — before it became chaos theory. The questions come first. The methods follow.
If this essay makes you want to run the experiment yourself, to look at the coil and the scaffold with your own eyes, to ask what else might be hiding in plain sight, then it has done its job. If it makes you want to write a rebuttal, even better. The conversation is what matters.
A Final Note on Uncertainty
I may be wrong.
The difference between τ=1 and τ=5 may be an artifact of rendering, a quirk of the embedding, a trick of the eye that the AI has learned to mimic. The implications I have drawn may be overreaching. The doors I have opened may lead nowhere.
But I have shown you what I saw. I have told you how you can see it for yourself. I have offered a second witness and a set of measurements that, however imperfect, are replicable. If I am wrong, the cost is small: a few hours of your time, a few lines of code, a moment of looking. If I am right — if the Gaussian lens is missing something real, something that matters — then the cost of not looking is measured in billions of dollars, in experiments that may be blind to their own data, in questions we have not yet learned to ask.
I do not know which is true. But I know which risk I would rather take.
VI. The Lorenz Moment
It is worth asking whether this experiment reveals a limit similar to Lorenz’s — or whether I am seeing patterns where none exist. I confess I cannot be certain. But I can show you what I saw, and let you judge.
In 1961, Edward Lorenz was running a weather simulation on a rudimentary computer. He wanted to rerun a sequence, so he typed in the numbers from an earlier printout. To save time, he rounded them — from 0.506127 to 0.506.
The result was a different weather pattern. Entirely different. The tiny rounding error had produced massive divergence. Lorenz’s discovery was initially dismissed as a numerical artifact. It took years to recognize that it revealed a limit to what the existing framework could handle. Deterministic systems could be effectively unpredictable. The assumption that “deterministic” meant “predictable” was false. That was the anomaly. And it gave us chaos theory. Perhaps, this experiment reveals a similar limit. The assumption being challenged is this:
If a sequence cannot be distinguished from Gaussian noise by conventional statistical tests, it contains no meaningful structure.
π passes every test. By the house’s own lights, it is nothing. Random. Featureless. Closed. And yet — the coil. The scaffold.
The anomaly is not that π has hidden structure. The anomaly is that our tools are blind to whole categories of structure — categories that are not Gaussian, that do not reveal themselves to second-order statistics, that require geometric rather than summary methods to detect. This is not a problem with π. It is a problem with the tools we use to interrogate all data.
Lorenz’s anomaly forced a rethinking of prediction, measurement, and the limits of models. This anomaly forces a rethinking of what we mean by “random,” what our tools can see, and what we might be missing.
VII. The First Door: LIGO and the Cost of Blindness
Now step back into the corridor. Look at the doors you walked past before. They were always there, but you didn’t know how to look. Open the first door.
Door: The Never-Ending Train of Calculations in LIGO
If the effect observed here generalizes beyond this specific construction, and that remains an open question, then the implications may extend far beyond π.
LIGO — the Laser Interferometer Gravitational-Wave Observatory — cost over a billion dollars. It asserts it measures distortions smaller than a proton. Its output is a time series, fed through matched filters, through templates, through pipelines designed to find signals that look like our expectations. We find what we look for. We confirm what we template.
But what if there are structures in LIGO’s data that do not match any template but are nonetheless real? What if the geometry of the data contains signals we are not looking for because our pipelines — built on Gaussian assumptions, on flattening operations, on null hypothesis tests — are blind to them?
Every signal from LIGO is flattened, filtered, tested against surrogates. If it doesn’t match an expected waveform, it is discarded as noise. But if π can hide geometry from our best tools, what might the fabric of spacetime be hiding? This is, I grant, a speculative thought. But it is a thought worth holding. We may be hearing only the songs we already know, while the universe sings in geometries we haven’t learned to name. The cost of the Gaussian assumption is not abstract. It is measured in billions of dollars and in discoveries we may be missing.
VIII. The Second Door: Quantum Computing and the Finitude of Numbers
Open the next door.
Door: The Finite Nature of Numbers
If this geometric sensitivity to representation is not unique to π but a broader property of finite symbolic sequences, then it may have implications for how we model and interpret quantum systems.
Quantum computing is built on a mathematical foundation: Hilbert spaces, unitary operators, complex numbers — all of which involve π. We spend billions building machines that manipulate finite states — qubits, registers, gates — but our mathematical language for quantum mechanics is still built on infinite assumptions: continuity, real numbers, infinite precision.
What if numbers are not infinite resources? What if they are finite objects, with structure, with geometry, with behavior that depends on how you unfold them?
π’s digits are not random; they are determined. They are the output of a finite procedure — an algorithm, a series, a computation. And when you treat them as a time series, when you embed them with different delays, you see that determination expressed as shape.
The coil. The scaffold. They are not illusions. They are the signature of the finite.
We have been treating numbers as if they were infinite in every respect. But they are not. And their finitude leaves traces. We are only now learning to see them. What might we discover about quantum systems if we asked different questions — questions about geometry, about embedding, about the shape of the numbers themselves?
IX. The Deeper Question: What Are We Measuring?
Open the door at the end of the hall.
Door: The Age of Steam
Our entire scientific apparatus is built on concepts forged in the 17th–19th centuries: calculus, probability, statistics, reductionism. They were built for steam engines, for ballistic trajectories, for industrial accounting. They are tools for flattening. And they worked. They gave us railways, factories, electricity, flight. They gave us the modern world. But they also gave us a habit: the habit of believing that what survives flattening is all that exists. That if a phenomenon cannot be captured in a mean, a variance, a p-value, it isn’t real. π, rendered in 3D with different τ, says: That habit is wrong.
The symbols we use — π, Fourier transforms, wave equations, complex numbers — are not neutral carriers of meaning. They are themselves data. And if π itself, in its raw digit sequence, contains geometric structure that our tools cannot see, then what about every function that contains π? Every oscillation, every resonance, every complex-valued description of the physical world is built on a foundation that may be far richer than we know. Perhaps we have been reading the surface of the text, unaware that the letters themselves form a geometry.
From a Geofinitist perspective, this is not mysticism. It is a matter of measurement. The digits of π are finite symbols. They have a geometry that can be measured — by embedding, by AI, by the human eye. The question is not whether that geometry exists. The question is whether we are willing to measure it.
X. The Choice
At the top of the house, a dusty room. Here, you find the original instruments — the first statistical tests, the early flattening machines, the steam-age tools that built the modern world. They are beautiful, elegant, powerful. And they are tools.
It seems to me that somewhere along the way, we forgot this. We mistook them for eyes. We began to believe that what they could not see did not exist. We confused the map with the territory, the measurement with the thing measured. The attic is not a place of shame. It is a place of remembrance. The tools served us well. They built the house. But they are not the house. And they are certainly not the world beyond its walls. And finally, a window that wasn’t there before — or was always there, but covered. You open it and look out.
Perhaps the horizon is not where you thought it was. Beyond the house, there is no single landscape. There are many. Some are coiled, some scaffolded. Some require new tools to see, new languages to describe, new ways of being a knower.
The house of Thomas Kuhn is not a prison. It is a phase. Every inhabitant eventually faces a choice: maintain the walls, or walk through the cracks.
XI. An Invitation
The experiment with π costs nothing. A few lines of code. A penny’s worth of electricity. A willingness to look. You can run it yourself, tonight, on any computer that has Python installed. You can see the coil and the scaffold with your own eyes. You can ask an AI to describe them and hear the difference in plain language.
And then you can ask: What does this mean? Not as a rhetorical question. Not as a prelude to a lecture. But as an actual question — one you do not yet know how to answer.
What does it mean for the signals from the sky? For LIGO’s endless calculations? For the steam-age tools we still carry? For the symbols we write without reading? For the numbers themselves, finite and strange?
What is needed now is not more null hypothesis tests. It is a new way of looking — an Atlas of π’s geometries across τ, a systematic mapping that treats shape as data, that uses geometric and topological tools alongside the statistical ones we already trust. We do not need to abandon the Gaussian. We need to know its limits, to stand with confidence where it holds, and to recognize when we have stepped beyond its domain.
What does it mean if we don’t take this seriously? What does that tell us about mathematics, about physics, about science — about our willingness to protect the house rather than explore what lies beyond?
Lorenz’s anomaly gave us chaos theory. This anomaly — the coil and the scaffold, invisible to flattening but undeniable to the eye — may give us something we don’t yet have a name for.
Maybe, a new way of seeing, a new kind of measurement. A new understanding of what numbers are, what data is, what we might find when we finally stop flattening the world and start looking at its shape.The cracks are there. The doors are many, and the light, whether we look or not, is already coming through. You are standing in the hallway and your hand is on the handle. The house will not open itself; but it may, perhaps, be opened.
Appendix: The Numerical Experiment
For those who wish to replicate or inspect the results.The following minimal example reproduces the core observation using a simple delay embedding of π’s digits. It is not optimized, nor is it intended as a full analysis — only as a direct way to see what has been described.
Data
The first N=10,000N=10,000 digits of π after the decimal point were generated using mpmath at high precision.
Delay Embeddings
3D delay vectors were constructed for several choices of τ:
**x**t(τ)=[xt,xt+τ,xt+2τ]
Key Observation
The visual difference between τ=1 and τ=5 embeddings is immediate and stable: one appears coiled, dense, and filamentary; the other appears scaffolded, angular, with rectangular voids. This difference is confirmed by AI vision-language models, which produce semantically distinct descriptions and well-separated latent embeddings.
Conventional Tests
- Average Mutual Information (AMI): All values fell within surrogate confidence bands.
- Transition Matrices: Near-uniform; deviations consistent with random fluctuation.
- Recurrence Quantification Analysis (RQA): Metrics (determinism, mean line length) within surrogate intervals.
- Principal Component Analysis (PCA): Explained variance spectra within surrogate confidence bands.
All conventional statistical tests failed to distinguish τ=1 from τ=5 or from shuffled surrogates.
AI Measurement
Images of the τ=1 and τ=5 embeddings were passed to a vision-language model. The resulting descriptions (“coiled” vs. “scaffolded”) were consistent and semantically distinct, confirming that the geometric difference is encoded in the model’s high-dimensional latent space.
*This essay is part of the Attralucian Essays and the developing philosophy of Geofinitism. The experiment is replicable. The code is available. We measure. We see. We ask. The rest is silence. **This essay is shared under Creative Commons BY-ND 4.0. The experiment is easily replicable.
Source essay here including full statistical tests
@author: Kevin R. Haylett
"""
import mpmath
import numpy as np
import matplotlib.pyplot as plt
from mpl_toolkits.mplot3d import Axes3Dmpmath.mp.dps = 1000 # more digits = smoother longer paths# π digits after decimal
pi_str = str(mpmath.pi)[2:]
digits = np.array([int(d) for d in pi_str[:15000]]) # adjust slice as needed# Normalize digits roughly to center around 0
digits_norm = (digits - 4.5) / 4.5def delay_embed(digs, tau=1, m=3):
n = len(digs) - (m-1)*tau
points = np.zeros((n, m))
for i in range(m):
points[:, i] = digs[i*tau : i*tau + n]
return pointspts1 = delay_embed(digits_norm, tau=1, m=3)
pts5 = delay_embed(digits_norm, tau=5, m=3)fig = plt.figure(figsize=(14, 7))# τ=1 - connected path
ax1 = fig.add_subplot(121, projection='3d')
ax1.plot(pts1[:,0], pts1[:,1], pts1[:,2],
lw=0.4, alpha=0.6, color='red') # thinner line for density
ax1.set_title('π digits – τ=1 (connected path)')
ax1.set_xlabel('x_k')
ax1.set_ylabel('x_{k+τ}')
ax1.set_zlabel('x_{k+2τ}')# τ=5 - connected path
ax2 = fig.add_subplot(122, projection='3d')
ax2.plot(pts5[:,0], pts5[:,1], pts5[:,2],
lw=0.4, alpha=0.6, color='blue')
ax2.set_title('π digits – τ=5 (connected path)')
ax2.set_xlabel('x_k')
ax2.set_ylabel('x_{k+τ}')
ax2.set_zlabel('x_{k+2τ}')plt.tight_layout()
plt.show()Omne quod est, finitum est; tantum per mensuram cognosci potest Everything that exists is finite; it can only be known by measure
kevinhaylett.substack.com | geofinitism.com Copyright © 2026 Kevin R. Haylett
Keywords: Pi, Nonlinear Dynamics, LLM, Takens Theorem, Embeddings, AI
Citation: Haylett, K.R. (2026), The Gaussian Blind Spot: What π’s Digits Reveal About What Science Can’t Sees, Medium, March 2026.
메타데이터
- post_id
- e478bbdcb74a
- slug
- the-gaussian-blind-spot-what-πs-digits-may-reveal-about-what-science-can-t-see-e478bbdcb74a
- url
- https://medium.com/@kevin.haylett/the-gaussian-blind-spot-what-%CF%80s-digits-may-reveal-about-what-science-can-t-see-e478bbdcb74a
- canonical_url
- https://medium.com/@kevin.haylett/the-gaussian-blind-spot-what-%CF%80s-digits-may-reveal-about-what-science-can-t-see-e478bbdcb74a
- author_url
- https://medium.com/@kevin.haylett
- status
- ok
- fetched_at
- 2026-07-11 19:35:18