Pairs Trading in Forex: When Statistical Arbitrage Still Works in 2026
A practical primer on cointegration, spread construction, and the broker-side variables that decide whether your pairs-trading strategy…
Pairs Trading in Forex: When Statistical Arbitrage Still Works in 2026
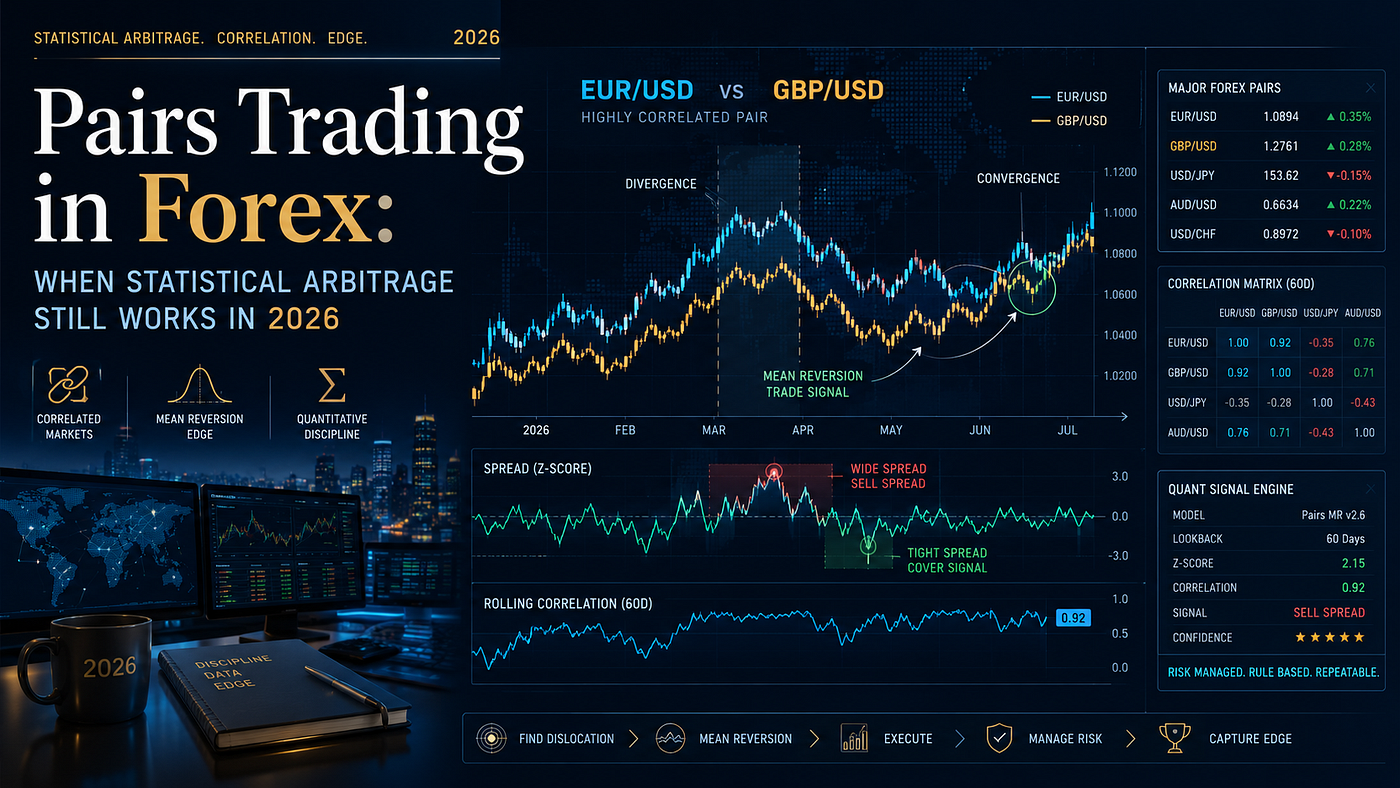
A practical primer on cointegration, spread construction, and the broker-side variables that decide whether your pairs-trading strategy survives in production.
Pair trading is one of the oldest statistical arbitrage strategies. The idea — trade the spread between two historically correlated instruments when it deviates from its mean — works in forex specifically because currency pairs are linked by macroeconomic structure: commodity exporters move together, EUR-related crosses move together, dollar-strength regimes move them all.
But pairs trading in forex has two hard problems that don’t exist in equity pairs trading. Correlations break suddenly at central-bank events. And broker execution quality decides whether the per-trade edge survives slippage and last-look.
This article walks through the math, candidate-pair selection, entry/exit mechanics, and the broker-side variables that most retail traders don’t measure.
Why did pairs trading exist in the first place?
In 1985, a quant team at Morgan Stanley led by Gerry Bamberger observed something obvious in retrospect. Two stocks in the same sector — say, two oil majors — move together most of the time. When they don’t, the divergence usually closes within days or weeks. If you buy the lagger and short the leader at the moment of divergence, you’re betting on mean reversion of the spread, not on the direction of either underlying. The position is market-neutral. The bet is small but high-probability.
Bamberger’s team made the strategy work because they had three things most traders didn’t have in 1985: a database of historical correlations, the computing power to scan thousands of candidate pairs, and execution infrastructure fast enough to enter both legs simultaneously.
In 2026, the database and the compute are free. The execution infrastructure is the one part that most retail traders still get wrong.
What “pairs trading” actually means in forex
In equities, a “pair” is two stocks. In forex, a pair is two currency pairs — four currencies total. You’re trading the spread of two spreads.
The classic forex examples:
- EURUSD vs GBPUSD — both USD-denominated EU-region currencies. When the dollar strengthens, both fall; when it weakens, both rise. The relationship is structural.
- AUDUSD vs NZDUSD — both Pacific commodity-exporter currencies, both heavily exposed to China demand. Their spread is a proxy for relative-strength bets on Australian vs New Zealand fundamentals.
- USDCAD vs USDNOK — both petrocurrencies on the short side, USD on the long side. The spread tracks the differential between Canadian and Norwegian oil-export economics.
- EURJPY vs EURUSD — same base (EUR), different quote (JPY vs USD). The spread is a proxy for the relative strength of the dollar vs. the yen.
The structural linkage is what makes the strategy viable. Without an economic reason for the two pairs to move together, a historical correlation is a coincidence and will break the first time it’s tested.
The math, briefly
The starting point is the cointegration test. Two time series X and Y are cointegrated if there exists a constant β such that the spread Z = X − β·Y is stationary — that is, Z has a stable mean and variance over time, and any deviation from the mean reverts to it.
In notation:
Z(t) = X(t) − β · Y(t)The standard test is the Engle-Granger two-step:
- Regress X on Y to estimate β.
- Test the residual series Z = X − β·Y for a unit root using the Augmented Dickey-Fuller (ADF) test.
If the ADF rejects the null hypothesis of a unit root (typically at p < 0.05), the pair is cointegrated and a mean-reverting spread exists.
Once you have Z, you compute its z-score:
z(t) = ( Z(t) − μ ) / σwhere:
μ = historical mean of Z
σ = historical standard deviation of ZThe trading rule is mechanical:
- Enter long-spread (buy X, short Y in proportion β) when z < −2
- Enter short-spread (sell X, buy Y) when z > +2
- Exit when |z| < 0.5
- Stop out when |z| > 3 (the relationship has broken)
The thresholds are conventional, not derived. In practice they get optimized per pair on walk-forward data, but the ±2 entry / ±0.5 exit pattern is the starting point.
[embed]
Selecting candidate pairs — what actually works in 2026
The naive approach is to scan all possible pairs of liquid forex symbols (35 majors and crosses give you 595 candidate pairs) and pick the most cointegrated. This finds spurious cointegrations and gives you strategies that work in backtests but fail in live trading.
The robust approach is to start from the economic structure and use the data to filter:
- Same-region pairs. EURGBP, EURCHF, and EURJPY all share a base currency and respond to ECB policy. Their spreads are clean economically.
- Commodity-pair groups. AUDUSD, NZDUSD, and USDCAD form a natural cluster — all three are commodity exporters with different commodity baskets.
- Safe-haven cohort. USDJPY, USDCHF, and gold (XAUUSD) all respond to global risk-off conditions but at different speeds.
- Carry-trade clusters. AUDJPY, NZDJPY, and GBPJPY all reflect yield differentials between higher-rate currencies and Japan.
Within each cluster, run cointegration tests on rolling windows (3-month, 6-month, 12-month) and keep pairs for which the test holds across all three windows. Multi-window confirmation is what separates real cointegration from regime-specific coincidence.
The execution layer is where retail strategies die
Here’s the part most pairs-trading tutorials skip.
A pairs-trading signal opens two simultaneous positions. If those positions don’t execute at the same instant, you have leg risk — directional exposure between the first fill and the second. On a strategy that targets 0.5 to 1.0 pip of mean-reversion edge per trade, even 200 ms of leg latency on a fast-moving spread can wipe the edge before the second leg fills.
Three execution variables decide whether pairs trading survives in production.
1. Matching the latency between the two legs
If both legs execute through the same broker’s matching engine, you can submit them as a paired order or close enough together that matching latency is symmetric. If one leg is on Broker A and the other on Broker B (cross-broker pairs), the latency differential is your unmitigated leg risk. Cross-broker pairs are theoretically interesting but require co-located infrastructure that retail doesn’t have.
2. Slippage asymmetry per leg
A broker that exhibits asymmetric slippage — fills going against the trader more often than for the trader — specifically kills pairs trading. The strategy depends on capturing small mean-reverting moves, and asymmetric slippage taxes both entry and exit, halving or eliminating the edge.
3. Spread widening at signal moments
Pairs trading signals tend to fire during periods of correlation stress (when one pair moves, the other lags). Brokers widen spreads during these exact moments to protect against adverse selection. A 30 percent spread widening at the signal moment translates directly to 30 percent smaller per-trade PnL — often the difference between profitable and break-even.
These three variables are not visible in standard broker reviews. They are measurable from a trading statement, but most retail traders never measure them before deploying capital. We open-sourced a toolkit for measuring them across five execution dimensions — link in the resources section at the end.
Risk management — when correlations break
Pairs trading works because correlations are stable. Pairs trading stops working when correlations break — and they break suddenly, not gradually.
Historical examples:
- Swiss National Bank, January 15, 2015. The CHF cap was abandoned. EURCHF moved 30 percent in minutes. Every CHF-related pair correlation broke simultaneously. Pair traders running EURCHF/USDCHF or similar got annihilated.
- March 2020, COVID risk-off. All commodity currencies decoupled from one another as risk-off flows dominated relative fundamentals. The AUDUSD / NZDUSD spread, normally stable, moved 4 standard deviations within two trading sessions.
- Bank of Japan yield-curve-control regime changes, 2022 to 2023. Every JPY cross-correlation resets twice over18 months. Pairs trades that worked in 2021 lost money in 2023, even on the same parameters.
The risk-management response is structural, not parametric:
- Hard stop on z-score divergence. If |z| > 3 for more than two trading sessions, exit immediately. The relationship is in regime change, not in noise.
- Position sizing scales inversely to correlation breakdown risk. Smaller size for pairs near major central-bank events.
- Calendar avoidance. No new entries 24 hours before NFP, ECB, BoJ, FOMC, or comparable scheduled events. The mean-reversion assumption breaks during volatility events.
- Walk-forward parameter validation. Re-test cointegration every quarter. Pairs that stop cointegrating should be retired, not re-optimized.
What separates working pairs traders from blown-up pairs traders
After looking at a lot of pairs-trading strategies that worked in backtest and failed in live deployment, the failure mode is almost always one of these four:
1. Spurious cointegration. The pair “worked” in the backtest because of survivorship bias in the candidate selection. Single-window cointegration tests pick up coincidences. Multi-window plus economic justification filters these out.
2. Execution slippage compounds across two legs. A 0.5-pip edge becomes a 0.1-pip edge after slippage on entry × 2 legs, then becomes negative after slippage on exit × 2 legs. The strategy needs to be tested under realistic execution-time assumptions before live deployment.
3. Spread widening at the signal moment. Pairs trading fires during correlation stress. Brokers widen spreads during correlation stress. Backtests that assume fixed spread miss this entirely and overestimate the live edge by 30 to 50 percent.
4. Correlation-breakdown events not modeled. A backtest that includes 2015, 2020, and 2022 to 2023 will look very different from one that excludes them. Either include the regime-change periods or hold a much smaller position than the backtest suggests.
Position sizing — a practical heuristic
For a pair with historical spread volatility σ and account equity E:
position size = ( E · R ) / ( |β| · 3 · σ )where:
E = account equity
R = risk per trade as fraction of equity (typically 0.5% to 1%)
β = the cointegration coefficient (regression slope)
σ = historical standard deviation of the spread Z
3 = the stop-out z-thresholdThe β scaling ensures the two legs are dollar-neutral, not contract-neutral.
For multi-pair portfolios, additionally cap total notional exposure across all open pairs to about 5× equity, and total simultaneous positions to about 5 distinct cointegrating relationships. Beyond that, you’re not diversifying — you’re concentrating on whatever common factor links the pairs.
When is pairs trading still viable in 2026?
Honest answer: yes, in narrow conditions.
It works when:
- You have multiple economically-justified candidate pairs, not data-mined ones.
- Your broker has Tier 1 or Tier 2 execution quality — fast matching, symmetric slippage, modest spread widening.
- Your position size respects regime-change risk — you size for tail events, not for backtested PnL.
- You walk forward to validate parameters every quarter.
It does not work when:
- You’re trading through a Tier 3 or Tier 4 broker (execution costs eat the edge).
- You’re relying on data-mined pair selection without an economic structure.
- You ignore correlation-breakdown events in your backtest.
- You scale up after a winning streak (regime change is non-stationary).
In our experience deploying statistical-arbitrage strategies through retail forex venues, the most common failure mode is broker selection, not strategy design. A correctly-designed pairs-trading strategy on a Tier 3 broker still loses money. The same strategy on a Tier 1 broker still works.
Resources
- A taxonomy of forex arbitrage strategies, including how pairs trading fits next to latency arb, lock arb, news trading, and triangular arb → bjftradinggroup.com/forex-currency-arbitrage-strategies
- Why latency arbitrage backtests don’t survive in production — the execution-time gap that applies equally to pairs trading → bjftradinggroup.com/latency-arbitrage-backtest-execution-time-gap
- Audit your broker’s execution quality before deploying any latency-sensitive strategy — open-source toolkit (MIT) measuring matching latency, slippage asymmetry, spread widening, last-look hold, and requote rate → bjftradinggroup.com/forex-broker-audit-toolkit
If you want to test pairs-trading parameters under realistic execution conditions — real historical ticks, configurable execution latency per order, automatic variable spread, tick-resolved slippage on both legs — that’s what we built SharpTrader Optimizer for at bjftradinggroup.com/product/sharptrader-optimizer. The toolkit is paid, but the broker-execution measurement piece (BEQI) is free and open-source.
Honest disclaimer
I run BJF Trading Group, which sells trading software. Pairs trading is a topic I work on professionally. The BEQI toolkit linked above is genuinely free, MIT-licensed, and broker-agnostic — we have no commercial stake in any specific broker scoring well or badly under it.
This article is educational. It is not investment advice. Backtest results do not predict live results, especially on strategies sensitive to execution quality. Audit your broker, walk-forward validate your parameters, and start with small position sizes.
Boris Fesenko is the founder of BJF Trading Group Inc. (Ontario, Canada), which builds execution infrastructure and arbitrage trading software for forex traders. Find more long-form pieces on bjftradinggroup.com.
메타데이터
- post_id
- e4dc4c6d9800
- slug
- pairs-trading-in-forex-when-statistical-arbitrage-still-works-in-2026-e4dc4c6d9800
- url
- https://medium.com/@casinohowtowin/pairs-trading-in-forex-when-statistical-arbitrage-still-works-in-2026-e4dc4c6d9800
- canonical_url
- https://medium.com/@casinohowtowin/pairs-trading-in-forex-when-statistical-arbitrage-still-works-in-2026-e4dc4c6d9800
- author_url
- https://medium.com/@casinohowtowin
- status
- ok
- fetched_at
- 2026-06-09 15:37:30