Predicting the Unpredictable: How I Built a Statistical Model for World Cup 2026 (And What It…
Like millions of football fans around the world, I spent my childhood arguing about who would win the next big match. But as I grew older…
Predicting the Unpredictable: How I Built a Statistical Model for World Cup 2026 (And What It Taught Me About Football Analytics)
Like millions of football fans around the world, I spent my childhood arguing about who would win the next big match. But as I grew older, I realized I didn’t just want to watch the game, I wanted to understand it. I dreamed of working professionally in football, sitting in the analytics room of a club or media outlet, helping managers and fans make sense of the beautiful game through data.
However, entering the world of professional football analytics requires more than just passion. It requires a portfolio. You need to prove you can translate the chaotic, emotional, and unpredictable nature of 90 minutes on a pitch into clear, actionable insights.
With the World Cup 2026 on the horizon, I saw the perfect testing ground. I decided to challenge myself by building a predictive modeling system from scratch, analyzing all 104 matches. Here is the story of how I built it, how it worked, and how a simple spreadsheet taught me a massive lesson about the dynamics of tournament football.
A. THE CORE CONCEPT: BUILDING THE TEAM STRENGTH INDEX (TSI)
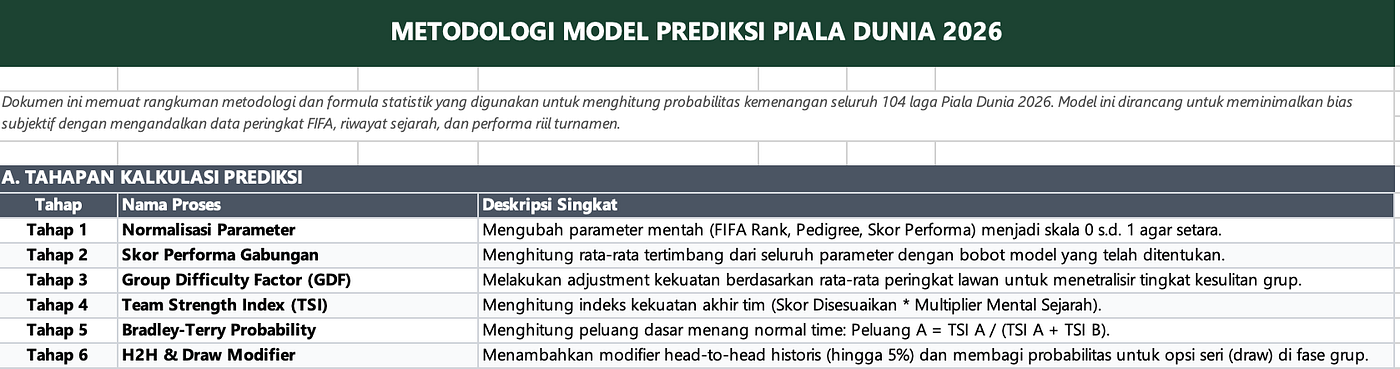
To predict match outcomes, you first need a reliable way to measure how good a team is. I created a custom metric called the Team Strength Index (TSI). The TSI is a rating assigned to each country that dynamically adjusts as the tournament progresses.
The model was split into two distinct phases to match the evolution of the tournament:
- The Group Stage Model (Pre-Tournament) Before a single ball is kicked, you only have historical and baseline data. For the first 72 matches, the TSI of each team was calculated using:
- FIFA/ELO Rankings (Weight: 4): To establish the baseline global ranking.
- Historical Pedigree (Weight: 3): A rating from 1 to 10 evaluating a country’s historical tournament experience and mental strength under pressure.
- Group Difficulty Factor (GDF): A multiplier based on the average ranking of the three other teams in the group, ensuring that teams in a “Group of Death” had their strength adjusted relative to their environment.
- The Knockout Stage Model (Dynamic Performance) This is where the magic happens. In tournament football, a team’s pre-tournament ranking becomes less relevant than their current momentum.
For the 32 knockout matches, I introduced the Cumulative Performance Score. I tracked actual performance metrics from previous matches — such as points won, goal differences, expected goals (xG), and clean sheets. These stats were weighted and added to the baseline TSI. As a team progressed to the Quarter-Finals and Semi-Finals, the weight of their current tournament form increased, overriding their older pre-tournament rankings.

THE MATHEMATICAL ENGINE: BRADLEY-TERRY AND DRAW MODIFIER
Once the final TSI for both teams was calculated, the model computed match probabilities using the Bradley-Terry Model:
Base Probability (Team A) = TSI(A) / [TSI(A) + TSI(B)]
After getting this baseline, the model applied three custom adjustments:
- Head-to-Head (H2H) Shift: A maximum plus/minus 5% adjustment based on the last 5 matches played between the two countries.
- The Draw Probability Model: In the Group Stage, games can end in draws. I designed a custom formula that capped draw probability at 30% when teams were perfectly balanced, reducing it as the gap in strength grew wider:
Draw Probability = 30% * [1.0 — |Base Probability A — Base Probability B|]
- Penalty Shootout Index (PSI): For knockout stages where draws aren’t possible, I built a separate shootout model factoring in historical shootout win rates, goalkeeper penalty save percentages, and individual taker statistics.
THE RESULTS: WHAT THE NUMBERS TAUGHT ME
After testing the model’s predictions against the actual real-world results of the 104 matches, here is how the accuracy broke down:
- Group Stage Accuracy (72 Matches): 59.72% Predicting group stage matches is notoriously difficult because of the possibility of a draw. In a 3-way outcome scenario (Win A, Draw, Win B), the random baseline chance of being correct is only 33.3%. An accuracy of nearly 60% proved that our initial TSI baseline was highly reliable.


- Knockout Stage Accuracy (32 Matches): 75.00% This was the biggest win for the model. Once we started using the Cumulative Performance Score — incorporating tournament form instead of relying solely on pre-tournament data — our predictive accuracy surged by over 15%.


- Overall Accuracy (104 Matches): 64.42% Across the entire tournament, the model correctly predicted the outcome of 67 out of 104 matches. It successfully mapped Spain’s tournament run all the way to lifting the trophy.

MY BIG TAKEAWAYS AS AN ASPIRING ANALYST
Building this project taught me that football analytics is not just about collecting data — it is about choosing the right data for the right context.
Static rankings (like FIFA ranks) are great for starting points, but in tournament football, momentum is king. The 15% leap in knockout stage accuracy showed me how critical it is for an analyst to dynamically adjust their assumptions based on live, real-time performance.
This project is just my first step. In the For now, these 104 spreadsheets represent my entry ticket into a world I’ve always wanted to be a part of. The numbers have spoken, and my journey to becoming a football analyst has officially begun.
You can check all the results here : https://drive.google.com/drive/folders/1qtMB30EmHmM5w5YqwZOMKlB0R_6lFajC?usp=sharing
메타데이터
- post_id
- e57a03383d0f
- slug
- predicting-the-unpredictable-how-i-built-a-statistical-model-for-world-cup-2026-and-what-it-e57a03383d0f
- url
- https://medium.com/@ilhamjati44/predicting-the-unpredictable-how-i-built-a-statistical-model-for-world-cup-2026-and-what-it-e57a03383d0f
- canonical_url
- https://medium.com/@ilhamjati44/predicting-the-unpredictable-how-i-built-a-statistical-model-for-world-cup-2026-and-what-it-e57a03383d0f
- author_url
- https://medium.com/@ilhamjati44
- status
- ok
- fetched_at
- 2026-08-10 08:02:46