Customer Segmentation: The Math Behind How Zomato Decides What to Show You
K-Means clustering explained through one of India’s most recognizable apps — how behavioral signals get grouped into personas and how those…
Customer Segmentation: The Math Behind How Zomato Decides What to Show You
K-Means clustering explained through one of India’s most recognizable apps — how behavioral signals get grouped into personas and how those personas drive every UI decision.
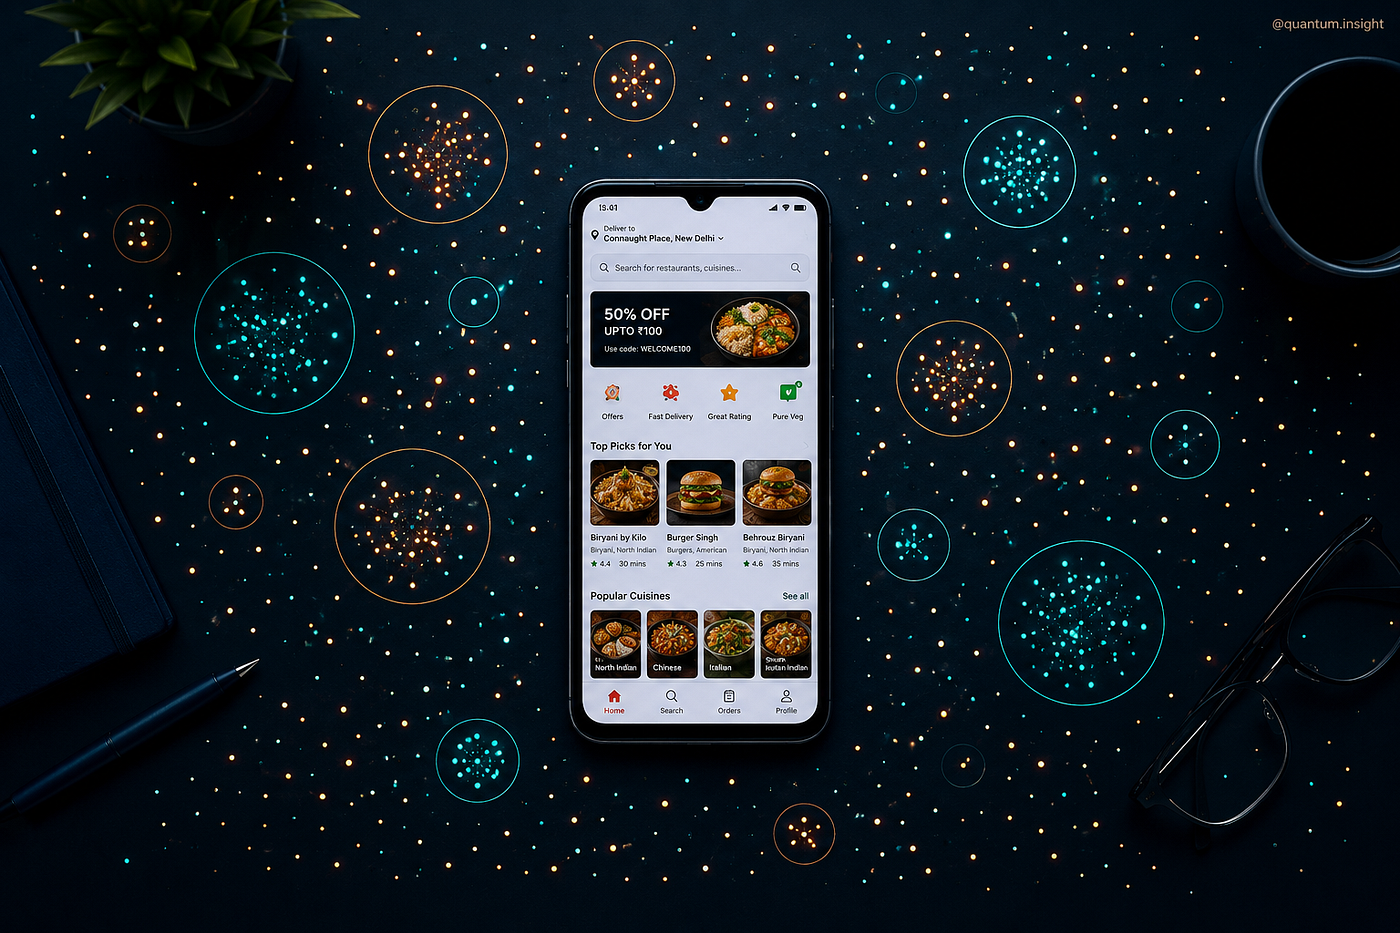
Open Zomato right now. Actually do it. Whatever’s on your home screen — that isn’t a coincidence. That’s a prediction. And behind that prediction is a very old algorithm doing something quietly elegant: deciding which version of you it’s talking to.
This isn’t about tracking you in the surveillance sense. It’s about a much older, more honest problem in business: you have millions of customers, and they don’t all want the same thing. Some are ordering biryani at 11 PM on a Friday. Some are searching for salads every Tuesday lunch. Some open the app, browse for seven minutes, and close it without ordering. These are not the same person, and treating them the same way is just expensive guessing.
Customer segmentation is how you stop guessing. And K-Means clustering is one of the cleanest mathematical tools to do it.
Start with the problem, not the algorithm
Here’s what Zomato actually knows about you. Every session, every tap, every abandoned cart, every re-order — it’s all logged. If you’ve used the app for six months, there are likely thousands of data points sitting in their pipeline. The question isn’t can we store this. It’s what do we do with it.
The naive answer: build a recommendation engine that treats every user individually. The problem with this is scale and cold data. Even with good collaborative filtering, you still need a way to initialize — to make a first guess about what someone wants before you have rich interaction history. That’s where clustering earns its place.
You group users into segments that behave similarly. Then you map those segments to product experiences. It’s not personalization in the deep, individual sense — it’s personalization at the archetype level. And it works surprisingly well.
What K-Means actually does
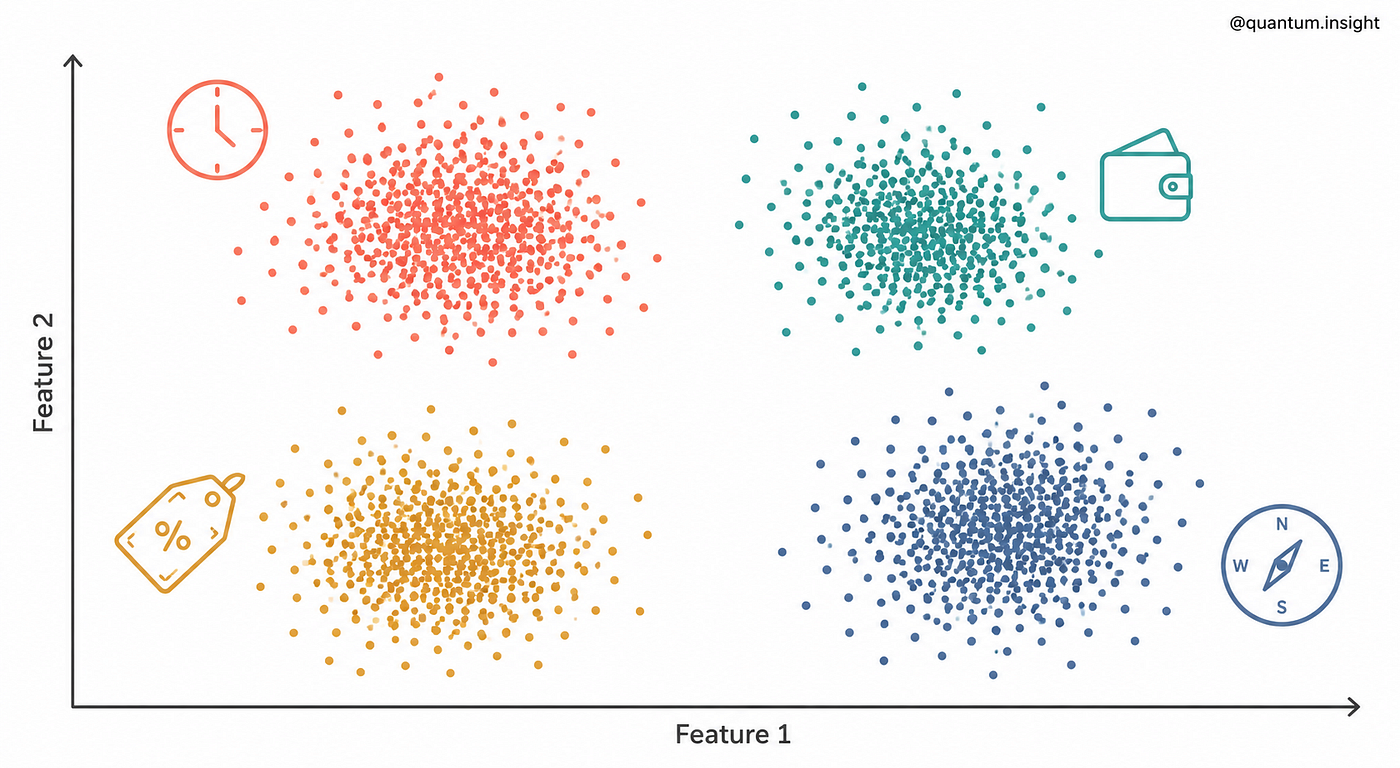
Strip away the data science vocabulary and here’s the core idea: given a bunch of points in space, find k natural groupings where points within each group are as similar as possible.
The “space” in Zomato’s case isn’t physical — it’s behavioral. Each user is a point defined by features like average order value, order frequency, time of day they order, cuisine diversity (do they always order from the same restaurant or explore a lot?), discount sensitivity (do they only order when there’s a coupon?), and session length versus conversion rate.
Take three of these dimensions and you can literally visualize a 3D scatter plot. Each dot is a user. K-Means finds the natural clusters in that cloud.
The math goes like this. You pick K — say, 5 clusters — and randomly place 5 centroids in that feature space. Then you run this loop:
1. Assign each user to the nearest centroid
distance(user, centroid) = √Σ(xᵢ - cᵢ)²
2. Recompute each centroid as the mean of its assigned users
new_centroid = mean(all points in cluster)
3. Repeat until centroids stop moving (convergence)
That’s Euclidean distance. The sum of squared differences across every feature dimension. It’s not exotic math — it’s the same formula you used in school to find the distance between two points, just extended to N dimensions instead of 2.
The algorithm doesn’t know what a “budget-conscious late-night user” is. It just finds that some users cluster tightly together in feature space. You’re the one who looks at that cluster and gives it a name.
This is an important distinction. K-Means is unsupervised — it doesn’t have labels. You don’t tell it “find the foodies.” It finds mathematically dense regions, and then a human analyst looks at the cluster’s average feature values and makes sense of them. The naming is ours. The geometry is the algorithm’s.
The features Zomato probably cares about
Pure speculation on my part — but informed speculation, because the choice of features is where the real product thinking lives. Here’s what I’d bet they’re using, or something close to it:
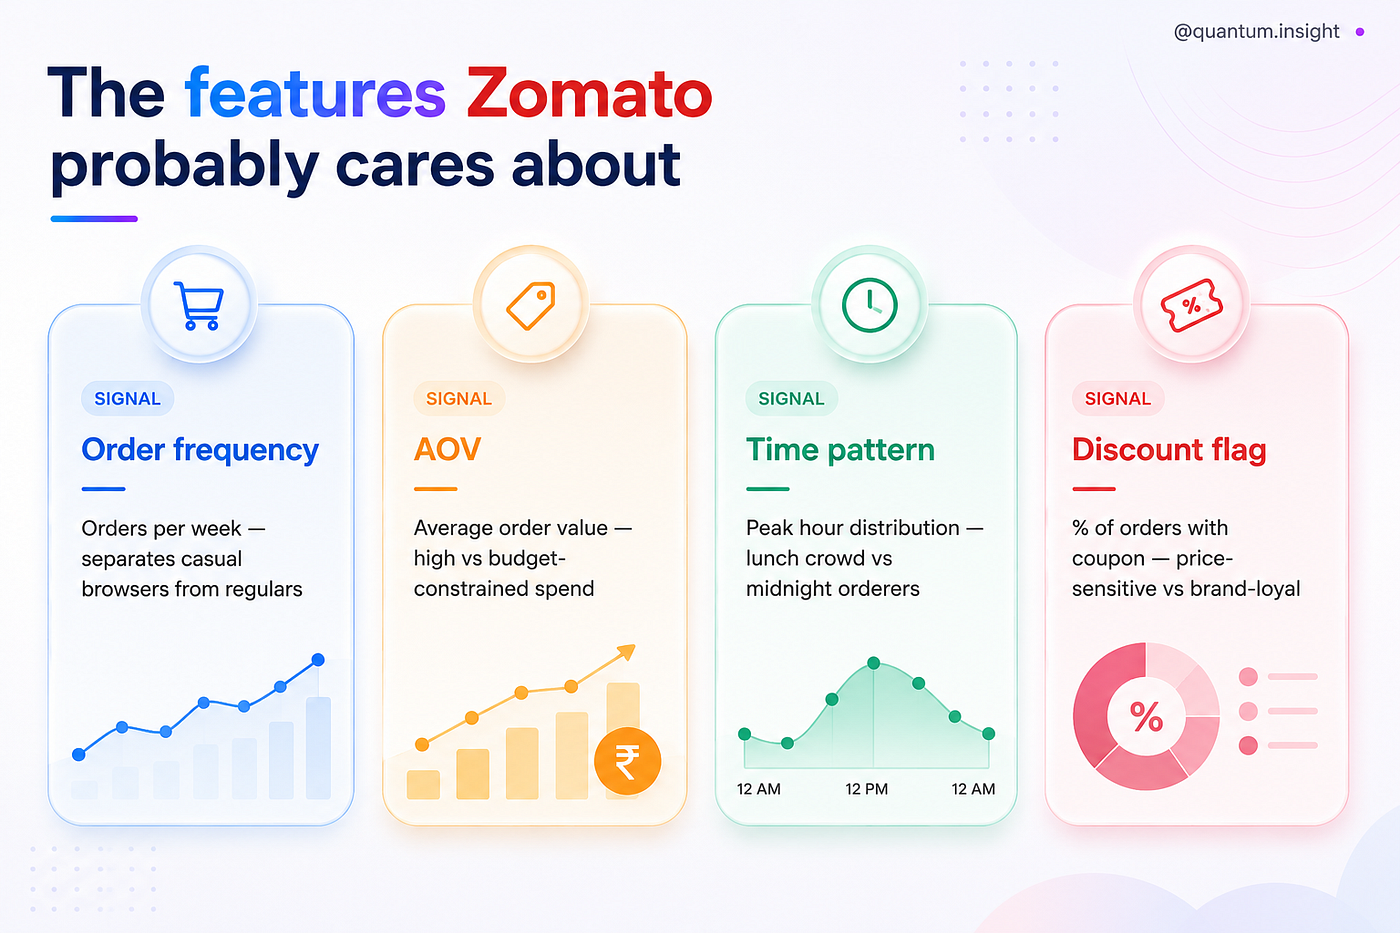
Each of these needs to be normalized before K-Means touches them. Order frequency might range from 0–30 orders a month. AOV might range from ₹100–₹2,000. If you throw raw numbers into the distance calculation, AOV drowns everything else out just because its scale is larger. So you standardize — typically to a mean of 0 and standard deviation of 1. Now every feature contributes equally to the distance math.
The output: archetypes that drive product decisions
Here’s where it gets interesting from a product perspective. Once you’ve run K-Means and stabilized your clusters, you end up with something like this:
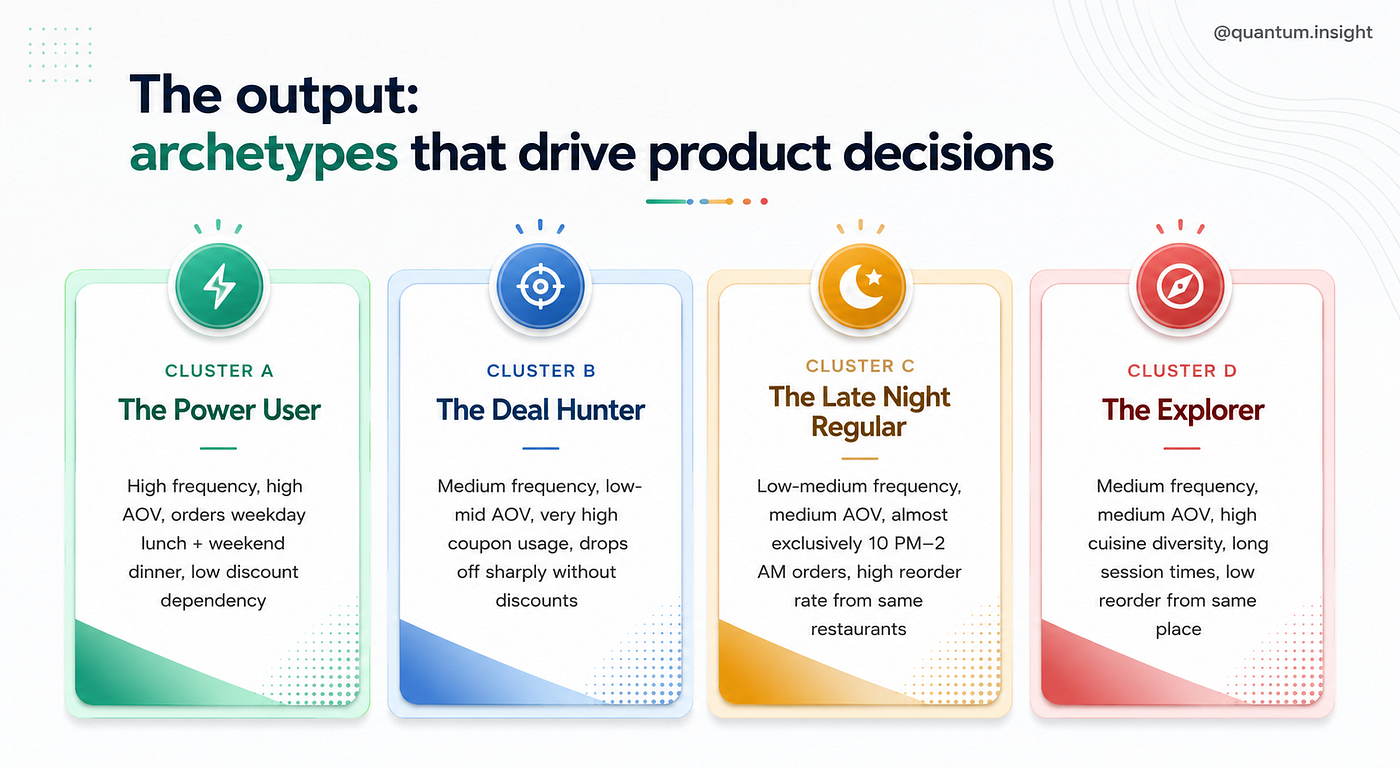
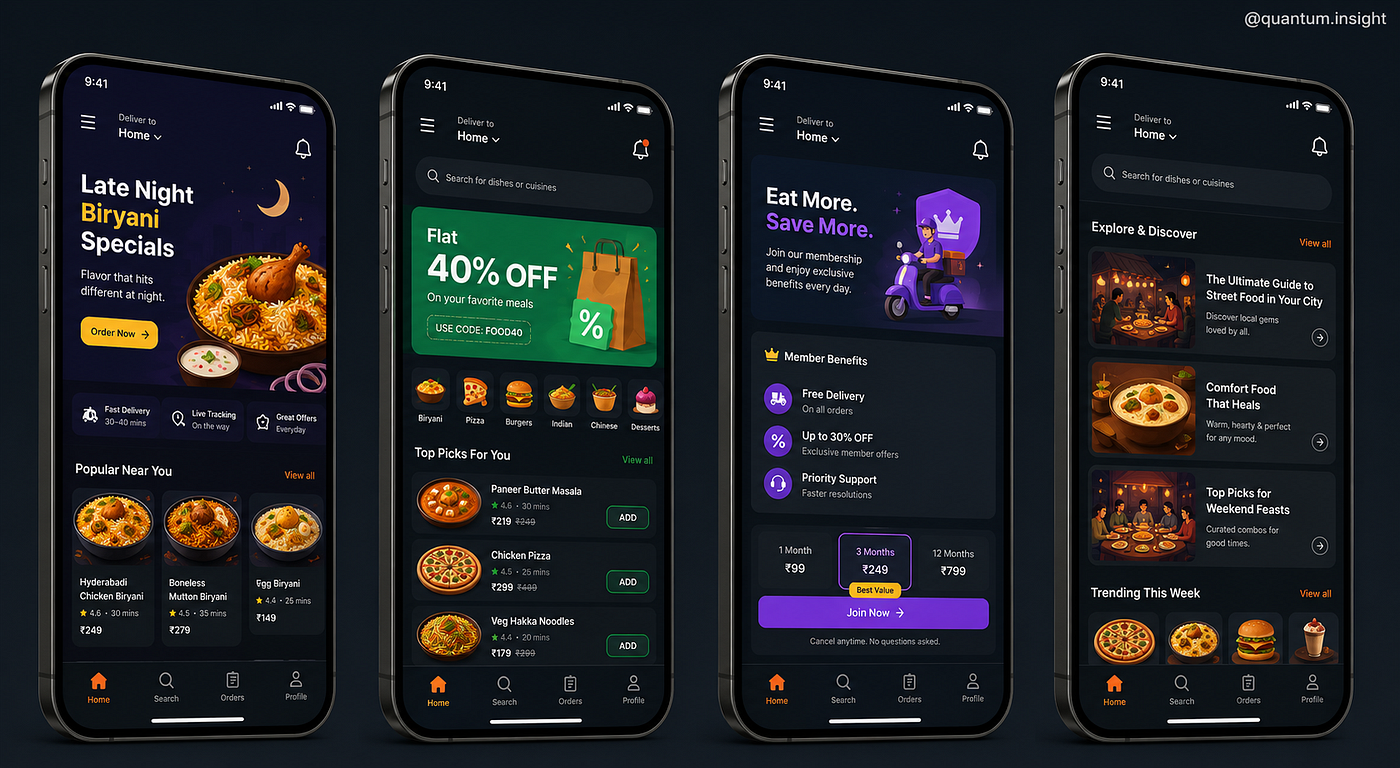
Now look at what the product team can do with this. Cluster A (Power Users) probably gets the Zomato Gold / Pro pitch — they’re already spending, so lock them in with a subscription and give them priority delivery. Cluster B (Deal Hunters) gets promotional banners front and center, because that’s literally what moves them. Cluster C gets the late-night category prominently surfaced, and the app’s home screen reordering at 11 PM. Cluster D gets editorial-style discovery — “trending in your city,” new openings, cuisine exploration prompts.
Every UI decision maps back to a cluster property. The home screen isn’t one screen. It’s four or five screens, served dynamically.
The hard problem: choosing K
Nobody tells you how many clusters to use. This is genuinely one of the most judgment-heavy decisions in the whole process, and papers have been written about it. The standard approach is the elbow method.
You run K-Means for K = 2, 3, 4… up to some reasonable ceiling. For each K, you calculate the Within-Cluster Sum of Squares (WCSS) — the total squared distance from every point to its centroid. As K increases, WCSS drops (more clusters means each one is tighter). Plot WCSS against K and you’ll usually see a curve that bends sharply at some point — that bend is your “elbow,” and it suggests the K where adding more clusters stops buying you much.
In practice, you also want business interpretability. Eight clusters might minimize WCSS better than five, but if your marketing team can’t meaningfully differentiate between cluster 6 and cluster 7, the extra segments add complexity without operational value. The algorithm gives you candidates. Humans pick what’s actionable.
What K-Means gets wrong (and how Zomato likely compensates)
K-Means assumes clusters are roughly spherical — equal variance in all directions. Real user behavior doesn’t always cooperate. Some segments are elongated, or weirdly shaped in feature space. In those cases, algorithms like DBSCAN or Gaussian Mixture Models do better. But K-Means scales to hundreds of millions of users in a way that those methods don’t, which is why it remains the workhorse.
Zomato also deals with drift. You as a user today are not the same as you were six months ago. Behavioral clusters need to be re-run periodically, and users need to be reassigned as their patterns shift. A user who was a Deal Hunter in their student years might graduate into a Power User. The segment isn’t a permanent label — it’s a current best estimate.
And then there’s the cold start problem. New users have no behavioral history, so you can’t cluster them meaningfully at first. Zomato handles this with onboarding signals (location, cuisine preferences you pick on signup, first order behavior) and by defaulting to city-level popularity until there’s enough data to place you in a segment properly.
Why this matters beyond Zomato
Customer segmentation via clustering is one of those techniques that looks obvious in hindsight but took serious mathematical infrastructure to deploy at scale. The fact that your phone screen now anticipates what you want before you’ve consciously decided — that’s not magic. That’s K-Means running on a few behavioral features, a normalization step, and a human team that translated cluster centroids into product decisions.
The next time Zomato’s home screen feels like it’s reading your mind, it isn’t. It’s just solved a geometry problem about which neighborhood of user-space you live in. And then it served you the menu for that neighborhood.
That’s a remarkably small amount of math to feel this personal.
메타데이터
- post_id
- e58dfc468fc3
- slug
- customer-segmentation-the-math-behind-how-zomato-decides-what-to-show-you-e58dfc468fc3
- url
- https://medium.com/@quantum.insight/customer-segmentation-the-math-behind-how-zomato-decides-what-to-show-you-e58dfc468fc3
- canonical_url
- https://medium.com/@quantum.insight/customer-segmentation-the-math-behind-how-zomato-decides-what-to-show-you-e58dfc468fc3
- author_url
- https://medium.com/@quantum.insight
- status
- ok
- fetched_at
- 2026-06-21 19:25:17