Understanding a Real-World Batch Data Pipeline
When I first started learning Data Engineering concepts, I thought a data pipeline was something simply moving data from one place to…
Understanding a Real-World Batch Data Pipeline
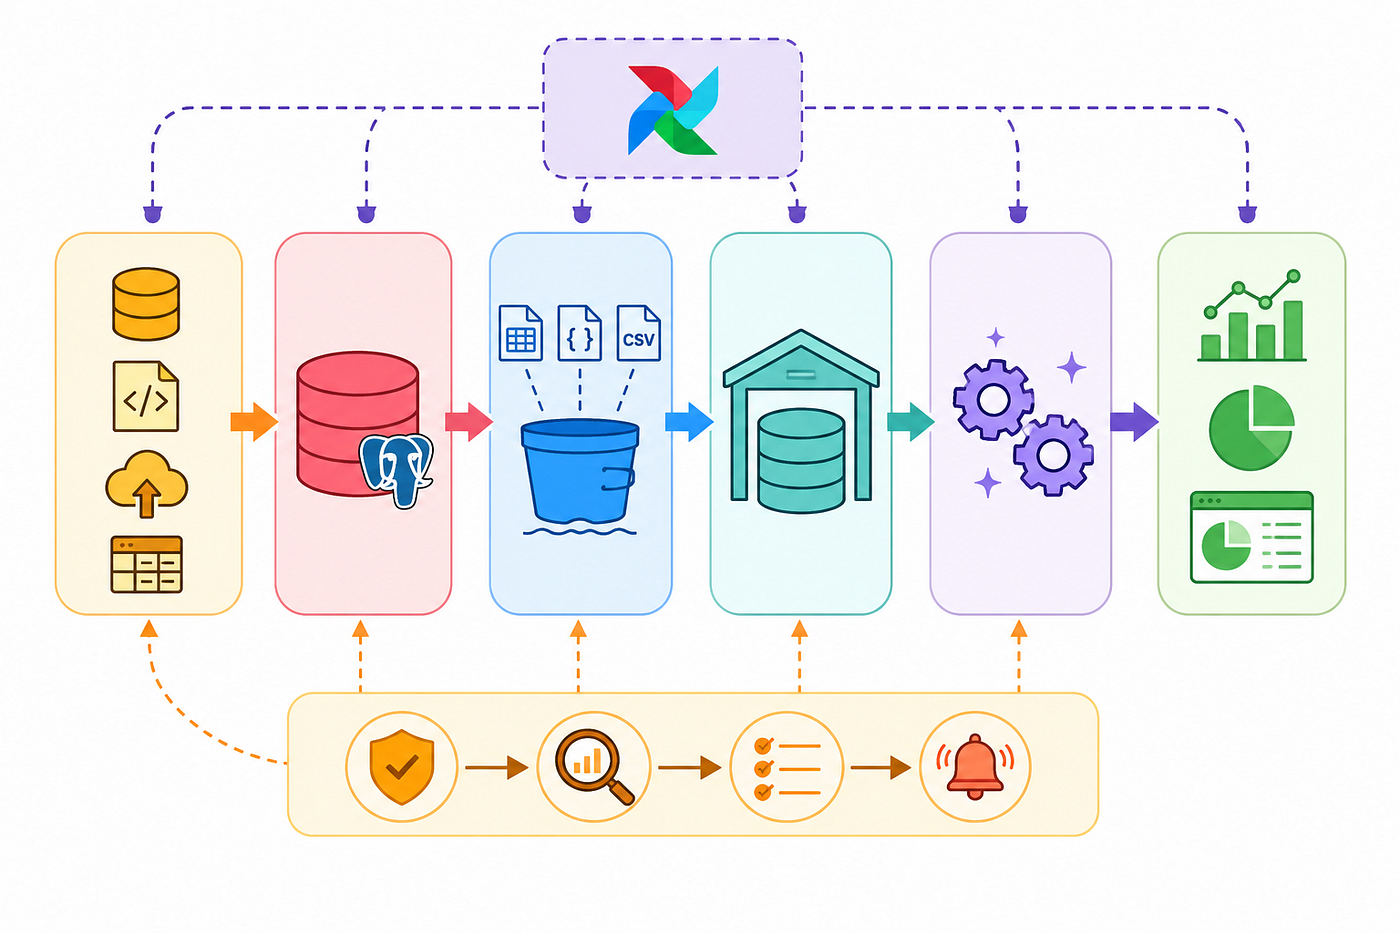

When I first started learning Data Engineering concepts, I thought a data pipeline was something simply moving data from one place to another.
After starting my internship, I quickly realised that real-world data platforms are much more complex than simply loading CSV files into a database. Concepts such as data warehousing, staging layers, orchestration, data quality checks, and workflow automation play a crucial role in building reliable data systems.
To deepen my understanding of these concepts, I decided to build my own batch data pipeline project from scratch. Through this hands-on experience, I gained practical insights into how data moves through different layers of a pipeline, from raw source files to a structured data warehouse designed for analytics.
In this article, I’ll walk through the overall architecture of the project and share the key lessons I learned about how a modern batch data pipeline works, using a simple example that helped me connect theory with real-world practices.
A Real-World Scenario
Imagine we own an online clothing store.
Every day thousands of activities happen:
- New customers register, Customers update their profiles, Orders are placed, Payments are processed, Products are added or updated
All of these actions generate data.
This operational data is typically stored in application databases such as PostgreSQL, MySQL, or SQL Server.
These databases are designed to support day-to-day business operations. Their primary purpose is handling transactions quickly and reliably.
This type of workload is called OLTP (Online Transaction Processing).
Examples: Creating orders, Updating customer details, Processing payments
Why Not Run Analytics Directly on Operational Databases?
Business teams also want answers to questions such as:
- Which products generated the most revenue?
- Which cities have the highest number of customers?
- What were yesterday’s sales?
Operational databases are designed to handle day-to-day business transactions efficiently. If large analytical queries are run directly on these systems, they can consume significant resources such as CPU, memory, and disk I/O, leading to slower transaction processing and a poor user experience for customers and employees.
For example, imagine an e-commerce platform processing customer orders. If a complex sales analysis query is executed on the same database during peak hours, it may slow down order processing, resulting in delays that can negatively affect business operations and customer satisfaction.
Therefore to separate operational workloads from analytical workloads, organisations move data into analytical platforms.
Step 1: Landing Data in a Data Lake
The first destination is often a Data Lake.
Examples include: Amazon S3, Azure Data Lake Storage, Google Cloud Storage
A Data Lake stores large volumes of raw data at low cost.
Data may arrive in many formats: CSV, JSON, Parquet, Logs, API responses
At this stage, the goal is usually to preserve the original data.
Step 2: Loading Data into a Data Warehouse
Data is then loaded into a Data Warehouse.
Examples include: Snowflake, Amazon Redshift, Google BigQuery, Azure Synapse, Databricks SQL Warehouse
The first stop inside the warehouse is typically a staging layer.
Examples: stg_customers, stg_products, stg_orders
These staging tables act as a landing zone for incoming data before business transformations are applied.
Step 3: Transforming the Data
Once data is available in staging tables, transformation logic is applied.
Examples: Cleaning invalid records, Standardising formats, Joining multiple datasets, Calculating business metrics
The transformed data is then loaded into dimensional models.
Step 4: Building Fact and Dimension Tables
A common modelling approach is the Star Schema.
Dimension tables contain descriptive information.
Examples: dim_customers ,dim_products
Fact tables contain measurable business events.
Example: fact_orders
Dimension tables usually contain surrogate keys (dimension keys) that uniquely identify each business entity.
Fact tables reference those dimension keys and store measurable metrics such as: Quantity sold, Revenue, Order counts
This structure makes analytics fast and easy to understand.
OLTP vs OLAP
At this point we can clearly see the difference.
OLTP systems focus on: Fast inserts, Fast updates, Daily business operations
OLAP (Online Analytical Processing) systems focus on: Aggregations, Reporting, Dashboards, Analytics
-> Operational databases support OLTP.
-> Data Warehouses support OLAP.
ETL vs ELT
Historically, organisations followed ETL:
Extract → Transform → Load
Data was transformed before entering the warehouse.
Today, modern cloud warehouses are powerful enough to perform transformations internally.
Because of this, many organizations now use ELT:
Extract → Load → Transform
Data is loaded first and transformed afterward.
Incremental Loading
In production systems, reloading all data every day is inefficient.
Instead, most pipelines use incremental loading.
Only new or changed records are processed.
Benefits include: Faster execution, Lower cost, Reduced resource consumption
Automating Pipelines with Airflow
Running every pipeline step manually is not practical.
Workflow orchestration tools such as Apache Airflow allow us to automate the entire process.
Airflow can schedule and manage tasks such as:
- Extracting data
- Loading staging tables
- Running transformations
- Executing quality checks
I have discussed Apache Airflow and its role in data pipeline orchestration in more detail in a separate article. You can read it here: (link)
Making Pipelines Portable with Docker
A common challenge is that code works on one machine but fails on another.
Docker solves this problem by packaging applications, dependencies, and configurations into containers.
This ensures the pipeline behaves consistently across environments.
Since Docker and containerization play a significant role in deploying and managing data pipelines, they deserve a dedicated discussion. I have explore these concepts in a separate article. You can read it here: (link)
Final Thoughts
Building my first batch data pipeline helped me understand how data moves through modern analytical systems. While learning concepts through tutorials is valuable, implementing them in a real project provides a much deeper understanding.
One of the biggest lessons I learned is that building something yourself is one of the most effective ways to learn. It helps connect individual concepts and shows how they work together in a complete system. This project gave me practical experience with data ingestion, orchestration, containerization, and storage, while also strengthening my understanding of modern data engineering workflows.
메타데이터
- post_id
- e63a688cc980
- slug
- understanding-a-real-world-batch-data-pipeline-e63a688cc980
- url
- https://medium.com/@chanithivrasnakawewa/understanding-a-real-world-batch-data-pipeline-e63a688cc980
- canonical_url
- https://medium.com/@chanithivrasnakawewa/understanding-a-real-world-batch-data-pipeline-e63a688cc980
- author_url
- https://medium.com/@chanithivrasnakawewa
- status
- ok
- fetched_at
- 2026-06-11 21:11:36