Machine Learning Series (Part 33) : Understanding Odds, Log Odds and Odds Ratio for Logistic…
Hey readers! We had seen about linear regression, its working, different error measures and the way to constrain the error by the…
Machine Learning Series (Part 33) : Understanding Odds, Log Odds and Odds Ratio for Logistic Regression

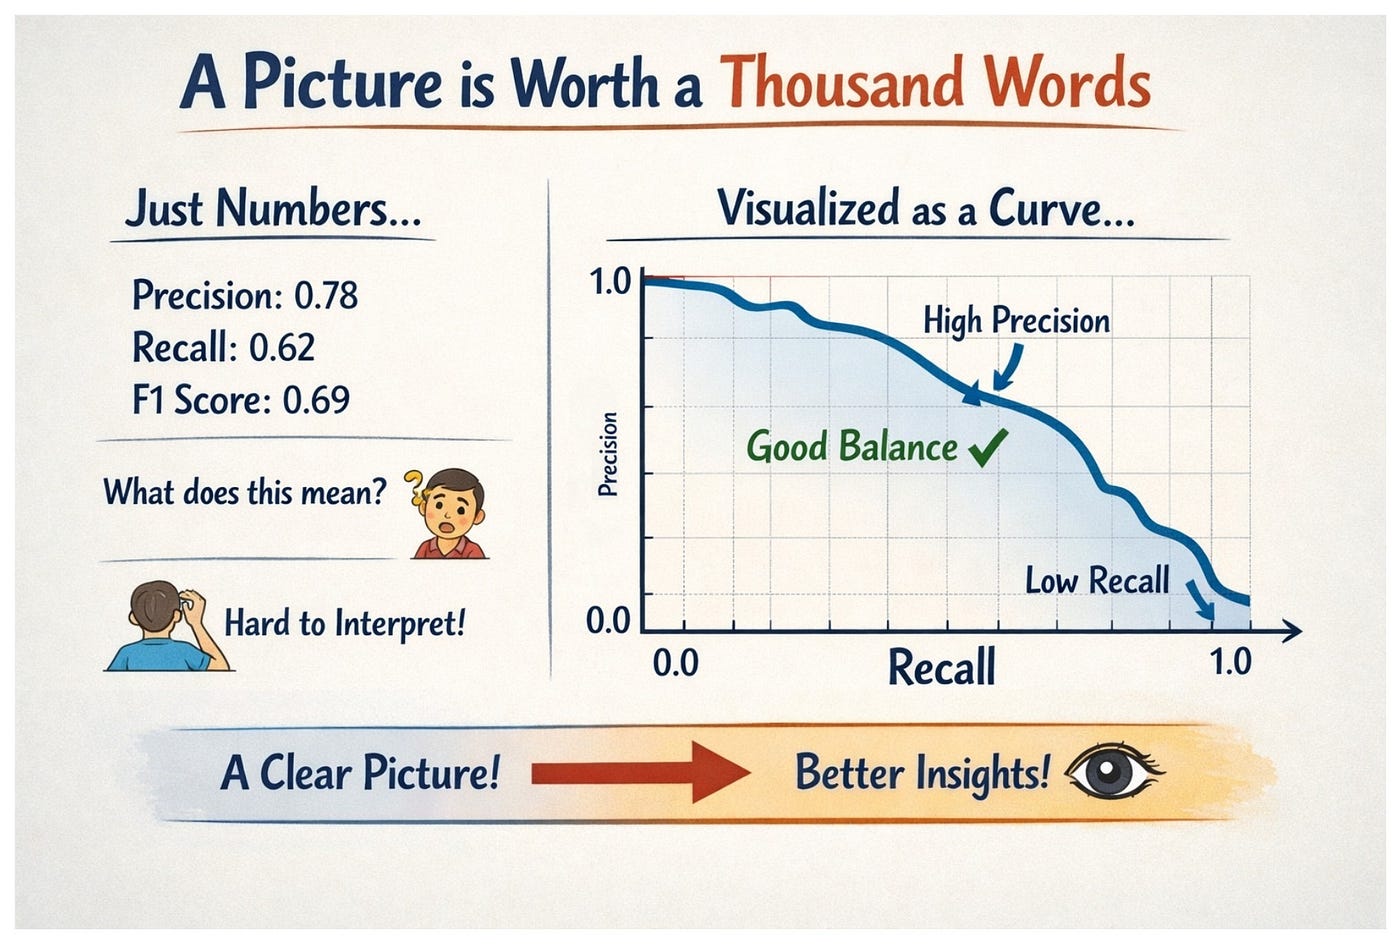
Image Courtesy : ChatGPT
Hey readers! We had seen about linear regression, its working, different error measures and the way to constrain the error by the regularization methods. We also had explored a lot on various classification algorithms and the various evaluation metrics associated with classification in ML. Today we are going to talk about logistic regression. As the name contains the word ‘regression’, you might wonder that it is yet another algorithm for regression, that is to predict a continuous value like linear regression. But NO! Logistic regression is used for classification. Though the working of logistic regression might resemble linear regression, the objective of this algorithm is majorly used for classification. In a nutshell, logistic regression estimates the probability that a particular instance belongs to the classes present. We shall look into its working more clearly. But as an initial phase, I want you all to know about ‘odds’. Suppose before a cricket match someone says, “The odds of CSK winning are 3:1.” This means that for every 1 situation where CSK loses, there are 3 situations where CSK wins. Notice that this is different from saying the probability is 75%.
In our day-to-day conversations, we often use the words odds and probability interchangeably. But mathematically, they are different. Probability compares favourable outcomes with all possible outcomes, whereas odds compare something happening with something not happening. Let’s see what the odds are!
Assume that we have a coin. The probability that the coin shows head or tail when tossed is ½.
But the odds is 1/1= 1
Similarly, out of 7 days in a week, let’s say 3 days got rain, so the probability of the days getting rain is 3/7
But the odds here is 3/4.
Now in the above cases we saw probability which said

In the first case, the chance that head could show up is one (out of the two outcomes — heads or tails) which is represented by the numerator — no. of favourable outcomes and the denominator represents the total no. of possible outcomes.
Similarly in the second case, the chances that days could have rain are 3 ( no. of days with rain are our favourable outcome here) and the total no. of outcomes is 7 (as there are 7 possible days).
But when you observe odds,

Look back and notice that odds say the ratio of something that is happening to something not happening instead of everything that could happen as like probability.
We have learnt in our lower classes that the sum of probabilities equals 1. Which means in this case, the probability of something happening + probability of something not happening = 1
We can apply this to the coin toss and assume that we require heads. The probability of heads occurring is ½ and the probability of heads not occurring is also ½. In this case, the probability of heads not occurring is nothing but the probability of the other element which is tails. In short, probability of tails denote the probability of heads not occurring.
If we observe here, the sum of probabilities equals 1.

In the above the probability of not occurring which is ½ can be obtained by subtracting the probability of occurring from 1.
p + p’ = 1
where p’ = 1 - p

So based on this if we substitute in the odds formula


which matches with the answer that we get through

Why the odds are important to know is because they play an important role in logistic regression.
Having found what are odds and how it is calculated, let’s see the log of odds. The log of odds is nothing but the log function applied to the odds.

The reason why we use log (odds) is that it reduces the asymmetrical structure of the data. The reason we apply the log function to odds is that odds range from 0 to ∞, while the log of odds converts this into values ranging from −∞ to +∞. This transformation makes it easier to model using a linear equation.
Note: Odds are ratio but ‘Odds ratio’ is different from the odds. The ratio of odds is known as the ‘Odds ratio’. In simpler words, when we divide two odds, it is called the ‘Odds ratio’.
Here as well, we can apply the log function to the ‘Odds ratio’ to avoid asymmetrical distribution.
But what is the purpose of the odds ratio or the log(odds ratio)? Well, it tells the measure of the relationship between two variables. How strong or weak two variables are.
Let us go through an example of a contingency table which follows the structure of a confusion matrix but is used for measuring relationships between variables rather than evaluating model predictions.

Using the above table, we shall calculate the odds ratio. The sum of all the entries in the above table gives 1000 i.e thousand people are classified as obese or not based on their sleep measure.
From the above table, we can see that 250 of them are obese:

750 of them do not have obesity.

Similarly 300 people are having a lack of sleep.

And by now you would have guessed the next, 700 of them have good sleep time.

By calculating the odds ratio, we can figure out if there is any relationship between lack of sleep and obesity. We can find out the answer for the questions like if someone has lack of sleep, are there any odds of having obesity?
From the contingency table, firstly let’s find what are the odds that someone will become obese if there is lack of sleep. Applying our odds formula here.
So, it becomes


Similarly, let’s find out what are the odds that someone will be obese if there is proper sleep.
It becomes


Now, let’s find the ratio of the odds.

Solving the above we get,

This odds ratio value conveys that the odds are 15 times greater that someone with lack of sleep will be obese. And when we apply the log function to the above odds ratio, we get

In our part 22 of our series, we had seen about the R² score. Whatever we have found above is similar to the R² score, the odds ratio and the log(odds ratio) tell how strong a relationship is between two variables. Larger odds ratio values indicate a stronger association between the variables. I hope you all understood what odds are, the log of odds and odds ratio. In the next part we shall see about the line of fit that happens for a data in logistic regression.
메타데이터
- post_id
- e6f7d4f789b5
- slug
- machine-learning-series-part-33-understanding-odds-log-odds-and-odds-ratio-for-logistic-e6f7d4f789b5
- url
- https://medium.com/@yogeswariyrsk/machine-learning-series-part-33-understanding-odds-log-odds-and-odds-ratio-for-logistic-e6f7d4f789b5
- canonical_url
- https://medium.com/@yogeswariyrsk/machine-learning-series-part-33-understanding-odds-log-odds-and-odds-ratio-for-logistic-e6f7d4f789b5
- author_url
- https://medium.com/@yogeswariyrsk
- status
- ok
- fetched_at
- 2026-06-24 23:31:39