Gold Isn’t Done Yet: Why One More Explosive Move May Come Before the Big Pause
Everyone seems to be waiting for gold to cool off.
Gold Isn’t Done Yet: Why One More Explosive Move May Come Before the Big Pause
Everyone seems to be waiting for gold to cool off.
After a move like this, that’s the obvious call: consolidation comes next.
But markets don’t usually reward what’s obvious.
Right now, the setup looks less like a top — and more like a pause before another leg higher.
Gold and Silver at a Critical Inflection Point
Gold and silver appear to be approaching a decisive moment in their ongoing bull market. Many analysts draw parallels with the 1970s–1980s cycle, using that period as a benchmark to interpret today’s price action. Their focus is largely on the broader trend structure — identifying long-term trendlines and anticipating ideal entry points. They expect both metals to enter a multi-month consolidation phase before resuming their higher levels.
While I also consider the 1970s analog relevant, I arrive at a different conclusion: the market may not yet be ready for prolonged consolidation. Instead, I believe gold and silver are preparing for one more impulsive move higher into the summer, after which a broader consolidation phase is more likely to begin.
The Big Picture in Gold
First, the trend is undeniable.
Gold continues to print higher highs and higher lows across the quarterly and monthly timeframes — classic bull market behavior.
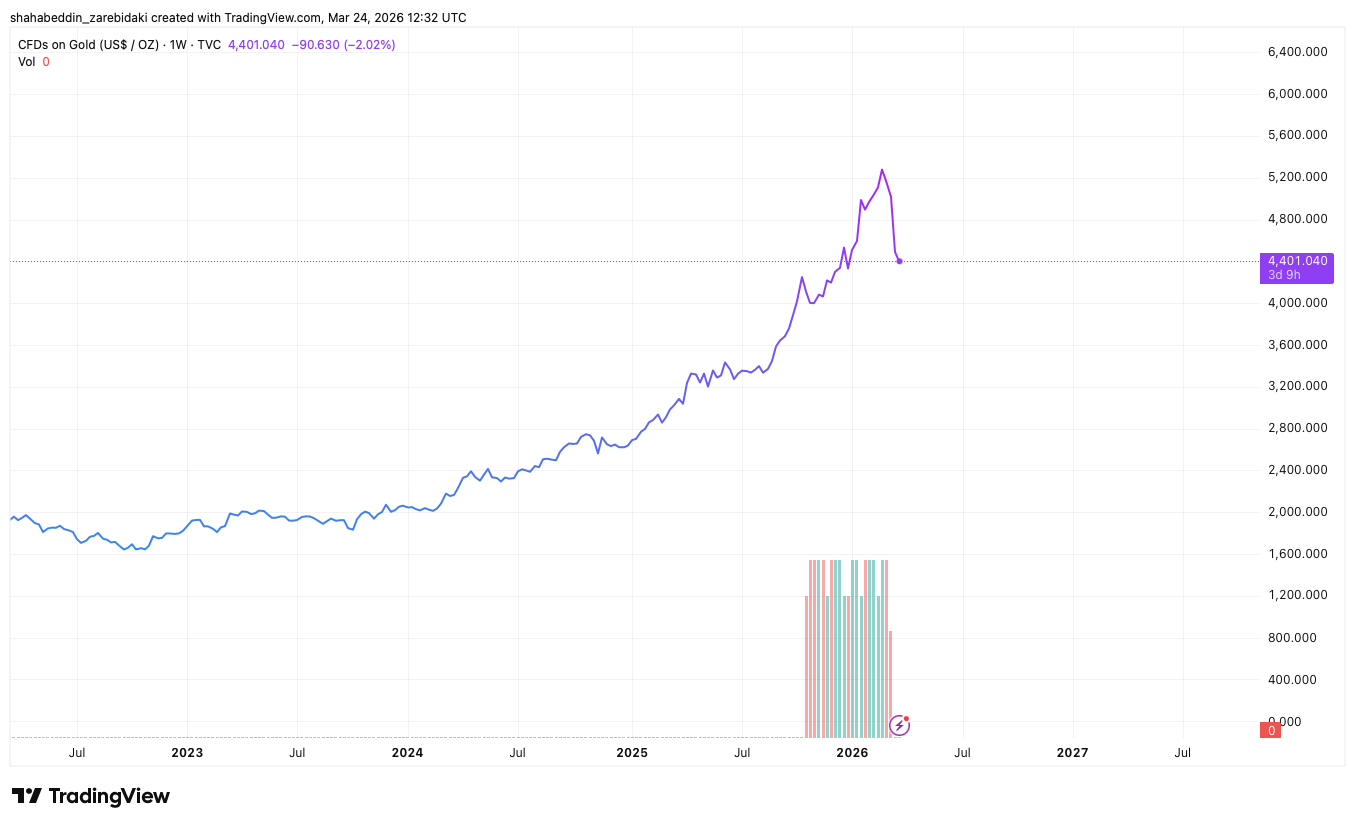
Recent price action in gold shows a structure remarkably similar to historical patterns observed during previous bull phases.

Some analysts argue that we are currently in a “late-stage” zone, implying that a meaningful correction is imminent (see the 1973 benchmark blue zone in the chart below).

However, a shift to the weekly timeframe provides a different perspective. Before gold’s reaching 190$ level in 1974, the market experienced several weeks of correction within the first leg of a parabolic advance. This suggests that short-term pullbacks do not necessarily signal the end of the trend, but rather its maturation.

A Cycle-Based Perspective
My primary argument for continued upside is rooted in cycle analysis.
Gold has historically exhibited a recurring 7–8 year cycle (trough to trough). This pattern has held with notable consistency:
- The previous cycles began around Autumn 2015
- It bottomed around Autumn 2022
- The current cycle, I expect, is therefore likely to extend into Autumn 2029

If this framework holds, we are still in the early-to-mid phase of the current cycle, with sufficient time for further upside before any prolonged consolidation.
Looking back, gold took approximately 4 years and 9 months (around 245 weekly candles) to reach its peak from the 2015 low, topping in August 2020. Applying a similar duration to the current cycle suggests a potential peak around mid-to-late 2026, aligning closely with a summer timeframe.

Historical Analogy: The 1973 Correction
To deepen the comparison, consider the correction in May 1973:
- Gold declined from $127 to $90
- This represented a retracement close to the 0.618 Fibonacci level on the weekly chart
- It touched the 200 daily moving average and moved back higher
In contrast, the current cycle shows:
- A move down to approximately $4100
- A retracement toward the 0.886 Fibonacci level
- A strong and rapid recovery, with price recently trading around $4480
- 200 daily moving average touch and hypothetically started its move higher
Following the 1973 correction, gold rallied sharply:
- It reached $180, paused briefly,
- Then completed its cycle peak at $196 (near the 2.618 Fibonacci extension) in December 1974
That final leg unfolded over 56 weekly candles, marking a prolonged bull cycle.
Technical Structure and Price Projection
At present, gold appears to be forming a bullish flag pattern, characterized by a descending channel pattern within an overall uptrend. If this structure resolves to the upside — consistent with historical analogs — the implications are significant.

Assuming a comparable magnitude to the 1970s move, a reasonable projection places the cycle top near $8,000.
Supporting factors include:
- Strong adherence to historical cycle behavior
- Typical weekly cycle durations of 25–30 weeks (trough to trough)
- Favorable timing alignment pointing toward September 2026 as a potential peak window
Admittedly, external factors — current, particularly geopolitical instability — could extend or distort this cycle. Nonetheless, the structural and cyclical evidence support a continued bullish trajectory in the near term.
Silver: A Lagging Giant?
An additional observation worth noting is the parallel between silver today and gold in the 1970s. Silver’s current price behavior resembles the early stages of gold’s explosive move during that decade.
However, silver introduces a unique dynamic:
- It has spent nearly 45 years in a broad basing structure
- Such prolonged consolidation often precedes outsized breakout moves
For this reason, it is plausible that silver’s eventual upside could exceed the relative magnitude of gold’s 1970s performance.
Final Thoughts
While consensus points toward an imminent consolidation phase, cycle dynamics and historical analogs suggest otherwise. The market may first deliver one final acceleration phase into summer 2026, potentially culminating in a cycle top later that year.
In this context, short-term corrections should be viewed less as trend reversals and more as continuation structures within a broader bullish framework.
메타데이터
- post_id
- e6f93ce1b82d
- slug
- gold-isnt-done-yet-why-one-more-explosive-move-may-come-before-the-big-pause-e6f93ce1b82d
- url
- https://medium.com/@shahabzare/gold-isnt-done-yet-why-one-more-explosive-move-may-come-before-the-big-pause-e6f93ce1b82d
- canonical_url
- https://medium.com/@shahabzare/gold-isnt-done-yet-why-one-more-explosive-move-may-come-before-the-big-pause-e6f93ce1b82d
- author_url
- https://medium.com/@shahabzare
- status
- ok
- fetched_at
- 2026-07-15 20:14:52