I Ran the Amazon Last-Mile Routing Challenge on a Raspberry Pi 400
Routing 1 million stops and 2.5 million packages across 17 depots on a $70 4GB RAM microcomputer in 10 hours, proves high-volume…
I Ran the Amazon Last-Mile Routing Challenge on a Raspberry Pi 400
Routing 1 million stops and 2.5 million packages across 17 depots on a $70 4GB RAM microcomputer in 10 hours, proves high-volume optimization doesn’t require expensive cloud infrastructure, just the right architecture.
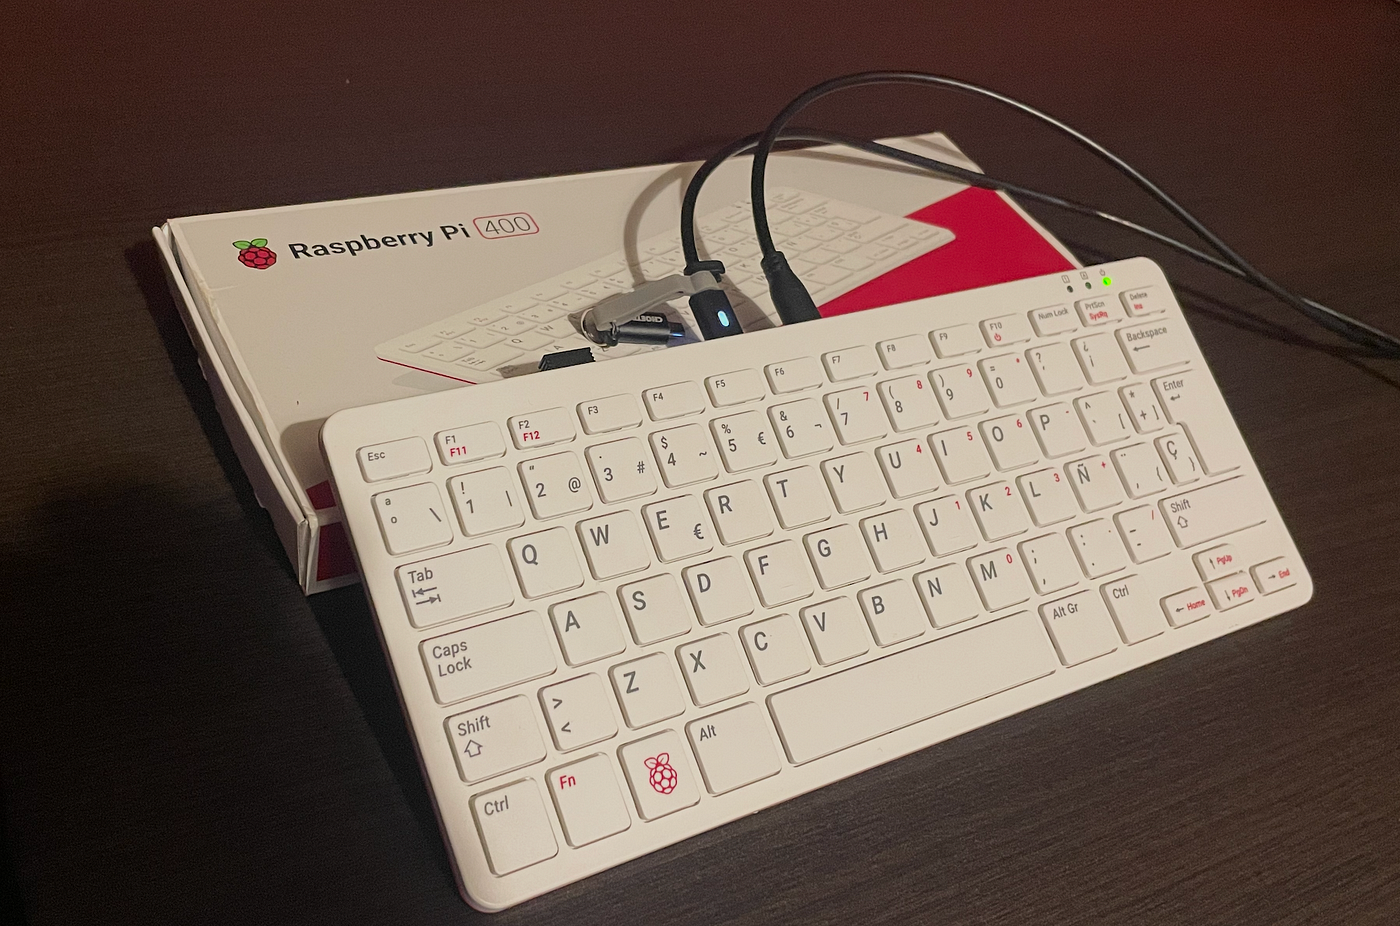
The entire Amazon Last-Mile Routing Challenge dataset running on a Raspberry Pi 400 (Quad-core, 4GB RAM).
1. The experiment
A few weeks ago, I published two experiments about large-scale last-mile route optimization.
The first compared my optimizer against the public Amazon Last Mile Routing Challenge routes and showed that the system could reduce total distance and route count while running on a laptop.
The second showed that a routing engine could process one million stops with near-linear scaling on commodity hardware.
Those experiments had one central idea: Large-scale routing should not require expensive infrastructure, hard request caps, or manual pre-zoning before the optimizer can even start.
So I took the public Amazon Last Mile Routing Challenge dataset and ran the full planning pipeline on a Raspberry Pi 400: a keyboard computer with 4GB of RAM.
The point was to test whether the routing architecture itself could survive being pushed down to the smallest reasonable hardware.
Not a server. Not a GPU. Not a cloud cluster. A Raspberry Pi.
2. What this experiment is really about
Most routing systems are built on a quiet assumption: large-scale optimization requires large infrastructure.
This experiment is not about Raspberry Pi performance. It is about architectural pressure.
A Raspberry Pi 400 has 4GB of RAM, a low-power ARM CPU, and a microSD card for storage. There is almost no room for brute force. The optimizer does not depend on a large shared solver state, excessive memory, or heavyweight centralized computation.
That is exactly why this hardware matters as a benchmark. If the Amazon Last Mile dataset can be planned on a machine this constrained, then the limiting factor in routing is not hardware. It is how the computation is organized.
3. The Hardware
To put this experiment into perspective, we are benchmarking our VRP algorithm across two opposite ends of the modern ARM64 spectrum.
The Constrained Environment Component: Raspberry Pi 400 CPU: Quad-core ARM Cortex-A72 @ 1.8GHz RAM: 4GB LPDDR4 Storage: microSD card Estimated hardware cost: ~$70 unit / ~$100 kit
The ‘High’ Performance Hardware Component: MacBook Pro M4 CPU: 14-core Apple M4 RAM: 48GB Unified Memory Storage: Ultra-fast PCIe NVMe SSD Estimated hardware cost: ~$2,500+ USD
If our optimization engine can resolve complex routing challenges under the severe computing, memory, and I/O bottlenecks of a Raspberry Pi, it can scale efficiently anywhere.
4. The Amazon Dataset
For anyone coming to this experiment without the previous article, some context matters.
The Amazon Last Mile Routing Research Challenge is a public dataset released by Amazon and MIT, based on real delivery operations across five major US metropolitan areas: Los Angeles, Seattle, Chicago, Boston, and Austin. It contains 6,112 historical routes, over one million stops, and more than 2.5 million packages, organized across 17 depot stations.
This is not a synthetic benchmark. These are actual Amazon delivery routes, with real geographic coordinates, real package dimensions and weights, real vehicle capacities, and real time-window constraints for a subset of stops.
The challenge it poses is not just scale. It is the combination of scale with operational reality: vehicles have capacity limits, packages have sizes, some customers have delivery windows, and routes need to be geographically coherent enough for a driver to actually follow them.
The optimizer was run against this dataset with a specific goal: improve on Amazon’s reported routes without relaxing any of the constraints. Same fleet composition. Same vehicle capacities. Same package volumes. Same time-window requirements. The only objective was to do more with the same resources: fewer total kilometers, fewer routes, higher vehicle utilization, and equal or better time-window compliance.
The results from that experiment: roughly 15–20% less total distance, 10–15% fewer routes, and 10–20% higher average vehicle utilization across depots.
Those are the numbers this Raspberry Pi was asked to reproduce.
More info about the process and detailed depots can be found in this previous article
5. What the optimizer actually does
The optimizer is not just calculating shortest paths.

DLA7, Solution for Los Angeles depot with 174K stops, 975 Optimizer routes.
It builds a complete fleet plan:
- assigns stops to vehicles
- groups deliveries into compact operational territories
- balances load between routes
- respects physical capacity constraints
- optimizes the visit order within each route
- repairs boundary inefficiencies between neighboring routes
- returns executable driver optimized routes.
The core architectural idea is to avoid a monolithic solver. Because no global state is shared between depots, the same decomposition that lets one Pi process the dataset serially is exactly what lets a cluster process it in parallel.
More detailed architecture document can be found in this paper
6. Baseline Reference from previous experiments
On the MacBook Pro M4, the optimizer reached an average throughput of approximately 800 stops/second. At that pace, a 1,000,000-stop workload is completely planned in roughly 20 minutes.
A Raspberry Pi 400 is dramatically weaker than an M4 Pro: fewer cores, lower clock speed, lower IPC, much less memory, and much slower storage.
Given the massive performance gap between both machines, this desktop-class result served as our upper-bound reference point.
7. The actual run
The experiment was executed using the exact same benchmark configurations:
Dataset: Amazon Last Mile Routing Challenge Depots: 17 Stops: 1,048,575 Packages: 2,530,000
Here is how the Raspberry Pi hardware performed:
- Total Runtime: 9h 57m Average Throughput: 25 stops/second Peak RAM: 3.07GB

Performance monitoring on a Raspberry Pi 400 processing the DSE5 depot (78,039 stops). All 4 CPU cores are at 100% capacity running under a Python virtual environment, while RAM usage remains stable at 55%.
How the scheduler managed resources during the run
The 3.07GB peak RAM wasn’t an accident, it was the result of a wave-based scheduling system that monitors real-time hardware state and dynamically controls how much work enters the pipeline at any moment.
Instead of loading the full dataset and hoping it fits, the scheduler continuously evaluates available memory and CPU utilization, then decides whether to launch the next batch of work or wait for the current one to drain.
To put that throughput into perspective, an average of 25 stops per second means that a single Raspberry Pi 400 has the structural capacity to optimize roughly 2 million deliveries in a 24-hour window. That isn’t just a proof of concept, it’s a production-capable baseline.
But what if we demand enterprise-grade speed? What if we need to plan Amazon’s entire global operation of 20 million packages (assuming an average of 1.5 packages per stop, roughly 13.3 million stops) and need the results in exactly one hour?
The math is direct: processing 13.3 million stops in one hour requires a sustained throughput of about 3,700 stops per second. At 25 stops per second per node, you would need a distributed cluster of roughly 161 Raspberry Pis to plan Amazon’s entire worldwide daily logistics in under 60 minutes.
Leave those same 161 units running for a full 24-hour cycle and their combined capacity reaches approximately 320 million stops per day.
Current industry estimates place the entire global daily volume of all e-commerce and courier deliveries combined at roughly 350–380 million stops. That means 161 Raspberry Pis running continuously would cover the vast majority of the world’s daily delivery volume.
8. Identical Logic, Constrained Hardware
Running on a limited device is only half the story. The real question was whether the optimization quality would survive the bottleneck.
In our previous experiment, the optimizer didn’t just plan routes faster than Amazon, it produced measurably better ones: the distance, route-count, and utilization gains reported earlier.
Those metrics were never a consequence of raw computing power. They were a consequence of the architecture.
Because the Raspberry Pi preserves the exact same engine end-to-end, from the initial clustering logic to the dynamic rebalancing between neighboring routes, the output remains untouched. What changes is throughput (a 25–30x slowdown); what does not change is the mathematical quality of the plan.
The routes generated on the Pi are identical to those produced on a high-end server. Fleet utilization targets are met, capacity constraints are respected, and territorial divisions remain perfectly clean.
More metrics and scenarios from previous article here: https://medium.com/@martinvizzolini/a-last-mile-optimizer-that-outperforms-amazons-routes-on-a-laptop-24242f93eb74
9. What the scaling charts show
After the run completed, I compared the Raspberry Pi results against the same planning pipeline on my MacBook M4 Pro.
The result I was looking for was not absolute speed. I wanted to see if the structural shape of the runtime curve would survive the hardware downgrade
If the architecture were truly hardware-sensitive, the Raspberry Pi’s curve would have become chaotic, exploded exponentially with scale, or hit a sharp nonlinear failure point.
9.1 The Raspberry Pi is slower, but the curve survives

Runtime scaling across hardware classes
The Raspberry Pi is significantly slower, as expected, but the runtime curve follows the exact almost same geometric progression as the M4 Pro. As the workload scale grows, both machines track the same predictable pattern. The entire planning pipeline scaled successfully without requiring a high-end hardware budget.
9.2 Log-log scaling: same shape, different slope

Log-log view: the scaling pattern remains close to linear
On this chart, near-linear behavior appears as a clear, straight line. While the Pi operates on a different throughput plane, it preserves the exact same structural predictability: as data volumes grow, runtime scales linearly.
When both axes are logarithmic, near-linear scaling appears as a straight line. Larger depots are relatively cheaper per stop than smaller ones. Both R² values exceed 0.96, confirming that the scaling behavior is stable and predictable across the full range of depot sizes.
9.3 Depot-by-depot runtime

Runtime by depot: same workload, different hardware budget
The Raspberry Pi was slower on every single one, which is obvious. The breakthrough is that every single depot successfully completed processing.
Each bar pair represents one depot (blue for the M4 Pro, orange for the Raspberry Pi 400). The log scale is necessary because the two machines differ by more than an order of magnitude in absolute runtime. The trendlines show that both hardware classes grow at a consistent rate as depot size increases, with no depot producing an unexpected spike or collapse. DLA7 (Los Angeles, 174K stops) is the largest workload and the rightmost bar, still following the same trend as the smallest depots.
9.4 Marginal cost per 1,000 stops

This chart removes the effect of depot size and focuses on the marginal cost of planning each additional 1,000 stops. To be clear, this metric is a straightforward performance benchmark calculated directly by dividing the total execution time by the total number of stops in that specific workload (and normalized to a 1,000-stop unit). It is simply a measure of raw processing speed over routing volume.
The M4 Pro operates in a tight band between 1.1 and 2.3 seconds per 1,000 stops, with an average of 1.5s and a standard deviation of 0.29, less than 20% relative variation across 17 depots spanning 8K to 174K stops.
The Raspberry Pi 400 runs in a wider band, between 31 and 52 seconds per 1,000 stops, with an average of 40s and a standard deviation of 5.9, about 15% relative variation. Wider in absolute terms, but proportionally just as stable as the M4 Pro.
The wider absolute spread on the Raspberry Pi is expected: with constrained CPU, memory, and slow microSD I/O, factors like route density, geographic clustering complexity, and graph-loading costs carry proportionally more weight.
On both machines, the band stays bounded rather than drifting upward as depot size grows. That is the key result: the Raspberry Pi is roughly 27x slower per 1,000 stops than the M4 Pro, but the shape of the curve is the same.
10. From One Cheap Node to a Distributed Planning Layer
Hardware is an accelerator, not a dependency
In many legacy routing systems, heavy infrastructure is a hard dependency. They require massive machines, enormous memory footprints, or specialized cloud environments just to keep the solver from crashing under a large-scale VRP workload. This experiment shows the opposite for our architecture: hardware is an accelerator, not a requirement.
When you decouple the mathematical solution from raw computing power, the hardware choice only changes the slope of your throughput curve, never whether the problem is solvable. A weaker machine doesn’t fail, it simply takes longer to reach the same answer. That distinction is the entire point of the experiment.
One weak node generalizes to a cluster
That property is also what makes horizontal scaling trivial. Because the engine doesn’t rely on a single, massive, shared solver state, the global workload breaks cleanly into independent, atomic units.
If one extremely weak node can process the workload correctly, then many cheap nodes can become a distributed planning layer. The Raspberry Pi is just a proxy for low-cost compute: ARM servers, mini PCs, edge devices, warehouse machines, or small cloud instances.
Need real-time results? Add nodes. Need low operating costs? Run fewer, cheaper ones.
The architecture doesn’t break under constraint: it just adjusts its throughput.
This flips the economics of the industry
Traditional routing APIs restrict operations with strict request caps and tie performance to heavy cloud infrastructure. While this localized, decentralized cluster setup is an experimental proof of concept rather than a live production environment, it serves as a powerful example of what is technically possible. By scaling horizontally, an array of these lightweight machines is theoretically capable of planning hundreds of millions of stops a day, with absolutely no request caps or recurring processing limits.
The routing industry built its business model on the premise that massive data requires massive infrastructure. This experiment proves it doesn’t. It requires a lightweight, linearly scalable architecture.
Hardware governs speed. Architecture governs results.
11. Next Steps & Documentation
The infrastructure is ready, and we are preparing the public environment for launch. Right now, the interactive documentation and OpenAPI specifications are fully available so you can explore the architecture, review the granular constraint capabilities, and see how the endpoints are structured.
You can dive into the documentation today at: 👉 **demo.vepathos.com**
What’s coming next: In the next few weeks, we will open up account creation so external users, developers, and teams can generate API keys and start live testing the optimization engine with their own workloads.
If you are managing high-volume enterprise logistics or building modern route-planning tools, take a look through the docs today and get ready for the sandbox launch.
References and previous experiments
- Last-Mile Route Optimization at 1 Million Stops, With Near-Linear Scaling https://medium.com/@martinvizzolini/last-mile-route-optimization-at-1-million-stops-with-near-linear-scaling-e4d4b0118e80
- A Last-Mile Optimizer That Outperforms Amazon’s Routes on a Laptop https://medium.com/@martinvizzolini/a-last-mile-optimizer-that-outperforms-amazons-routes-on-a-laptop-24242f93eb74
- Technical paper: Rethinking Last-Mile Routing at Scale: Near-Linear Planning on Commodity Hardware https://optimization-online.org/2026/04/rethinking-last-mile-routing-at-scale-near-linear-planning-on-commodity-hardware/
- Amazon Last Mile Routing Research Challenge dataset https://registry.opendata.aws/amazon-last-mile-challenges/
- Analysis of the Amazon Last Mile Routing Dataset https://www.researchgate.net/publication/373923950_Understanding_Last-Mile_Delivery_An_Analysis_of_the_Amazon_Last_Mile_Routing_Dataset
메타데이터
- post_id
- e70fde56044c
- slug
- i-ran-the-amazon-last-mile-routing-challenge-on-a-raspberry-pi-400-e70fde56044c
- url
- https://medium.com/@martinvizzolini/i-ran-the-amazon-last-mile-routing-challenge-on-a-raspberry-pi-400-e70fde56044c
- canonical_url
- https://medium.com/@martinvizzolini/i-ran-the-amazon-last-mile-routing-challenge-on-a-raspberry-pi-400-e70fde56044c
- author_url
- https://medium.com/@martinvizzolini
- status
- ok
- fetched_at
- 2026-06-09 15:37:30