Sentiment Analysis using Classification
How to calculate sentiment score based on historical data
Sentiment Analysis using Classification
How to calculate sentiment score based on historical data

yin yang coffee by Alex from Unsplash
Sentiment analysis is a commonly used text analysis technique to determine whether the text is positive, negative, or neutral. It can be used to understand the satisfaction of the audience and a great feature for forecasting. If you have a well-labeled dataset(with a ground truth sentiment score), you can consider using text classification to calculate the sentiment score.
Benefits of using classification:
- Usage of classification can automatically capture patterns from historical data that are specific to the industry or topic. You do not need to search for a positive or negative word list specific to the topic.
- It is more convenient to include different bag-of-words calculations as the feature for sentiment classification because you can directly define that in the existing package. Those negation phrases like ‘not good’ and ‘do not like’ can be captured but it is hard to capture all those phrases by yourself.
- There are many existing classification algorithms for you to choose from. The potential for a best-fitted model is high.
The only downside: You need to have labeled data!
Dataset
The data we are using is Yelp labeled dataset from Kaggle. The first column is the review text and the second column is the ground truth of sentiment score(1 being negative sentiment and 2 being positive sentiment)
Firstly let us split the dataset into training and testing sets (you can decide on test_size based on the amount of data you have). If you have a sufficiently large dataset you can choose to lower the proportion of the testing set.
from sklearn.model_selection import train_test_split
Y=sample_new['rating']
X=sample_new['review']
X_train,X_test,Y_train,Y_test=train_test_split(X,Y,test_size=0.2)
Data Pre-Processing
Here we are using two sklearn packages:
- **CountVectorizer: It converts the text into a token count matrix. The token can be single words or 2-gram or 3-gram phrases. It also allows you to specify n_gram range, stop-word removal, etc** in the parameter.
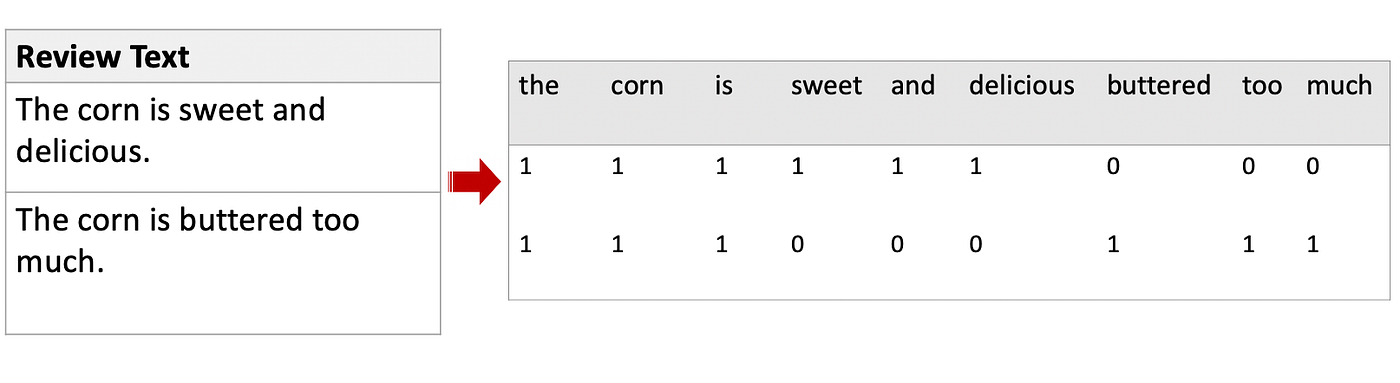
Example on two review sentence after CountVectorizer(single word token)
- **TfidfTransformer: Here we need to understand TF-IDF first. TF-IDF full name is ‘term frequency-inverse document frequency. Term frequency means how frequently the word or phrase occurs in the whole text. However, if a term occurs too frequently then it conveys less useful information and TF-IDF calculation uses log function to scale down terms that occur too frequently**. You can also choose to just use term frequency instead.
TF-IDF(term, documents) = term_frequency(term, document) log(Total count of documents/(document frequency+ 1))*
For example, a data science article usually has the word ‘data’. However, it usually does not tell you whether the article’s opinion(just a general word). TF-IDF transformer basically transforms the word count matrix into a frequency matrix.
from sklearn.feature_extraction.text import CountVectorizer
vectorize = CountVectorizer(ngram_range=(1,2))
X_train_counts=vectorize.fit_transform(X_train)
from sklearn.feature_extraction.text import TfidfTransformer
tfidf_transformer = TfidfTransformer()
X_train_tfidf = tfidf_transformer.fit_transform(X_train_counts)
X_train_tfidf.shape#(24000, 44563)Here, I specify tokens to be single words or 2-gram words in the ngram_range parameter(you can change the (1,2) to n_gram you want) and finally output the frequency matrix as the feature for classification.
Classification model and evaluation
Finally, modeling part
There is no restriction on what to use, you can take a sample of the whole dataset and see which model suit best for the sample in terms of accuracy or other evaluation metrics. You can refer here to how you can evaluate your classification model.
from sklearn.linear_model import LogisticRegression
lr=LogisticRegression().fit(X_train_tfidf, Y_train)
X_test_count=vectorize.transform(X_test)
X_test_tfidf=tfidf_transformer.transform(X_test_count)predicted=lr.predict(X_test_tfidf)#evaluate accuracy
np.mean(predicted == Y_test)
#0.89883Logistic regression gives almost 90% of accuracy rate
from sklearn import svm
from sklearn.pipeline import Pipeline
text_svm = Pipeline([
('vectorize', CountVectorizer()),
('tfidf', TfidfTransformer()),
('svm', svm.SVC()),
])text_svm.fit(X_train,Y_train)
predicted=text_svm.predict(X_test)
np.mean(predicted==Y_test)
#0.9Here I used sklearn package pipeline to combine all processes together. Support Vector Machine gives exactly 90% accuracy.
from sklearn.neural_network import MLPClassifier
text_nn = Pipeline([
     ('vectorize', CountVectorizer()),
     ('tfidf', TfidfTransformer()),
     ('nn', MLPClassifier(solver='lbfgs', alpha=1e-5,
                     hidden_layer_sizes=(5, 2), random_state=1)),
 ])
text_nn.fit(X_train,Y_train)
predicted=text_nn.predict(X_test)
np.mean(predicted==Y_test)
#0.88167Deep learning MLP classifier can reach around 88%
Further Improvement
- Parameter tuning for CountVectorizer: parameters like n_gram_range, maximum/minimum document frequency to retrieve the ideal frequency score for classification. This would require a good level of understanding of the dataset and also some trial and error to reach the ideal output
- Parameter tuning for classification model: you can use search methods like grid_search or random search to find the best set of parameters in terms of accuracy or other metrics. This would cause the whole process to run much longer.
- Classification model evaluation: Evaluate performance on multiple metrics like recall, precision rather than simply accuracy
Conclusion
The quantity of data is important for classification performance. If you do not have a sufficiently large dataset, do not make the model too complicated because there is a risk of overfitting. In addition, an initial understanding of the data is important, you should take out some sample text to understand more about the pattern of the data before doing all those work.
Lastly, if you do not have labeled data and want to see how you can calculate sentiment score by counting positive/negative words you can refer to my other article below.
[embed]Design your own Sentiment Score Sentiment Analysis in pandastowardsdatascience.com
메타데이터
- post_id
- e73da5b4159f
- slug
- sentiment-analysis-using-classification-e73da5b4159f
- url
- https://medium.com/data-science/sentiment-analysis-using-classification-e73da5b4159f
- canonical_url
- https://medium.com/data-science/sentiment-analysis-using-classification-e73da5b4159f
- author_url
- https://medium.com/@songhaowu
- status
- ok
- fetched_at
- 2026-07-30 11:11:08