Guilt by Association: How Graph ML Exposes Hidden Malicious Networks
Introduction
Guilt by Association: How Graph ML Exposes Hidden Malicious Networks
Introduction
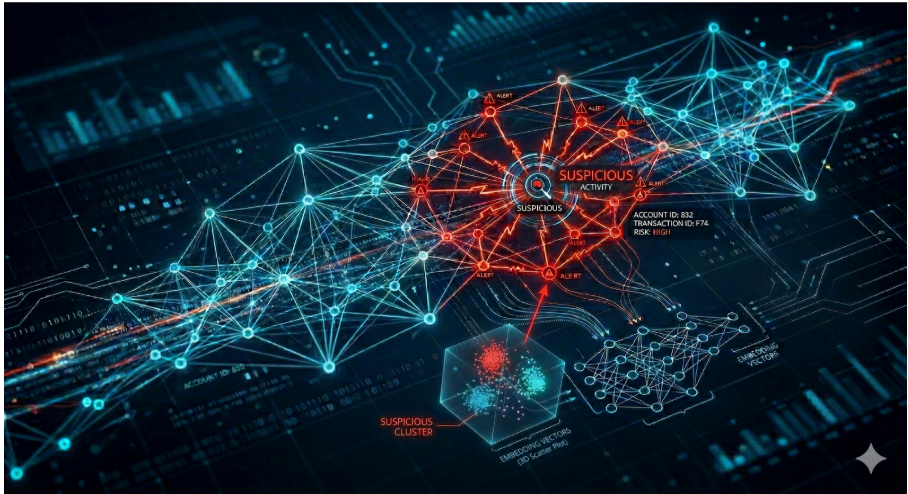
Online marketplaces face a persistent challenge: malicious actors find ever-evolving ways to exploit the platform. Traditional rule-based filters — blacklists, keyword matching, velocity checks — catch known patterns but struggle with novel deceptive tactics. More advanced ML approaches (text classifiers, behavioral scoring models) improve on this by learning subtler signals from message content and user activity, but they evaluate each user in isolation. A user’s relationship to other known malicious actors is not directly captured as a feature, meaning coordinated networks where individual accounts appear clean can slip through undetected.
What if we could detect suspicious behavior not just by what a message says, but by who the sender is connected to?
This is the core idea behind our GraphML Filter: a graph-based machine learning approach deployed in our fraud detection pipeline. By modeling users as nodes in a network and their shared attributes as edges, we surface malicious behavior that would be invisible to both rule-based and conventional ML filters.
Why Relationships Matter: A Graph ML Approach?
Malicious actors rarely operate in isolation. They reuse devices, rotate email addresses, share IP addresses, and target the same listings. These patterns create a hidden web of connections that traditional tabular models miss.
Consider a simple scenario:
- User A sends suspicious messages and gets flagged.
- User B is a new account but shares the same device ID as User A.
- User C has never been flagged, but their account was created nearly the same time as User B and their message text carries a similar intent to User A’s malicious messages.
A rule-based system might catch User B through device ID blacklisting. A text classifier might flag User A’s message content — but User C’s wording is just different enough to evade it. Only by looking at the network do we see the full picture: User C was created in a temporal burst alongside User B, sends messages with suspiciously similar intent — therefore likely the same/similar user or working alongside.
The Key Insight
The problem here is fundamentally a guilt-by-association problem at the network level. Graph ML formalizes this by:
- Encoding structural proximity — users close in the graph get similar representations.
- Propagating label information — known malicious labels “spread” through the network to unlabeled nodes.
- Capturing behavioral patterns — the shape of a user’s neighborhood becomes a predictive signal.
Architecture Overview
The pipeline follows a deliberate, knowledge-driven approach:
- Graph Design — The graph structure is not arbitrary. Edge types are defined based on functional domain knowledge: working closely with Customer Service teams, analyzing historical cases, and identifying which shared attributes consistently yield strong signals.
- Extensible Framework — The framework is built so that new edge types can be added easily, and each edge type carries a configurable weight reflecting its importance. For example, a shared device ID might carry more weight than a similar intent message, and these weights can be tuned as new deceptive patterns emerge.
- Graph Embedding Extraction — Once the graph is constructed, Node2Vec generates embeddings for every node, encoding each user’s structural position in the network.
- Feature Enrichment — The graph embeddings are combined with additional metadata features that don’t naturally fit into the graph structure. These tabular features — capturing user behavior patterns, account characteristics, and interaction dynamics — complement the relational signal from the graph.
- XGBoost Training — The enriched feature set (embeddings + metadata) is passed to an XGBoost classifier, trained on historically labeled data.
- Inference — For new, unseen users: their nodes are added to the existing graph, embeddings are extracted in the context of the full network, metadata features are appended, and the trained XGBoost model scores them.
Why Add Inference Users to the Same Graph?
This is a critical design choice. By inserting new users into the same graph as historically labeled users, their embeddings naturally reflect any connections to known malicious accounts. A new user who shares attributes with flagged accounts will end up with an embedding that “looks like” a risky actor — even if their own metadata appears clean.
Graph Construction — Domain-Driven Edge Design
A user-to-user graph is constructed where:
- Nodes represent individual users
- Edges connect users who share one or more attributes
Knowledge-Driven Edge Selection
The choice of which attributes create edges comes from direct collaboration with Customer Service and analysis of past cases. Not every shared attribute is useful — the goal is to encode relationships that historically correlate with coordinated malicious activity.
Each edge type is registered in the framework with:
- An attribute key
- A weight reflecting its signal strength
- A maximum group size threshold to handle high degree nodes
This modular design means adding a new edge type — is as simple as defining the attribute, its weight, and its group-size cap. No changes to the graph construction or embedding logic required.
Handling high degree nodes
Not all shared attributes are equally informative. A popular listing might receive thousands of legitimate messages, creating a “super-node” that connects a lot of users. Each attribute type has a configurable maximum group size — if too many users share an attribute, that group is excluded from edge creation, keeping the graph focused on meaningful connections.
Text Similarity & Temporal Burst Edges
Beyond shared metadata, few behavioural edge types are also added like:
- Text similarity edges: Users sending nearly identical or similar intent messages (above a high similarity threshold) get connected — catching templated, deceptive campaigns.
- Temporal burst edges: Users sending messages within tight time windows (e.g., X-minute buckets) get connected — catching automated, synchronized suspicious activity.
- Account activity: quantifying users account activity
Visualizing the Network
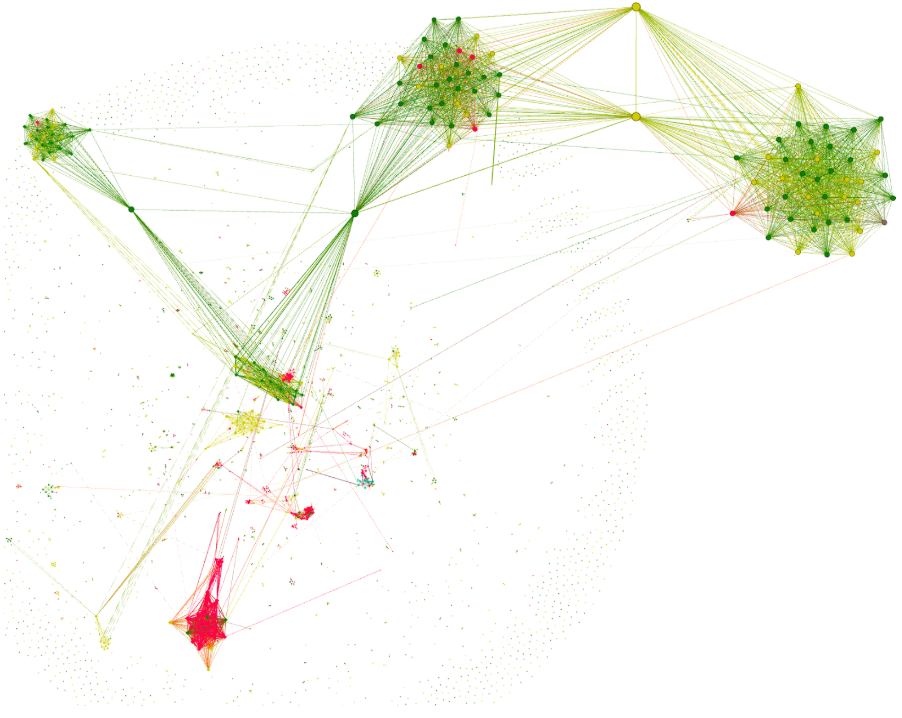
Red = MALICIOUS, Green = OK, Yellow = UNSURE
The graph above brings the approach to life. Each node represents a user: red nodes are confirmed malicious users, green nodes are safe, and yellow nodes are those the model is still uncertain about. What stands out immediately is how red nodes tend to cluster tightly together — forming dense malicious networks that share multiple attributes. This is exactly the signal that graph embeddings capture: users embedded in these clusters will naturally receive similar vector representations, making them easy for the downstream classifier to identify.
However, no approach is perfect. A few red nodes can be seen scattered among green clusters, successfully mimicking normal user behavior and evading detection through graph structure alone. This is precisely why graph embeddings are not used in isolation — they are combined with additional metadata features and fed into a classifier, giving the model a second lens to catch what the graph misses.
Node2Vec Embeddings — Turning Graph Structure into Numbers
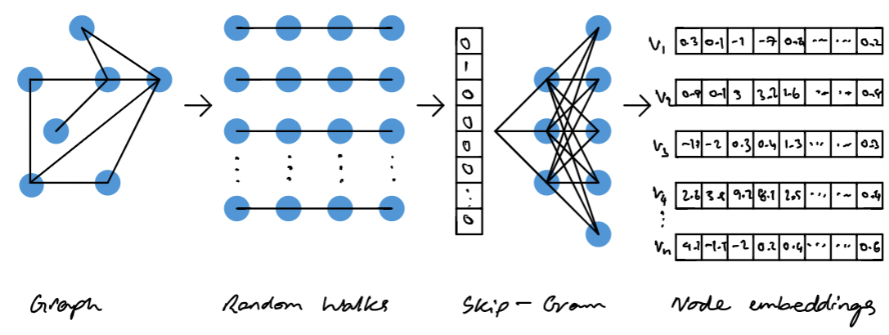
Once the graph is built, we need to convert its structure into numerical features that a classifier can consume. This is where Node2Vec comes in.
What is Node2Vec?
Node2Vec is an algorithm that learns low-dimensional vector representations (embeddings) for each node in a graph. The intuition draws from natural language processing: just as Word2Vec learns word meanings from the context in which words appear, Node2Vec learns node meanings from the network context in which nodes appear.
It works in three stages:
- Performing random walks from each node — like a random traveler wandering through the network, hopping from user to connected user
- Treating walk sequences as “sentences” — each walk produces an ordered sequence of user IDs, analogous to a sentence of words
- Training a Skip-gram model — nodes that frequently co-occur in the same walks get pushed closer together in embedding space
The key innovation of Node2Vec is its two hyperparameters, p and q, which control the walk behavior:
- p (return parameter): Controls the likelihood of immediately revisiting the previous node. High p discourages backtracking.
- q (in-out parameter): Controls whether the walk explores outward (BFS-like, capturing structural roles) or stays local (DFS-like, capturing community membership).
When both p and q are set to 1.0 (as in our default configuration), the walks behave like unbiased random walks — a balanced approach that captures both local community structure and broader network position.
Each user ends up with a 128-dimensional vector. You can think of this as a “fingerprint” of their position in the network.
Why Does This Work for Detecting Risky Users?
The embeddings capture the intuition that users in the same local network will have similar embeddings because:
- They share many connections
- Random walks starting from one malicious user will frequently visit other malicious users
- The resulting embeddings cluster suspicious accounts together in the 128-dimensional space
Crucially, this works transitively. Even if User C has no direct connection to the known malicious User A, if they’re connected through User B, the random walks will still create overlapping embeddings for all three. This is something a simple blacklist won’t be able to achieve.
A new user with no flagged history but strong graph connections to known malicious accounts will get an embedding that is similar to a risky actor — exactly what we want to feed into a classifier.
From Embeddings to Predictions — The XGBoost Classifier
Training
- Graph embeddings (128 dimensions) for each user.
- Metadata features that don’t fit naturally into the graph — capturing user behavior patterns, account characteristics, and interaction dynamics — are appended alongside the embeddings.
- The combined feature set is used to train an XGBoost classifier with binary labels.
Inference
- New users are inserted as nodes into the existing graph, with edges created based on the same attribute-sharing rules.
- Node2Vec embeddings are extracted for these new nodes — now in the full context of the labeled network.
- Metadata features are appended to the embeddings.
- The trained XGBoost model scores each user, producing a risk probability.
The combination of graph embeddings (capturing who you’re connected to) and tabular features (capturing what you do) gives the model a comprehensive view of each user. Neither alone is sufficient — a malicious actor might behave normally in isolation but be deeply embedded in a suspicious network, or vice versa.
Why XGBoost on Top of Graph Embeddings?
One might ask: why not use an end-to-end Graph Neural Network (GNN)? The two-stage approach (Node2Vec → XGBoost) has practical advantages:
- Interpretability: XGBoost provides feature importance, helping us understand which dimensions of the embedding space and which metadata features are most predictive.
- Speed: Node2Vec embeddings can be precomputed; XGBoost training is fast even on large datasets.
- Simplicity: No GPU infrastructure required. The entire pipeline can run on CPU.
- Modularity: The embedding and classification steps can be tuned independently.
Conclusion
Fraud detection is no longer just about catching bad messages — it’s about uncovering the hidden networks behind them. By modeling user relationships as a graph and combining structural signals with behavioral metadata, our GraphML Filter detects coordinated malicious activity.
The architecture is deliberately modular: new edge types can be added as deceptive tactics evolve, weights can be tuned without retraining the full pipeline, and the two-stage design keeps the system fast, interpretable, and easy to maintain.
Most importantly, this approach shifts detection from a reactive game of whack-a-mole to a proactive, network-aware defense — where even a seemingly clean account is exposed by the company it keeps.
By integrating state-of-the-art models and driving cross-sector innovation, we remain committed to ensuring the highest standards of user safety on our platform.
Author: Akshay Paliwal Data Scientist at mobile.de
메타데이터
- post_id
- e7722bcf2a14
- slug
- guilt-by-association-how-graph-ml-exposes-hidden-malicious-networks-e7722bcf2a14
- url
- https://medium.com/berlin-tech-blog/guilt-by-association-how-graph-ml-exposes-hidden-malicious-networks-e7722bcf2a14
- canonical_url
- https://medium.com/berlin-tech-blog/guilt-by-association-how-graph-ml-exposes-hidden-malicious-networks-e7722bcf2a14
- author_url
- https://medium.com/@akshay.paliwal_8817
- status
- ok
- fetched_at
- 2026-06-13 07:35:29